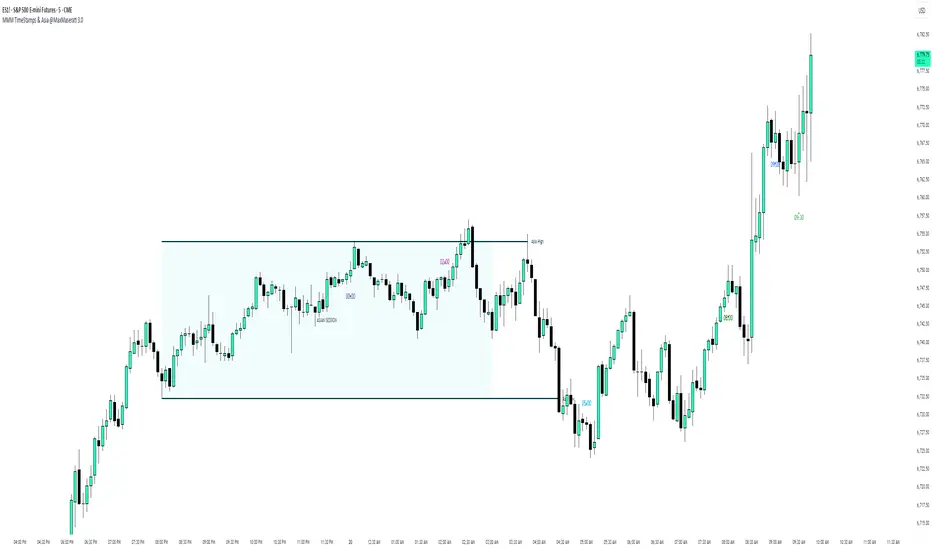
MMM Time Stamp & Asian Session @MaxMaserati 3.0═════════════════════════════════════════════════════════════MMM TimeStamps & Asia @MaxMaserati 3.0 ═════════════════════════════════════════════════════════════
This indicator helps intraday traders identify critical market timing and key liquidity zones. It displays customizable time labels at major market events (market open, pre-market moves, session changes) and automatically tracks the Asian session range with high, low, and mid-level lines.
The Asian session levels act as important reference points for institutional order flow and potential support/resistance zones during subsequent trading sessions. Lines extend forward until broken, helping traders identify when price takes liquidity or respects these key levels.
The visual background and customizable labels make it easy to spot session boundaries and plan trades around these high-probability zones.
Ideal for traders following ICT concepts, session-based strategies, SMC or anyone needing clear visual markers for time-based analysis on intraday charts.
Search in scripts for "ict"
Live Session Extremes: Asia / London / NY (5m)This script automatically tracks and plots the live high and low levels of the three major Forex trading sessions:
Asia Session (18:00–03:00) — Teal
London Session (03:00–08:00) — Blue
New York Session (08:00–12:00) — Red
Designed specifically for 5-minute charts, it updates in real time as each session forms new highs or lows.
You always see the most recent session’s levels, cleanly plotted and color-coded on your chart.
✔ Features
Live updating lines for each session’s high & low
Lines anchored to the exact candles that created the extreme
Auto-cleaning: old session levels are deleted when a new session begins
Clear labeling:
Asia High / Asia Low (Teal)
London High / London Low (Blue)
NY High / NY Low (Red)
Extend-right option for projecting session levels into future price action
Built for precision session-based strategies such as:
Liquidity grabs
Session sweeps
BOS/CHOCH analysis
ICT-style trading
High/low power levels

ID Candle Body % Star Rating + SMC ToolkitThis tool combines strong-body candle detection, trend analysis, SMC-based setups, session levels, VWAP, Donchian Channels and live alerts. It’s built to help you read momentum, structure and volatility on any intraday chart.
1. Strong Body Candle Detection
The script highlights candles with exceptional bodies using three conditions:
• Body is larger than the previous five candles
• Body makes up more than 85% of the entire candle
• Both conditions happening at the same time
These signals help you spot strength or exhaustion in real time.
2. EMA Trend Layer
Three EMAs (50/100/200 by default) plot the overall trend.
When enabled, the area between the fast and slow EMAs fills with a soft color to show bullish or bearish bias at a glance.
3. Bullish and Bearish Setup (ICT-style patterns)
The indicator marks classic two-candle continuation setups:
• Bullish setup with a break above the previous high and an FVG
• Bearish setup with a break below the previous low and an FVG
You can also enable “low break” and “high break” variations to track liquidity sweeps.
Each setup has its own alert option.
4. Four Key Market Sessions
The script plots Asia Open, Midnight Open, London Open and New York Open.
Each session shows:
• A real-time box
• High, low and midpoint
• Optional extended lines projecting forward
These levels often act as reaction zones on lower timeframes.
5. VWAP With Optional Bands
You can anchor VWAP to the session, week, month, quarter or year.
Bands can be calculated using standard deviation or a percentage.
There’s also an option to hide VWAP on higher timeframes.
6. Donchian Channel
A classic 20-period DC is included to provide an additional structure reference for breakouts and trend ranges.
7. Real-Time Alerts
Alerts trigger only once per bar and cover:
• Bullish setup
• Bearish setup
• Liquidity sweep variations
• VWAP star-rating (if enabled in the code block)
Great for traders who monitor multiple pairs.

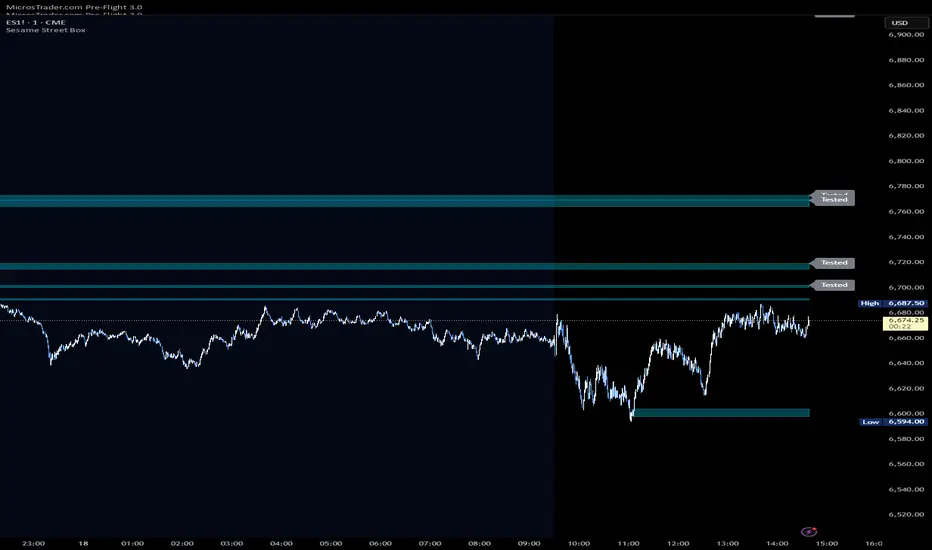
Sesame Street BoxThe Sesame Street Box is a 100% original candlestick pattern by it's creator. ICT invented order blocks, I have invented the Sesame Street Box.
This candlestick pattern draws a retouch box. In particular, in an up trend, it finds one down closed candle that has at least 3 up closed candles before it, and 3 or more up closed candles after it. 3-1-3 candle stick pattern. The 3 or more candles after it MUST leave the candlestick range of the down closed candle for the box to draw. The box is drawn from the low of the down closed candle to the high of the down closed candle and extended to the right. Once price reaches into this box, you would long off the top of the rendered box for continuation.
The reverse is true for shorts. For shorts, there would be 3 or more down closed candles, 1 up closed candle, followed by 3 or more down closed candles that leave the up closed candle's range. If these conditions are met, a box is drawn. The box is drawn from the low of the up closed candle to the high of the up closed candle and extended to the right. Once price reaches into this box, you would short off the bottom of the rendered box for continuation.
This indicator also provides 2 optional time frames to render the same pattern on your active chart. If you do not want to use these, just leave the option set as chart, and only the active timeframe will render.
There is also an option to toggle how to handle the boxes once they are invalidated. Either you can delete them, or choose to have them stop rendering at the candle that invalidated them.
Volume-Confirmed FTR Zones [AlgoPoint]FTR Zone Indicator — Fail To Return Zones (With Volume Confirmation)
Advanced Smart Money Zone Detection for Institutional Orderflow
The FTR Zone Indicator is a professional-grade tool designed for traders who follow Smart Money Concepts (SMC), ICT methodologies, or institutional orderflow. It automatically detects Fail To Return Zones (FTR) — high-probability supply and demand areas formed after strong displacement moves.
By combining impulse detection, base identification, and volume confirmation, this indicator highlights zones where price is most likely to react, reverse, or mitigate shortly after structure breaks.
⸻
⭐ What Are FTR Zones?
FTR zones (Fail To Return zones) are price areas where:
1. A strong displacement / impulse candle is formed
2. That impulse originates from a small consolidation (base)
3. Price moves away aggressively
4. AND fails to return immediately to the origin area
These zones often indicate:
• Institutional orders
• Imbalance
• Hidden liquidity
• Origin of a trend leg
• High-probability mitigation points
This indicator fully automates the detection and visualization of such areas.
🔍 How the Indicator Works
1. Impulse Detection
The indicator identifies a valid impulse candle using:
• ATR-based bar range filter
• Trend-aligned candle body direction
• Optional volume confirmation
Only large, meaningful institutional candles qualify — filtering out noise.
2. Base Zone Identification
Before every impulse, the tool finds the micro-consolidation base using:
• Highest high of the last X bars
• Lowest low of the last X bars
This base becomes the potential FTR zone.
3. FTR Zone Creation
When a valid impulse is detected:
• Bullish impulse → Demand FTR zone
• Bearish impulse → Supply FTR zone
The zone is immediately drawn on the chart using box.new().
4. Zone Extension
Every zone continuously extends to the right as price evolves, allowing you to track:
• Mitigation
• Retests
• Reaction points
• Liquidity sweeps
5. Invalidation Logic
Zones automatically delete when violated:
• Demand zone invalid if close < zone low
• Supply zone invalid if close > zone high
This keeps the chart clean and helps focus only on active, high-value areas.
🎛️ Key Features
✔ Automatic FTR Zone Detection
Instantly identifies institutional origin zones based on real impulse and displacement.
✔ Volume-Based Filtering
Ensures only high-volume impulses (true institutional orders) create zones.
✔ Supply & Demand Coloring
• Bullish FTR → Demand Zone (Teal tone)
• Bearish FTR → Supply Zone (Red tone)
✔ Safe Zone Storage
Fault-tolerant logic ensures no array errors, invalid zones, or broken visuals.
✔ Auto-Extending Boxes
Real-time zone updates with precise historical mapping.
✔ Smart Invalidation
Zone is removed only when fully broken, preventing false signals.
✔ Clean, Non-Repainting Logic
Impulse detection and zone placement are confirmed only on bar close.
📈 How to Use It (Example Schenarios)
For Reversals or Continuations
• Look for price reacting or mitigating inside a zone
• Use as entry confirmation in trend continuations
• Combine with FVG, BOS/CHOCH, liquidity sweeps, or premium/discount zones
For Scalping or Intraday Trading
• High-probability countertrend entries
• Reaction-based setups at institutional footprints
For Swing Traders
• Identify weekly/daily origin zones
• Plan entries around large displacement points

Timed Swing Points [Free +] | cephxsTimed Swing Points | cephxs
This indicator is published under the Mozilla Public License 2.0. © cephxs, © fstarcapital
1. OVERVIEW
Timed Swing Points (TSP) highlights the timing of recent confirmed swing highs and lows and annotates them with context-aware time labels. Instead of drawing traditional pivot shapes and cluttering the chart, this streamlined free edition focuses on the temporal structure: WHEN pivots occur, not just WHERE . It helps discretionary traders quickly scan for clustering of swings around repeating intraday minutes or higher‑timeframe day names.
2. WHAT IT DOES
Detects swing highs and lows using a sensitivity factor (len)
Adds a time (or day name on daily timeframe) label at each qualified swing
Optional filtering to only show labels during defined "key time" minute windows
Automatically adapts label content to timeframe:
Intraday: HH:MM (24h or 12h model depending future input extension)
Daily: Full or abbreviated weekday names
Respects a maximum number of displayed swing points to keep charts clean
3. CORE FEATURES
Swing Detection: Uses ta.pivothigh(len, len) / ta.pivotlow(len, len); a pivot is confirmed only after enough bars pass, avoiding repaint on the current bar.
Time Labeling: Places labels offset back to the pivot bar index (bar_index - len).
Key Time Filtering: When enabled, labels only show if the pivot's minute is inside one of three windows: 00–10, 24–36, 50–59 minutes. These windows target common liquidity / volatility phases.
Day Name Mode: On daily timeframe, labels display full (e.g., Monday) or abbreviated (e.g., Mon) day names depending on the Full Day Names setting.
Point Limiting: Oldest labels are removed once Maximum Points Displayed is exceeded.
Clean Visual Footprint: Shape markers and lines are disabled in this free build (internally set to constants). Focus remains on time annotation density rather than price level persistence.
4. INPUTS & PARAMETERS
Sensitivity (len): Default 2. Swing pivot width. Higher = fewer, broader swings
Maximum Points Displayed: Default 10. Caps number of recent swing labels retained
Show Time Labels: Default true. Master toggle for all time labels
Key Times Only: Default true. Restricts labels to predefined minute windows
Prefix: Default blank. Optional text prepended to each label
High Time Color: Default red. Text color for swing high labels
Low Time Color: Default blue. Text color for swing low labels
Text Size: Default Small. Controls label text size (Tiny → Huge)
Full Day Names: Default true. Show full weekday names on daily timeframe
Internal Constants (Not User-Adjustable):
Shape display flags (show_high, show_low) set false
Line display and deletion logic present but disabled
Timezone currently fixed to America/New_York in Automatic mode; DST handled by TradingView engine
5. HOW SWING TIME IS DETERMINED
For each bar the script evaluates pivot conditions
A pivot is confirmed only after the right width (len) bars complete—the label is then placed len bars back
Time extraction uses the pivot's bar timestamp and converts:
Intraday: Formats HH:MM (24-hour). Infrastructure exists for future 12h toggle
Daily: Converts timestamp to a weekday name
Key time filter checks the pivot's minute bucket. If outside defined windows and filter is active, the label is skipped
6. TIME WINDOWS LOGIC (KEY TIMES ONLY)
Minutes 00–10 → Opening sequence & initial liquidity sweep
Minutes 24–36 → Post initial rotation / mid-hour inflection zone
Minutes 50–59 → Pre hour close / micro-structure reshuffle
ICT Traders: View as macros and note when macros form swing points
This pattern helps isolate intraday zones where structural shifts frequently occur, reducing noise from less consequential pivot timings.
7. USAGE GUIDELINES
Start with Sensitivity = 2 or 3 for most liquid intraday symbols. Increase on higher timeframes to avoid excessive clustering
Key Times Only ON: Ideal for focusing on session rotation pivots. OFF: Use for full discovery when studying custom time behaviors
Combine with volume profile or divergence tools to qualify time-labeled swings (e.g., a swing forming at 09:30 NY vs. random mid-bar)
Apply on lower timeframes (1–15m) to map recurring patterns or on Daily to see weekly rhythm changes
8. PERFORMANCE & LIMITATIONS
Efficient: Only stores arrays of recent labels and prunes aggressively
No Alerts: Current version does not fire alerts (Future Pro+ variant may include swing-time alerting)
Timezone: Fixed to America/New_York
9. BEST PRACTICES
Use a neutral chart theme; contrasting label colors amplify swing clusters
When analyzing historical pattern reliability, temporarily raise Maximum Points Displayed to 50–100 then revert to lighter values for live trading
Prefix field: Add a tag like "T:" if mixing multiple custom time tools to differentiate label origin
10. FAQ
Q: Why do some expected swings not show?
If they confirm outside key minute windows and filtering is ON, they're intentionally suppressed.
Q: Can I get price levels drawn?
Not in this free build. Lines/shapes are disabled intentionally.
Q: Does it repaint?
Pivot confirmation waits for the right width; labels appear only after the swing is locked in. Past labels aren't retroactively moved.
Q: Can I monitor multiple symbols at once?
This version is single‑symbol; use layouts or Pro variants for multi-source overlays.
11. CHANGELOG
v1.0 (Initial Free Release): Core swing time labeling, key time filter, day name adaptation, performance improvements. More updates coming.
12. DISCLAIMER
This tool is an analytical overlay designed for timing context only. It is NOT a standalone buy/sell signal. Always validate swings with broader market structure, liquidity pools, and risk management. No guarantee of future performance.
If you find this useful and want advanced variants (alerts, multi‑timezone, clustering metrics), reach out via TradingView. Feedback drives improvements.

NHEST Liquidity Ultra Minimal (Short Labels)
NHEST Liquidity Ultra Minimal is a clean, lightweight, and distraction-free liquidity mapping tool designed for traders who want institutional-grade clarity without chart noise.
It highlights only the most important liquidity zones — nothing extra, nothing cluttered — giving you a pure view of where price is most likely to react, reverse, or sweep.
✔ Ultra-Minimal Design
This indicator removes all unnecessary visuals and focuses solely on key liquidity levels derived from price structure. No boxes, no labels, no shading overload — just the critical price zones that matter.
✔ Smart Liquidity Levels
NHEST Liquidity Ultra Minimal automatically detects major liquidity pools such as:
• Buy-side liquidity (BSL) above price
• Sell-side liquidity (SSL) below price
• Primary and secondary liquidity shelves
These levels help traders anticipate where smart money may target next.
✔ Higher-Timeframe Stability
Built to work cleanly across all timeframes, from scalping to swing trading. Liquidity zones update smoothly and remain stable even during high-volatility conditions.
✔ Perfect for Smart Money Concepts (SMC)
This indicator is ideal for traders who follow:
• ICT concepts
• Liquidity hunts
• Market structure
• Breakers & mitigation blocks
• Sweep-into-imbalance setups
✔ No Lag — No Repaints
All levels are calculated in real-time using non-repainting logic.
✔ Clean Visuals for Any Style
Whether you’re using a dark chart or a white chart, NHEST Liquidity Ultra Minimal keeps your workspace clean, organized, and easy to read — perfect for professional analysis, live streaming, and trading education content.
⸻
How to Use
1. Identify zones above price (BSL) as potential liquidity targets for bullish expansions.
2. Identify zones below price (SSL) as downside liquidity targets for bearish expansions.
3. Expect price to gravitate toward the nearest liquidity pool during consolidation.
4. Use the levels to anticipate sweeps, reversals, or continuation moves.
⸻
Best For
• Smart money traders
• Gold (XAUUSD) traders
• Crypto, Forex, Indices
• Scalpers & intraday traders
• Price-action purists
• Traders who want a clean chart
⸻
Disclaimer
This script is for educational purposes only and is not financial advice.
Always use proper risk management.
By NHEST TRADING LLC

FVG Snper PRO🎯 FVG Sniper — Fair Value Gap Signal Engine
FVG Sniper is a professional imbalance-based entry tool built around the Nasdaq futures (NQ/MNQ) — but the signal logic is general enough to apply to many liquid instruments (indices, FX, crypto, metals).
It automatically detects Fair Value Gaps (FVGs), tracks their lifecycle, and fires rule-based long/short signals only when price shows decisive intent away from those imbalances.
🔍 What FVG Sniper Does
Detects FVGs automatically (no pivots)
Uses a strict 3-candle pattern to locate bullish and bearish imbalances directly from price action.
Tracks each FVG over time
For every FVG, FVG Sniper tracks:
When it was created
Whether it has ever been tapped
Whether it has been tapped since the last trade
Whether it has been invalidated (“inversion close”)
Session-gated execution
FVGs can be formed and tapped any time.
Only bars inside a defined signal session (e.g. 09:30–12:00 New York time) are allowed to trigger entries.
FVGs are only eligible if they were created on the same trading day as the signal and after a specific time cutoff (e.g. 08:30 ET).
Tap-aware, breakout-based entries
The indicator looks for:
An FVG that has been tapped at least once since the last signal (if tap is required).
A decisive breakout of the previous bar’s high or low coming off that FVG.
Multi-strategy overlay (for advanced use)
On top of the core engine, FVG Sniper offers several optional “Sniper profiles” (strategies) tuned around:
Session timing (e.g. morning / midday windows)
Volatility regimes
Lane cleanliness / opposite-side structure behavior
Range context (distance from session extremes)
You can toggle these profiles on/off to restrict signals to specific conditions — but the exact internal filters and thresholds are not disclosed.
If at least one profile is enabled, a signal prints when any enabled profile likes the setup.
If no profiles are enabled, FVG Sniper shows the raw base FVG breakout signals from the core engine.
🧠 How to Use It
Primary use case: intraday futures (NQ/MNQ) on 1M timeframe.
FVG Sniper works best as:
A signal engine feeding your execution plans, or
A confirmation layer on top of your own context (HTF bias, news, higher-timeframe levels, etc.).
🎨 Visuals & Controls
Bullish and bearish FVG zones are drawn directly on the chart.
Optional mid-lines through each FVG.
Automatic delete or “fade” behavior when FVGs are invalidated.
Clear long/short markers at the signal bar.
Optional debug label to inspect which FVG produced the signal and key reference times.
⚠️ Disclaimer
This script is for educational and research purposes only and is not financial advice.
Past performance does not guarantee future results. Always validate any signal logic in a simulator and adapt it to your own risk management, instrument, and timeframe.

Liquidity Sweep This indicator is a precision ICT Liquidity Sweep Detector. It:
✔ Finds real swing highs and lows
✔ Detects true stop runs
✔ Verifies strong wick rejection
✔ Confirms reversals
✔ Filters out weak/noisy wicks
✔ Avoids repeated/clustered sweeps
✔ Shows only the best most recent sweep
✔ Displays arrow + label + line cleanly

Fibonacci Cluster Zones + OB + FVG (AR34)Detailed Description – Fibonacci Cluster Zones + OB + FVG (AR34)
This script is an advanced multi-layer confluence system developed under the AR34 Trading Framework, designed to identify high-accuracy reversal zones, liquidity imbalances, institutional footprints, and trend direction using a unified analytic engine.
It combines Fibonacci mathematics, Smart Money Concepts, market structure, and smart trend signals to produce precise, reliable trading zones.
⸻
🔶 1 — Fibonacci Retracement Zones + Custom Smart Levels
The script calculates the highest and lowest prices over a selected lookback period to generate key Fibonacci retracement levels:
• 0.236
• 0.382
• 0.500
• 0.618
• 0.786
• 1.000
You can also add up to three custom Fibonacci levels (0.66, 0.707, 0.88 or any value you want).
✔ Each level is drawn as a horizontal line
✔ Optional label display for every level
✔ Color and activation fully customizable
These levels help identify pullback zones and potential turning points.
⸻
🔶 2 — True Fibonacci Cluster Detection
The script automatically identifies Cluster Zones, which occur when:
1. A Fibonacci level
2. An Order Block
3. A Fair Value Gap
all overlap in the same price range.
When all three conditions align, the script prints a CLUSTER marker in yellow.
These zones represent:
• High-probability reversal areas
• Strong institutional footprints
• Highly reactive price levels
⸻
🔶 3 — Automatic Order Block (OB) Detection
The indicator detects Order Blocks based on structural candle behavior:
• Bearish candle → followed by bullish
• Price interacts with a Fibonacci level
• Area aligns with institutional order flow
When detected, the OB is marked for easy visualization.
⸻
🔶 4 — Fair Value Gap (FVG) Mapping
The script scans for liquidity imbalances using the classic FVG logic:
• low > high
When an FVG exists, it draws a green liquidity box.
This highlights:
• Gaps left by institutional moves
• High-value return zones
• Efficient price retracement levels
⸻
🔶 5 — Fibonacci Extension Projections
The script calculates extension targets using:
• 1.272
• 1.618
• 2.000
These are drawn as dashed teal lines and help forecast:
• Breakout continuation targets
• Wave extension objectives
• Take-profit areas
⸻
🔶 6 — Smart Trend Signal (EMA-200 Engine)
Trend direction is determined using the EMA 200:
• Price above EMA → uptrend
• Price below EMA → downtrend
A green or red signal icon appears only when the trend flips, reducing noise and improving clarity.
This helps detect:
• Trend shifts early
• Cleaner entries and exits
• Trend-based filtering
⸻
🔶 7 — Four-EMA Multi-Trend System
The indicator includes optional visualization of four moving averages:
• EMA 20 → Short-term
• EMA 50 → Medium-term
• EMA 100 → Long-term
• EMA 200 → Major trend
All are fully customizable (length + color + visibility).
⸻
🔶 8 — Dynamic Negative Fibonacci Levels (Green Only)
When enabled, the script calculates deep retracement zones using:
• –0.23
• –0.75
• –1.20
These negative Fibonacci levels are drawn in green and help identify:
• Deep liquidity capture points
• Hidden structural supports
• Potential reversal bottoms
⸻
🔶 9 — Complete User Control
Users maintain full control over:
✔ Enabling/disabling OB detection
✔ Enabling/disabling FVG detection
✔ Activating custom Fibonacci levels
✔ Showing or hiding labels
✔ Selecting timeframe for Fib calculations
✔ Adjusting moving average parameters
✔ Activating dynamic Fibonacci
The script is designed to be flexible, scalable, and suitable for any trading style.
⸻
🎯 Summary
This indicator is a powerful all-in-one analytical system that merges:
✔ Fibonacci Mathematics
✔ Smart Money Concepts (OB + FVG)
✔ Trend-based filtering
✔ Institutional cluster detection
✔ Dynamic extensions + retracements
✔ Multi-EMA trend mapping
It is ideal for:
• Professional traders
• SMC / ICT analysts
• Day traders and swing traders
• Anyone using confluence-based strategies
The script provides high-precision reversal zones, trend confirmation, and institutional liquidity mapping — all within a clean and smart visual layout.

ICS🏛️ Institutional Confluence Suite (ICS) Indicator
The Institutional Confluence Suite is a powerful and highly customizable TradingView indicator built to help traders identify key institutional trading concepts across multiple timeframes. It visualizes essential market components like Market Structures (MS), Order Blocks (OB)/Breaker Blocks (BB), Liquidity Zones, and Volume Profile, providing a confluence of institutional price action data.
📈 Key Features & Components
1. Market Structures (MS)
Purpose: Automatically identifies and labels shifts in market trends (Market Structure Shift, MSS) and continuations (Break of Structure, BOS).
Timeframe Detection: You can select detection across Short Term, Intermediate Term, or Long Term swings to match your trading horizon.
Visualization: Plots colored lines (Bullish: Teal, Bearish: Red) to mark the structures and optional text labels (BOS/MSS) for clear identification.
2. Order & Breaker Blocks (OB/BB)
Purpose: Detects and projects potential Supply and Demand zones based on recent price action that led to a swing high or low.
Block Types: Distinguishes between standard Order Blocks and Breaker Blocks (OBs that fail to hold and are traded through, often serving as support/resistance in the opposite direction).
Customization:
Detection Term: Adjusts sensitivity (Short, Intermediate, Long Term).
Display Limit: Sets the maximum number of recent Bullish and Bearish blocks to display.
Price Reference: Option to use the Candle Body (Open/Close) or Candle Wicks (High/Low) to define the block boundaries.
Visualization: Displays blocks as colored boxes (Bullish: Green, Bearish: Red) extending into the future, with a dotted line marking the 50% equilibrium level. Breaker Blocks are indicated by a change in color/line style upon being broken.
3. Buyside & Sellside Liquidity (BSL/SSL)
Purpose: Highlights areas where retail stops/limit orders are likely clustered, often represented by a series of relatively equal highs (Buyside Liquidity) or lows (Sellside Liquidity).
Detection Term: Adjustable sensitivity (Short, Intermediate, Long Term).
Margin: Uses a margin (derived from ATR) to group similar swing points into a single liquidity zone.
Visualization: Plots a line and text label marking the swing point, and a box indicating the clustered liquidity zone.
4. Liquidity Voids (LV) / Fair Value Gaps (FVG)
Purpose: Identifies areas where price moved sharply and inefficiency was created, often referred to as Fair Value Gaps or Imbalances. These are price ranges where minimal trading volume occurred.
Threshold: Uses a multiplier applied to the 200-period ATR to filter for significant gaps.
Mode: Can be set to Present (only show voids near the current price) or Historical (show all detected voids).
Visualization: Fills the price gap with colored boxes (Bullish/Bearish zones), often segmented to represent the price delivery across the gap.
5. Enhanced Liquidity Detection
Purpose: A complementary feature that uses volume and price action to highlight areas of high liquidity turnover, potentially indicating stronger Support and Resistance zones.
Calculation: Utilizes a volume-weighted approach to color-grade liquidity zones based on their significance.
Visualization: Plots shaded boxes (gradient-colored) around swing highs/lows, with text displaying the normalized volume strength.
6. Swing Highs/Lows
Purpose: Directly marks the price points identified as Swing Highs and Swing Lows based on the lookback periods.
Timeframe Detection: Can be enabled for Short Term, Intermediate Term, or Long Term swings.
Visualization: Plots a small colored dot/label (e.g., "⦁") at the swing point.
This indicator is an invaluable tool for traders employing ICT (Inner Circle Trader), Smart Money Concepts (SMC), or general price action strategies, as it automatically aggregates and displays these critical structural and liquidity elements.

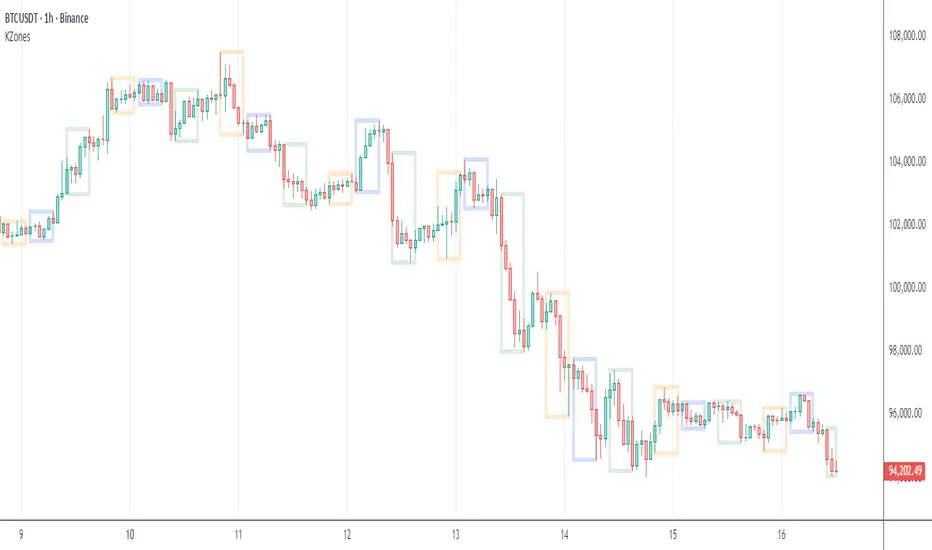
KZones Global Market Insight: Timezone moving marketsModern financial markets trade 24 hours a day, making it hard to track where the action is happening.
Do you wonder who is driving price action across Asia, Europe, and the Americas?
This indicator lets you visualize the trading activity of different geographic sessions.
For example, you can quickly see the recent move in Bitcoin was initiated by Americas selling down, represented by a large, downward-facing box. Asia and Europe followed through with more selling.
Start tracking the world's market movers today!
Note: This was inspired by ICT Killzones & Pivots
Weekly expansion (CRT) This indicator is designed to be used primarily on the daily chart,to aid in spotting weekly expansions, its a blend of CRT Theory and some ICT concepts.

Fair Value Gaps - Cucaracha📘 Fair Value Gaps (FVG) – Clean, Automatic Detection & Real-Time Tracking
The Fair Value Gaps (FVG) indicator automatically detects and visualizes Bullish and Bearish Fair Value Gaps directly on your chart. Built with precision, it highlights imbalance zones, continuously extends them in real time, and removes them the moment they’re mitigated — giving you a clean and accurate market structure view.
✅ Key Features
Automatic FVG Detection
Identifies bullish and bearish FVGs using a strict 3-candle imbalance model.
Dynamic Boxes
Each detected FVG is drawn as a shaded box and extends forward until price fills or mitigates the zone.
Auto-Cleanup (Mitigation Logic)
When price returns to the gap and fills it, the zone is instantly removed, keeping your chart clean and focused.
Custom Colors
Choose your own colors for bullish and bearish FVG boxes.
🎯 Why Traders Use This
Fair Value Gaps are widely used in:
Smart Money Concepts (SMC)
ICT-style trading
Market imbalance analysis
They highlight areas where price moved aggressively and may later return to rebalance.
This indicator helps you:
Spot institutional imbalances instantly
Track unmitigated FVGs without manually drawing boxes
Stay focused on key reaction zones
Improve entries based on premium/discount and liquidity concepts
🧠 How It Works
Bullish FVG:
Occurs when price leaves a gap where low > high , creating an upward imbalance zone.
Bearish FVG:
Occurs when high < low , indicating a downward imbalance zone.
Detected gaps are plotted as forward-extending boxes until price mitigates them.
Once mitigated (price fills the gap), the zone is automatically removed.
🟦🟥 Visuals
Blue (or your chosen color): Bullish FVG
Red (or your chosen color): Bearish FVG

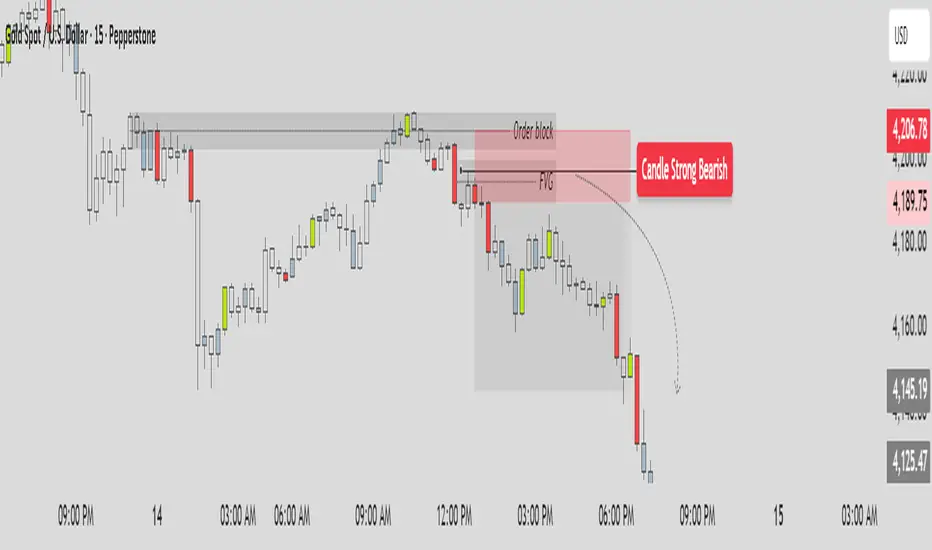
SHA CandleFlow ProSHA CandleFlow Pro v1.0.0 ✨🚀
SHA CandleFlow Pro is a next-generation price-action tool designed to detect high-probability candlestick rejection signals with extreme clarity and precision.
Built for traders who rely on reversal confirmation, wick rejection, momentum shifts, and candle behavior, this indicator helps you instantly visualize where price is likely to reverse, react, or continue with reduced strength.
Whether you trade scalping, intraday, swing, or ICT/SMC concepts, SHA CandleFlow Pro enhances your entries and timing with accurate rejection detection
Core Features ⚙️🔰
- Strong Bullish -> Green color
- Strong Bearish -> Red color
- Medium Bullish/Bearish -> Blue gray color
- Normal Bullish/Bearish -> N/A color
1. Strong Bullish Rejection — Green
Identifies powerful bullish rejection candles with strong wick dominance and momentum absorption.
Green highlights show areas where buyers aggressively step in, signaling high-probability bullish reactions or reversals.
2. Strong Bearish Rejection — Red
Detects strong bearish rejection candles with clear selling pressure.
Red highlights mark zones where sellers strongly reject price, indicating potential downside continuation or reversal points.
3. Medium Bullish / Bearish Rejection — Blue-Gray
For moderate rejection strength, the indicator displays blue-gray highlights.
These candles show noticeable but not extreme rejection, often signaling:
Early reversal signs
Weakening trend
Reaction zones
Potential continuation entries
They act as secondary confirmation.
4. Normal Candles — No Color
If a candle shows no meaningful rejection, no highlight is applied.
This keeps the chart clean and ensures you only focus on:
High-quality rejection
Clear price reaction levels
Relevant market behavior
Normal candles are intentionally ignored to avoid noise and over-signal conditions.
How to Use SHA CandleFlow Pro📘
SHA CandleFlow Pro is designed to help you confirm market reversals, rejections, and price reactions with high precision.
The best way to use it effectively is combine with your strategy to trade.
This is sample how to use it :
⚠️ Disclaimer
The information and tools provided in this script are for educational and informational purposes only.
Trading in the financial markets involves risk of loss and is not suitable for every investor. You are solely responsible for your trading decisions. Always do your own research, use proper risk management, and consult a licensed financial advisor before making any financial decisions.
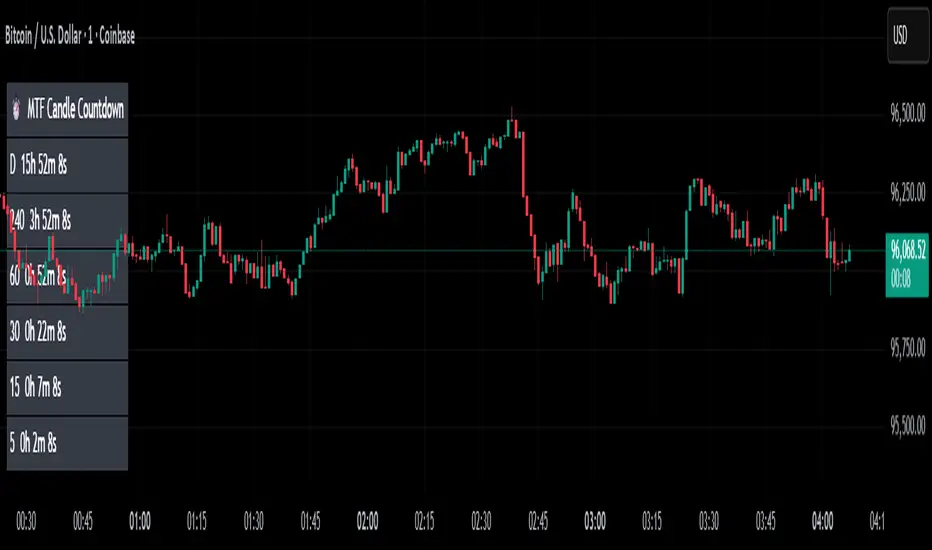
MTF Candle Countdown — HUD V1 (By Price-Action-Art)
MTF Candle Countdown — HUD V1 (By Price-Action-Art)
A clean, lightweight HUD that shows you exactly how much time is left in multiple higher-timeframe candles — all in one place.
This tool is designed for traders who rely on multi-timeframe precision.
Instead of constantly switching charts or checking timers, the HUD gives you a real-time countdown for up to six timeframes (Daily, 4H, 1H, 30m, 15m, 5m by default).
You can fully customize the timeframes, text size, and HUD position on your chart.
Perfect for:
Intraday and scalping timing
Swing traders waiting for HTF candle closes
ICT / SMC structure-based traders
Anyone who needs exact candle close timing without distractions
Features:
Real-time multi-timeframe candle countdown
Fully adjustable HUD placement (all corners)
Customizable timeframes and text size
Clean, minimal, and non-intrusive design
Updates only on the last bar for performance efficiency
Optional border for a sharper HUD look
Whether you’re waiting for a Daily close to confirm structure or timing your entries around 5m/15m candles, this HUD keeps everything visible and precise at a glance.
If you find this tool helpful, feel free to like, comment, and follow — it motivates me to keep releasing more tools for the community.
Dynamic Liquidity Levels [CDC Trading LABN] (ENGLISH)Script Description :
Take your market structure and liquidity analysis to the next level with Dynamic Liquidity Levels, a professional-grade tool designed to visualize the key levels that truly move the price. This indicator doesn't just plot static lines; it offers a dynamic framework that reacts to price action in real-time, keeping your chart clean and focused on what matters.
Designed for scalpers and swing traders alike, this indicator is your map for navigating market liquidity.
Key Features
• Smart Dynamic Lines: The standout feature of this indicator. Lines automatically stop extending once price has "invalidated" them. You decide whether the break occurs on a simple wick touch (to capture liquidity grabs) or a full candle close beyond the level (for a stronger confirmation).
• Comprehensive Liquidity Levels: Automatically draws the most important liquidity pools that professional traders watch every day:
• HTF Levels: Previous Day, Week, and Month Highs & Lows (PDH/L, PWH/L, PMH/L).
• Session Levels: Asian, London, and New York Session Highs & Lows (ASH/L, LSH/L, NYH/L).
• Full Label Control: Forget about overlapping labels. Adjust the position of each label individually (Left, Right, Center, Upper, Lower) for perfect visual clarity in any market condition.
• Instant, Configurable Alerts: Never miss an opportunity. Set up alerts that trigger the moment a level of your choice is broken, helping you execute your trades with precision.
• Clean & Professional Visualization: Fully customizable. Adjust colors, line width, and decide whether to display exact prices in the labels for an analysis setup tailored to your style.
Who is This Indicator For?
This tool is essential for a wide range of trading methodologies:
• Smart Money Concepts (SMC) & ICT Traders: Perfect for identifying liquidity pools and draw on liquidity levels. Use it to frame your order blocks and points of interest.
• Candle Range Theory (CRT) Traders: This indicator automates the core of your analysis. It identifies and projects the key candle ranges from higher timeframes (Daily, Weekly, Monthly) and trading sessions. Use these levels to anticipate price expansion and identify liquidity targets above and below established ranges, without manual markup every day.
• Price Action Traders: Clearly and automatically visualize the most relevant support and resistance levels based on high-timeframe market structure.
• Day Traders & Scalpers: Make quick decisions based on previous day's levels and session highs/lows, which act as magnets for intraday price.
• Swing Traders: Use the weekly and monthly levels to get a macro view of the structure and plan longer-term trades.
How to Use
1. Add the indicator to your chart.
2. Explore the settings panel to enable the levels and alerts that fit your trading plan.
3. Adjust the label positions for maximum clarity.
4. To receive alerts, right-click on the chart, create a new alert, select the indicator from the dropdown, and choose the "Any alert() function call" option.
We hope this tool greatly helps you improve your market analysis.
Happy trading!
CDC Trading LABN

Dynamic Liquidity Levels [CDC Trading LABN] (ESPAÑOL)Script Description :
Take your market structure and liquidity analysis to the next level with Dynamic Liquidity Levels , a professional-grade tool designed to visualize the key levels that truly move the price. This indicator doesn't just plot static lines; it offers a dynamic framework that reacts to price action in real-time, keeping your chart clean and focused on what matters.
Designed for scalpers and swing traders alike, this indicator is your map for navigating market liquidity.
Key Features
• Smart Dynamic Lines: The standout feature of this indicator. Lines automatically stop extending once price has "invalidated" them. You decide whether the break occurs on a simple wick touch (to capture liquidity grabs) or a full candle close beyond the level (for a stronger confirmation).
• Comprehensive Liquidity Levels: Automatically draws the most important liquidity pools that professional traders watch every day:
• HTF Levels: Previous Day, Week, and Month Highs & Lows (PDH/L, PWH/L, PMH/L).
• Session Levels: Asian, London, and New York Session Highs & Lows (ASH/L, LSH/L, NYH/L).
• Full Label Control: Forget about overlapping labels. Adjust the position of each label individually (Left, Right, Center, Upper, Lower) for perfect visual clarity in any market condition.
• Instant, Configurable Alerts: Never miss an opportunity. Set up alerts that trigger the moment a level of your choice is broken, helping you execute your trades with precision.
• Clean & Professional Visualization: Fully customizable. Adjust colors, line width, and decide whether to display exact prices in the labels for an analysis setup tailored to your style.
Who is This Indicator For?
This tool is essential for a wide range of trading methodologies:
• Smart Money Concepts (SMC) & ICT Traders: Perfect for identifying liquidity pools and draw on liquidity levels. Use it to frame your order blocks and points of interest.
• Candle Range Theory (CRT) Traders: This indicator automates the core of your analysis. It identifies and projects the key candle ranges from higher timeframes (Daily, Weekly, Monthly) and trading sessions. Use these levels to anticipate price expansion and identify liquidity targets above and below established ranges, without manual markup every day.
• Price Action Traders: Clearly and automatically visualize the most relevant support and resistance levels based on high-timeframe market structure.
• Day Traders & Scalpers: Make quick decisions based on previous day's levels and session highs/lows, which act as magnets for intraday price.
• Swing Traders: Use the weekly and monthly levels to get a macro view of the structure and plan longer-term trades.
How to Use
1. Add the indicator to your chart.
2. Explore the settings panel to enable the levels and alerts that fit your trading plan.
3. Adjust the label positions for maximum clarity.
4. To receive alerts, right-click on the chart, create a new alert, select the indicator from the dropdown, and choose the "Any alert() function call" option.
We hope this tool greatly helps you improve your market analysis.
Happy trading!
CDC Trading LABN

Liquidity Sweeps 2.0 – MGTrading Professional Liquidity Sweep Engine with Volume, MACD, Trend, SMT Divergence & Rolling VWAP
Liquidity Sweeps 2.0 is a **complete precision-based liquidity detection framework** built for traders who follow smart money concepts, sweep-based entries, and algorithmic price behavior.
This tool detects **high-probability buy/sell sweeps**, confirms them with market structure, Volume, MACD engine, Trend filtering, SMT divergence, and overlays a Rolling VWAP to track accumulation & distribution behavior.
It is designed for futures, indices, forex, crypto, and options traders.
-
🔥 **MAIN FEATURES**
✅ **1. True Liquidity Sweep Detection**
Automatically detects when price:
* Sweeps a prior high (Sell Sweep)
* Sweeps a prior low (Buy Sweep)
* Rejects and closes back inside the previous range
This helps identify real **stop hunts**, **liquidity grabs**, and **reversal moments**.
---
✅ **2. Volume Spike Confirmation (Smart Filter) **
Sweeps are only confirmed when volume exceeds the dynamic SMA threshold.
This filters out weak sweeps and keeps only **high-quality liquidity grabs**.
✅ **3. MACD Engine Confirmation**
Advanced MACD rules confirm sweeps by:
* MACD direction
* MACD signal agreement
* MACD histogram alignment
This dramatically increases accuracy and removes fake sweeps that occur in weak trends.
Optional **MACD Divergence Detection** reveals trend exhaustion before major reversals.
✅ **4. EMA Trend Filter (9/21) **
Avoid fighting the trend with the optional trend filter:
* Only buy sweeps in uptrend
* Only sell sweeps in downtrend
Great for scalpers and day traders who want trend alignment.
✅ **5. SMT Divergence (Relative Strength vs Reference Symbol) **
Enable SMT to detect when:
* Your chart sweeps a high/low
* But the reference symbol DOES NOT
This creates **displacement**, a powerful reversal signal used by institutional traders.
The symbol is selectable (ES, NQ, SPY, QQQ, BTC.D, DXY, etc.).
✅ **6. Rolling VWAP (RVWAP)**
A more dynamic version of VWAP using:
* Time-based rolling windows
* Volume-weighted price
* Automatic or adjustable window size
* Color change based on slope
Excellent for tracking **accumulation**, **distribution**, and **algorithmic trend bias**.
✅ **7. Clean Mode**
Only show “confirmed” sweeps with a ✓
Ideal for traders who want a simple and clean chart.
# 📊 **LABELS & COLOR CODING**
* 🟥 **Sweep Sell**
* 🟩 **Sweep Buy**
* 🟧 **MACD Bearish Divergence**
* 🟩 **MACD Bullish Divergence**
* 🟦/🟧 **RVWAP Up/Down Trend**
* “✓” means the sweep passed all confirmations.
# 🎯 **WHO IS THIS FOR?**
✔ Futures Traders (ES, NQ, YM, RTY, CL, GC)
✔ Options Traders (SPX, SPY, QQQ)
✔ Forex Traders
✔ Crypto Traders
✔ Smart Money / ICT Style Traders
✔ Liquidity Sweep Traders
✔ Scalpers, Day Traders, Swing Traders
If you trade **liquidity**, **sweeps**, **SMT**, **divergence**, or **VWAP-based behavior**, this indicator is designed for you.
# 🧠 **HOW TO USE IT**
1. Wait for a sweep label to appear at a liquidity pool.
2. Confirm with volume + MACD + trend (if enabled).
3. Watch RVWAP for bias (accumulation vs distribution).
4. Enter on the imbalance/FVG, retrace, or structure break.
5. Use SMT divergence as a premium confirmation.
This tool does NOT repaint after the bar closes.
Signals only appear when conditions are confirmed.
# 📦 **SETTINGS OVERVIEW**
* Lookback window for sweeps: (7 - 13)
* Volume spike threshold
* MACD lengths & filters
* Trend filter (EMA 9/21)
* SMT reference symbol
* RVWAP window + colors
RVWAP Line Width: (2) & Minimum Window Bars: (5)
* Label placement & visual adjustments
* Clean mode
Everything is fully customizable.
⚠️ **DISCLAIMER**
This indicator is for educational purposes only.
It does not guarantee profits.
Always backtest, practice proper risk management, and trade responsibly.
❤️ **If this helped you, leave a like & comment! **
Your support motivates further updates, improvements, and new tools.

Gold 1&5 Min Trading Strategy [TradingFinder] XAU Scalper Signal🔵 Introduction
Scalping in financial markets is based on immediate price reactions and precise analysis of price action behavior. In this trading approach, the trader must identify signals that originate directly from market structure, momentum shifts, candlestick formations, and the position of price relative to key zones.
Supply and demand areas serve as the primary regions of order concentration and form the foundation of scalping analysis, since they provide the most accurate representation of balance or imbalance between buyers and sellers as well as the active flow of liquidity in the market.
In demand zones, price reactions usually begin with the formation of reversal or continuation candlestick patterns. These patterns include structures such as Pin Bar, Engulfing, Doji, Failure, Rejection, and other forms of false breakout behavior, each of which can indicate a potential short term change in direction.
Liquidity plays a central role in these reactions, because price entering a demand zone typically coincides with the absorption of sell side liquidity and the restoration of order flow. This process often leads to rapid movements that are suitable for scalping. Therefore, combining candlestick confirmation with the location of price inside a supply or demand zone is one of the most reliable methods of identifying low risk scalping signals.
Demand zones include several structural variations, each representing a different form of liquidity behavior. One of the most well known examples is the order block, which is the final bearish candle before a strong bullish movement and indicates the presence of unfilled buy side interest.
Another important structure is the Fair Value Gap, which appears when a price void forms across three consecutive candles due to a lack of liquidity during the moment of displacement. The market often returns to this area to restore balance. Imbalance structures also represent one sided pressure in order flow where the market reacts later to correct these inefficiencies.
Breaker structure is another key element in demand analysis. A breaker is formed when an order block is violated and price returns to the same level after collecting liquidity, then continues in the opposite direction. This pattern often appears near liquidity based highs or lows and reflects a shift in the strength of market participants.
Together, order blocks, Fair Value Gaps, imbalances, and breakers form the core of demand analysis in price action and are widely used in precise scalping strategies due to their strong connection with liquidity and the high predictability of price reactions within them.
Bullish Setup :
Bearish Setup :
🔵 How to Use
This strategy is built on price action analysis, market reactions inside supply and demand zones, and confirmation through candlestick patterns. The first step is to identify key areas such as order blocks, Fair Value Gaps, imbalances, or breakers.
After these zones are located, price behavior within them is examined using candlestick structure and momentum direction. Entries are taken only when price reaches a validated zone, a clear sign of liquidity absorption or injection appears, and a confirming candlestick forms inside the zone.
This approach allows the trader to capture fast and precise entries during moments when the market is actively reacting to decision points.
🟣 Long Setup
In the buy setup, a valid demand zone must first be identified. This can be a bullish order block, an unfilled bullish Fair Value Gap, an imbalance at the lower part of structure, or a bullish breaker. When price enters this zone and shows signs of absorbing sell side liquidity, candlestick behavior must be examined.
Formation of reversal signals such as a Pin Bar with a long lower wick, bullish Engulfing, Rejection Candle, or a false breakout of the low, indicates a favorable shift in order flow. After receiving candlestick confirmation, a buy entry is taken within the same zone and the stop level is placed below the liquidity boundary. Targets are typically based on filling gaps, reaching supply zones, or returning to structural means.
🟣 Short Setup
In the sell setup, a valid supply zone must be recognized. This may include a bearish order block, a bearish Fair Value Gap, an imbalance at the upper part of structure, or a bearish breaker. When price enters this zone and liquidity accumulates above nearby highs, the probability of a fast momentum shift increases.
Confirmation occurs when a bearish reversal pattern forms such as Engulfing, Pin Bar with a long upper wick, indecisive Doji followed by rejection, or a false breakout of the high. After confirmation, the sell entry is placed and the stop level is set above the liquidity zone. Targets are selected based on filling lower Fair Value Gaps, reaching demand zones, or returning to structural midpoints.
🔵 Settings
Last Candle in Signal Direction : When On, a signal is issued only if the last candle moves in the direction required by the signal.
Signal in Nearly Zone : When enabled, the signal becomes valid even if the candle is near the zone rather than strictly inside it. When disabled, only signals formed inside the zone are allowed.
Allow Both Side Signals : When On, signals from both sides of the structure can be issued even if a limiting level exists. When disabled, only signals that do not violate the limiting level are allowed.
🔵 Conclusion
Using price action, supply and demand zones, and candlestick confirmation alongside liquidity analysis creates an effective framework for identifying fast market reactions in scalping conditions. Focusing on structures such as order blocks, Fair Value Gaps, imbalances, and breakers allows the trader to recognize shifts in momentum and changes in order flow with greater precision.
In this approach, entries are taken only when price reaches a validated zone, liquidity behavior is observable, and the confirming candle forms at the correct location. This leads to organized, low risk scalping signals that are aligned with the real time behavior of the market.

period separator highs lowsTaken from ICT Killzones & Pivots indicator I customise the previous day, week, month levels and separators

Fair Value Gap Pro by Bifrost InstituteFair Value Gap Pro brings institutional-style FVGs to TradingView with the precision and controls traders actually need. It detects clean 3-candle gaps on any higher timeframe, projects them onto your active chart, and overlays precise buy/sell volume ratios so you can judge the quality of a gap at a glance. Everything is customizable—from colors and line styles to tag markers, and volume display—so the tool adapts to your workflow instead of the other way around.
🔭 Multi-Timeframe Engine
Higher Timeframe Detection: Choose any HTF (M5, H1, H4, D1, etc.) and view those gaps on any lower-TF chart
Smart Gap Detection: Strict 3-candle mode ensures only successive bars form gaps—automatically rejects weekend gaps and market closures
Configurable History: Scan back 1-500+ bars with intelligent processing
Extend Until Filled: Gaps dynamically extend forward until price fills them, or use fixed-width mode
Advanced Fill Logic: Fill Rules - Close only, wick only, or close/wick; Fill Depth: TouchAny (immediate edge touch) or TouchMid (requires 50% penetration)
TouchMid Margin: Fine-tune difficulty with -50% to +50% adjustment (e.g., -10% = easier fill at 40% depth)
Weekend Gap Protection: Prevents false fills from market gaps—only real price action counts
📊 HTF-Accurate Volumetrics
True HTF Volume: Uses higher timeframe bar data for accurate volume matching across all chart timeframes
Buy vs Sell Delta: Integrated volume analysis for every FVG shows institutional pressure
Display Formats: Decimal ratios, percentages, or raw values (with K/M/B suffixes)
Volume Modes: Bar Delta (fast & reliable, recommended), Tick Delta (optional, feed-dependent)
Clear "+" (buy) and "–" (sell) prefixes for instant reading
🎨 Fully Customizable Appearance
Color Control: Color pickers for Bullish/Bearish FVG fills & Filled state colors (different from active), Band lines, midlines, and text labels.
Formation and fill tag markers
Line Styling: Color & Width
🔔 Alerts
Toggle formation/fill alerts independently
🏷 Tags
Visual Tags: Show markers - Text / Icon per event type
Icon choices: Circle, Square, Diamond, Star, Up/Down Arrow
Independent colors for formation vs fill tags
Auto-remove "formed" tag when "filled" tag appears
Configurable size and positioning
🧩 Rendering & Fill Display
Triple-Band Display: Upper, mid, and lower boundary lines with configurable styles
Filled Rectangle: Semi-transparent fill between boundaries for clear visualization
Fill State Management: Hide filled gaps completely, or keep them visible with distinct "filled" colors.
"Use Filled Colours" option for easy state identification
Quality Filters: Minimum body size filter (in chart points) to exclude noise from low-volatility periods
⚙️ Quality-of-Life Features
Performance Optimized: Efficient HTF/LTF time mapping with binary search algorithms
Cross-Symbol Compatible: Robust handling across all symbols and data feeds
Sensible Defaults: Works beautifully out of the box—tweak only what you need
Minimal Chart Clutter: Designed to keep critical information visible without overwhelming your workspace
💡 Perfect For
Institutional gap traders who need precision and control
Multi-timeframe analysts requiring HTF context on LTF charts
Volume profile traders seeking buy/sell pressure confirmation
Traders who value clean, professional chart aesthetics
Anyone tired of indicators that force rigid workflows
Fair Value Gap Pro doesn't just show you gaps—it gives you the complete institutional picture with the flexibility to trade your way.

[turpsy]ICT HTF&KZ-Mt&ADR[Combined]This script is useful in helping with plotting higher timeframe candles, identifying the killzones, as well as plotting the ADR that helps to know how far a candle has moved relative to stated time.
This script is a combination of some free scripts out there.
Both free and open source scripts from @ fadizeidan & @ tradeforopp resulted in this. I did the combination of the scripts, debugging, applying it to suit my purpose.
Special thanks to them.
Not for sale.
