LIT - TimingIntroduction
This Script displays the Asia Session Range, the London Open Inducement Window, the NY Open Inducement Window, the Previous Week's high and low, the Previous Day's highs and lows, and the Day Open price in the cleanest way possible.
Description
The Indicator is based on UTC -7 timing but displays the Session Boxes automatically correct at your chart so you do not have to adjust any timings based on your Time Zone and don't have to do any calculations based on your UTC. It is already perfect.
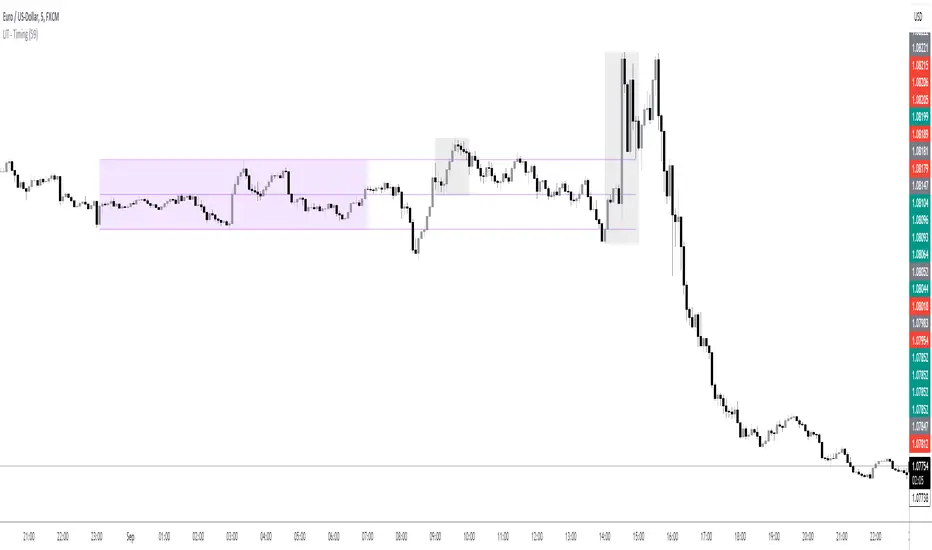
You will see on default settings the purple Asia Box and 2 grey boxes, the first one is for the London Open Inducement Window (1 hour) and the second grey box is for the NY Open Inducement Window (also 1 hour)
Asia Range comes with default settings with the Asia Range high, low, and midline, you can remove these 3 lines in the settings "style" and untick the "Lines" box, that way you only will have the boxes displayed.
Special Feature
Most Timing-based Indicators have "bugged" boxes or don't show clean boxes at all and don't adjust at daylight savings times, we made sure that everything automatically gets adjusted so you don't have to! So the timings will always display at the correct time regarding the daylight savings times.
Combining Timing with Liquidity Zones the right way and in a clear, clean, and simple format.
Different than others this script also shows the "true" Asia range as it respects the "day open gap" which affects the Asia range in other scripts and it also covers the full 8 hours of Asia Session.
Additions
You can add in the settings menu the last week's high and low, the previous day's high and low, and also the day's open price by ticking the boxes in the settings menu
All colors of the boxes are fully adjustable and customizable for your personal preferences. Same for the previous weeks and day highs and lows. Just go to "Style" and you can adjust the Line types or colors to your preferred choice.
Recommended Use
The most beautiful display is on the M5 Timeframe as you have a clear overview of all sessions without losing the intraday view. You can also use it on the M1 for more details or the M15 for the bigger picture. The Template can hide on higher time frames starting from the H1 to not flood your chart with boxes.
How to use the Asia Session Range Box
Use the Asia Range Box as your intraday Guide, keep in mind that a Breakout of Asia high or low induces Liquidity and a common price behavior is a reversal after the fake breakout of that range.
How to use the London Open and NY Open Inducement Windows
Both grey boxes highlight the Open of either London Open or NY Open and you should keep an eye out for potential Liquditiy Graps or Mitigations during that times as this is when they introduce major Liquidity for the regarding Session.
How to use the Asia high, low and midline and day open price
After Asia Range got taken out in one direction, often price comes back to those levels to mitigate or bounce off, so you can imagine those zones as support and resistance on some occasions, recommended in combination with Imbalances.
How to use the previous day and week's highs and lows
Once added in the settings, you can display those price levels, you can use them either as Liquidity Targets or as Inducement Levels once they are taken out.
Enjoy!
Pine Script® indicator