Session Profile [Elykia]Session Profile — The Market Architect
Session Profile is a "Standalone" market structure indicator designed to provide a crystal-clear view of the current day's volume distribution without cluttering your chart.
Unlike classic profiles, it integrates Order Flow logic (Bid vs Ask) and a visual Heatmap system to instantly identify buyer or seller aggressiveness at every price level.
🔄 Synergy & Ecosystem: The Order Flow "Trinity"
This indicator is not isolated. It is the missing piece connecting global structure to precise execution. Here is how to use it in complementarity with Heatmap.v4 and Footprint.Pro:
1. Session Profile (The Map):
Role: It gives you Context. It tells you "WHERE" to intervene.
Usage: Identify high volume zones (HVN) acting as magnets or supports, and volume voids (LVN) acting as rejection zones. It is your daily GPS.
2. Heatmap.v4 (The Depth):
Role: It shows you Passive Intent.
Usage: Once price hits a key level on the Session Profile, the Heatmap allows you to see if limit orders (liquidity walls) are present to defend that level.
3. Footprint.Pro (The Execution):
Role: It shows you Real-Time Aggression.
Usage: This is the trigger. Price is on a Profile level, the Heatmap shows a wall... The Footprint will confirm if buyers/sellers are absorbing that wall or getting rejected (Rotations, Deltas, Imbalances).
🧠 Trading Strategies
With Session Profile , you can apply institutional strategies:
Mean Reversion: If price strays too far from the POC (Point of Control - the yellow dots) or a colored high volume zone and shows signs of exhaustion, aim for a return to these equilibrium zones.
HVN Defense (High Volume Nodes): The longest bars of the profile represent prices accepted by the market. Look for bounces upon retesting these zones.
LVN Breakouts (Low Volume Nodes): Zones where the profile is very thin (low volume) are rapid transit zones. Price does not linger there: it cuts through or rejects violently.
⚡ The Power of Seconds Timeframes (TF)
This indicator uses a statistical approximation method based on candle closes to build the profile (making it ultra-lightweight and fast).
Why use it on a seconds chart?
Surgical Precision: On a 1-minute chart, the indicator harvests 1 price data point per minute. On a 1-second chart, it harvests 60 data points per minute.
Resolution: By dropping to lower TFs (1s, 5s, 10s), you drastically increase the definition of your profile. Volume "blocks" become much more precise and faithful to tick-by-tick reality.
⚠️ Note: Using seconds charts (e.g., 1s, 5s, 15s) requires a TradingView Premium subscription.
🛠️ Key Features
Dynamic Delta Heatmap: Bars color-code based on buying or selling intensity (adjustable via Threshold Ratio).
Top Volumes (Multiple POCs): Automatic highlighting of the top X volume levels of the day (Dots and colored text).
Smart Positioning: Anchored to the right of the screen with offset management to avoid obstructing current price action.
Smart Text: Displays Total Volume or Bid x Ask, neatly aligned inside the histogram.
Noise Filter: Option to hide insignificant volumes to keep only the essential structure.
⚠️ Disclaimer
Trading financial products (Futures, Crypto, Forex, Stocks) involves a high level of risk and may not be suitable for all investors. You may sustain losses exceeding your initial investment.
This indicator is a decision-support and technical analysis tool. It does not constitute investment advice, nor an inducement to buy or sell any financial asset. Past performance or simulations generated by this tool do not guarantee future results. Use this tool at your own risk and in accordance with your own risk management.
Search in scripts for "imbalance"

Smart Money Concepts Pro Smart Money Concepts Pro
A professional-grade framework for visualizing institutional price behavior through key Smart Money Concepts. It automatically maps structure shifts, imbalances, and liquidity events so traders can study how price develops around supply and demand.
Core Components
Market Structure (BOS / CHoCH) — Detects continuation and reversal breaks using pivot-based logic with a close-beyond threshold and configurable cooldown.
Order Blocks — Highlights institutional footprints validated by volume and distance filters; zones extend until mitigation.
Fair Value Gaps — Marks three-bar inefficiencies that meet a minimum gap size and optionally auto-remove once filled by a user-defined percentage.
Liquidity Sweeps — Identifies stop-hunt wicks exceeding a configurable extension beyond recent highs or lows.
Premium / Discount Zones — Defines equilibrium and price positioning within recent swing ranges.
Confluence Entries (optional) — Generates neutral BUY / SELL markers only when structure, zone, and directional context align.
Dashboard — Summarizes current structure bias, recent events, zone counts, and directional alignment in real time.
Why it’s distinct
All detections are governed by explicit thresholds—volume multipliers, minimum distances, and fill-percent logic—so each signal results from quantifiable structure rather than heuristic pattern matching. Automatic cleanup ensures charts remain clear as zones are mitigated or gaps filled.
Best use
Applicable across Forex, indices, crypto, and equities. Designed for study on 15 m – 1 D timeframes.
For optimal alignment, pin plots to the Right Scale after adding the script.
Disclaimer: This script is provided for educational and analytical purposes only. It does not constitute financial or investment advice.

Hidden Volume Profile[52Signal Recipe]─────────────────────────────────────
52SIGNAL RECIPE Hidden Volume Profile
◆ Overview
52SIGNAL RECIPE Smart Volume Profile is an advanced volume distribution indicator that visualizes buying and selling strength across different price levels. Unlike traditional volume profiles that only display total volume, this enhanced version separates buy volume and sell volume at each price level, revealing the hidden balance of market forces at specific prices.
Built on the same sophisticated calculation methodology as our Hidden Volume Detector, this indicator applies enhanced volume analysis to the Volume Profile framework. By displaying horizontal volume bars (green for buying, red for selling) at each price level in a separate panel, it provides clear insight into where market participants accumulated or distributed their positions.
Furthermore, when used alongside the Hidden Volume Detector that shows individual candle analysis, it enables traders to understand both micro-level (candle-by-candle) and macro-level (price-level) market dynamics comprehensively, supporting more effective trading strategies.
─────────────────────────────────────
◆ Key Features
Price-Level Volume Distribution: Displays horizontal volume bars at each price level, showing where the most trading activity occurred
Buy/Sell Volume Separation: Green bars represent buying volume (bullish pressure), red bars represent selling volume (bearish pressure) at each price level
POC (Point of Control) Identification: Automatically marks the price level with the highest total volume, acting as a strong support/resistance level
Enhanced Buy/Sell Calculation: Analyzes candle structure, position, and momentum to distinguish genuine buying pressure from selling pressure, using the same algorithm as Hidden Volume Detector
Customizable Display: Adjustable number of price levels (rows), analysis period (lookback bars), color customization, and POC line toggle
Magnet Effect Visualization: Shows how price gravitates toward high-volume areas, particularly the POC
─────────────────────────────────────
◆ Trading Application Points
Identify strong support zones where large green bars indicate buyer accumulation
Identify strong resistance zones where large red bars indicate seller distribution
Use POC as a key pivot point for support/resistance trading
Detect volume imbalances at specific price levels to find bullish or bearish zones
Combine with Hidden Volume Detector for complete analysis: individual candle timing (Hidden Volume) + price level zones (Volume Profile)
─────────────────────────────────────
◆ Synergy With Other Indicators
Use with Hidden Volume Detector for multi-dimensional volume analysis: candle-level detail + price-level overview
Combine with trend indicators (Moving Averages, MACD) to validate support/resistance levels in trending markets
Use with price action patterns to confirm breakout or reversal signals at key volume levels
─────────────────────────────────────
◆ Conclusion
52SIGNAL RECIPE Smart Volume Profile is a powerful and intuitive tool that reveals the distribution of buying and selling forces across price levels. By visualizing buy and sell volumes separately at each price level and identifying the POC, it allows traders to understand where market participants made their decisions and where key support/resistance levels exist.
Especially when used together with the Hidden Volume Detector, it provides a complete volume analysis system: Hidden Volume shows real-time buying/selling pressure in individual candles for precise entry/exit timing, while Smart Volume Profile shows accumulated buying/selling zones across price levels for strategic planning. This combination enables traders to interpret market dynamics from both micro and macro perspectives, ultimately supporting more informed and effective trading decisions.
─────────────────────────────────────
※ Disclaimer: This indicator is provided as a supplementary analysis tool and should not be used as the sole basis for trading decisions. Past data does not guarantee future results. Volume Profile is most effective in ranging markets and may be less reliable in strong trending conditions. Always apply proper risk management.
─────────────────────────────────────
─────────────────────────────────────
52SIGNAL RECIPE Hidden Volume Profile
◆ 개요
52SIGNAL RECIPE Smart Volume Profile은 가격대별 매수와 매도의 거래량 분포를 시각화하는 고급 볼륨 분석 지표입니다. 단순히 전체 거래량만 표시하는 기존 볼륨 프로파일과 달리, 각 가격대에서의 매수 볼륨과 매도 볼륨을 분리하여 보여줌으로써 특정 가격에서의 시장 세력 간 숨겨진 균형을 드러냅니다.
Hidden Volume Detector와 동일한 정교한 계산 방식을 기반으로, Volume Profile 프레임워크에 강화된 볼륨 분석을 적용했습니다. 각 가격대에 수평 거래량 막대(초록색 매수, 빨간색 매도)를 별도 패널에 표시하여, 시장 참여자들이 어느 가격에서 포지션을 축적하거나 분산했는지 명확하게 파악할 수 있도록 지원합니다.
또한, 개별 캔들 분석을 보여주는 Hidden Volume Detector와 함께 병행해 보면, 미시적 수준(캔들별)과 거시적 수준(가격대별) 시장 역학을 모두 종합적으로 이해할 수 있어, 훨씬 효과적인 매매 전략 수립이 가능합니다.
─────────────────────────────────────
◆ 주요 특징
가격대별 거래량 분포: 각 가격대에 수평 거래량 막대를 표시하여 가장 많은 거래가 일어난 곳을 시각화
매수·매도 볼륨 구분: 각 가격대에서 초록색 막대는 매수 볼륨(상승 압력), 빨간색 막대는 매도 볼륨(하락 압력) 표시
POC (Point of Control) 식별: 가장 많은 거래량이 발생한 가격대를 자동으로 표시하며, 강력한 지지/저항선 역할 수행
향상된 매수·매도 계산: 캔들의 구조, 위치, 모멘텀을 분석하여 진정한 매수 압력과 매도 압력을 구분하며, Hidden Volume Detector와 동일한 알고리즘 사용
커스터마이징 가능한 디스플레이: 가격 레벨 수(행), 분석 기간(룩백 바), 색상 커스터마이징, POC 라인 토글 조정 가능
자석 효과 시각화: 가격이 고거래량 구간, 특히 POC로 회귀하려는 경향을 보여줌
─────────────────────────────────────
◆ 트레이딩 활용 포인트
큰 초록 막대가 있는 곳을 강한 지지 구간으로 활용(매수 세력 축적)
큰 빨간 막대가 있는 곳을 강한 저항 구간으로 활용(매도 세력 분산)
POC를 핵심 피봇 포인트로 활용하여 지지/저항 매매 전략 수립
특정 가격대의 거래량 불균형을 감지하여 강세 또는 약세 구간 파악
Hidden Volume Detector와 결합하여 완전한 분석: 개별 캔들 타이밍(Hidden Volume) + 가격대 구간(Volume Profile)
─────────────────────────────────────
◆ 다른 지표와 조합 가능성
Hidden Volume Detector와 함께 사용하여 다차원적 볼륨 분석: 캔들 레벨 디테일 + 가격 레벨 전체 조망
추세 지표(이동평균선, MACD)와 결합하여 추세장에서 지지/저항 레벨 검증
가격 패턴과 함께 활용하여 주요 거래량 레벨에서의 돌파 또는 반전 신호 확인
─────────────────────────────────────
◆ 결론
52SIGNAL RECIPE Smart Volume Profile은 가격대별 매수와 매도 세력의 분포를 드러내는 강력하고 직관적인 지표입니다. 각 가격대에서 매수 볼륨과 매도 볼륨을 분리하여 시각화하고 POC를 식별함으로써, 시장 참여자들이 어디서 의사결정을 내렸는지, 어디에 주요 지지/저항 레벨이 존재하는지 이해할 수 있도록 돕습니다.
특히 Hidden Volume Detector와 함께 사용하면 완전한 볼륨 분석 시스템을 구축할 수 있습니다. Hidden Volume은 개별 캔들에서의 실시간 매수/매도 압력을 보여줘 정확한 진입/청산 타이밍을 제공하고, Smart Volume Profile은 가격대별 누적된 매수/매도 구간을 보여줘 전략적 계획 수립을 지원합니다. 이러한 조합은 트레이더들이 미시적·거시적 관점 모두에서 시장 역학을 해석할 수 있게 하여, 궁극적으로 더 정보에 기반한 효과적인 매매 의사결정을 가능하게 합니다.
─────────────────────────────────────
※ 면책 조항: 본 지표는 투자 판단을 위한 보조 도구로 제공되며, 단독 의존해서는 안 됩니다. 과거 데이터에 기반한 분석이므로 미래 결과를 보장하지 않습니다. Volume Profile은 횡보장에서 가장 효과적이며 강한 추세 상황에서는 신뢰도가 낮을 수 있습니다. 적절한 리스크 관리와 함께 사용하시기 바랍니다.

CS Institutional X-Ray (Perfect Sync)Title: CS Institutional X-Ray
Description:
CS Institutional X-Ray is an advanced Order Flow and Market Structure suite designed to reveal what happens inside Japanese candles.
Most traders only see open and close prices. This indicator utilizes VSA (Volume Spread Analysis) algorithms and Synthetic Footprint Logic to detect institutional intervention, liquidity manipulation, and market exhaustion.
🧠 1. The Mathematical Engine: Synthetic Footprint
The core of this indicator is not based on moving average crossovers, but on market physics: Effort vs. Result.
The script scans every candle and calculates:
Buy/Sell Pressure: Analyzes the close position relative to the total candle range and weights it by volume.
Synthetic Delta: Calculates the net difference between buyer and seller aggression.
Volume Anomalies: Detects when volume is abnormally high (Institutional) or low (Retail).
The Absorption Logic: The indicator hunts for divergences between candle color and internal flow.
Example: If price drops hard (Red Candle) with massive volume, but the close moves away from the low, the algorithm detects that massive LIMIT orders absorbed the selling pressure. Result: Institutional Buy Signal.
📊 2. The Institutional Semaphore (Visual Guide)
The indicator automatically recolors candles to show the real state of the auction:
🔵 CYAN (Whale Buy): Bullish Absorption. Institutions buying aggressively or absorbing selling pressure at support.
🟣 MAGENTA (Whale Sell): Bearish Absorption. Institutions selling into strength or stopping a rally with sell walls.
⚪ GREY (Exhaustion/Zombie): "No-Trade" Zone. Volume is extremely low. The movement lacks institutional backing and is prone to failure.
🟢/🔴 Normal: Market in equilibrium.
🛡️ 3. Smart Zone System (Market Memory)
The indicator draws and manages Support and Resistance levels based on volume events, not just pivots.
Virgin Zones (Bright): When a "Whale" appears, a solid line is projected. If price has not touched it again, it is a high-probability bounce zone.
Automatic Mitigation: The exact moment price touches a line, the indicator detects the mitigation. The line turns Grey and Dotted, and the label dims. This keeps the chart clean, showing only what is relevant now.
☠️ 4. Manipulation Detector (Liquidity Grabs)
The system distinguishes between a normal reversal and a "Stop Hunt".
Signal: ☠️ GRAB
Logic: If price breaks a previous Low/High to sweep liquidity and closes with an absorption candle (Whale), it is marked as a "Grab." This is the system's most powerful reversal signal.
🧱 5. FVG with Liquidity Score
The indicator draws Fair Value Gaps (Imbalances) and assigns them a volume score.
"Vol: 3.0x": Indicates that the gap was created with 3 times the average volume, making it a much stronger price magnet than a standard FVG.
🚀 How to Trade with CS Institutional X-Ray
Identify the Footprint: Wait for a Cyan or Magenta candle to appear.
Validate the Trap: If the signal comes with a "☠️ GRAB" label, the probability of success increases drastically.
The Retest (Entry): Do not chase price. Place a Limit order on the generated Zone Line or at the edge of the FVG.
Management: Use opposite zones or mitigated zones (grey) as Take Profit targets.
Included Settings:
Fully configurable Alerts for Whales, Grabs, and Retests.
Total customization of colors and styles.

Volume with VSAThis script is designed to identify meaningful volume activity using the principles of Volume Spread Analysis (VSA). By focusing on the relationship between price movement and volume, it highlights areas where professional traders may be active. The tool becomes especially powerful when applied to higher timeframes such as 15-minute or 30-minute charts. On these larger intervals, market noise is reduced, allowing true supply and demand imbalances to stand out more clearly. As a result, the zones and signals generated by the script tend to be more reliable and consistent. The combination of structural analysis and volume behaviour helps traders pinpoint potential trend reversals, continuation patterns, and breakout strength with greater accuracy. Overall, this script enhances decision-making by offering a clearer view of genuine market participation, making it well-suited for swing traders, intraday strategists, and anyone looking to understand volume dynamics more effectively.

HD Trades📊 ICT Confluence Toolkit (FVG, OB, SMT)
This All-in-One indicator is designed for Smart Money Concepts (SMC) traders, providing visual confirmation and signaling for three critical Inner Circle Trader (ICT) tools directly on your chart: Fair Value Gaps (FVG), Order Blocks (OB), and Smart Money Technique (SMT) Divergence.
It eliminates the need to load multiple indicators, streamlining your analysis for high-probability setups.
🔑 Key Features
1. Fair Value Gaps (FVG)
Automatic Detection: Instantly highlights bullish (buy-side) and bearish (sell-side) imbalances using the standard three-candle pattern.
Real-Time Mitigation: Gaps are drawn until price trades into the FVG zone, at which point the indicator automatically "mitigates" and removes the box, ensuring your chart stays clean.
2. Order Blocks (OB)
Impulse-Based Logic: Identifies valid Order Blocks (the last opposing candle) confirmed by a strong, structure-breaking impulse move, quantified using an Average True Range (ATR) multiplier for dynamic sensitivity.
Mitigation Tracking: Bullish OBs are tracked until broken below the low, and Bearish OBs until broken above the high, distinguishing between active supply/demand zones.
3. SMT Divergence (Smart Money Technique)
Multi-Asset Comparison: Utilizes the Pine Script request.security() function to compare the swing structure of the current chart against a correlated asset (e.g., EURUSD vs. GBPUSD, or ES vs. NQ).
Signal Labels: Plots clear 🐂 SMT (Bullish) or 🐻 SMT (Bearish) labels directly on the chart when a divergence in market extremes is detected, signaling a potential reversal or continuation based on internal market weakness.
⚙️ Customization
All three components are toggleable and feature customizable colors and lookback periods, allowing you to fine-tune the indicator to your specific trading strategy and preferred timeframes.
Crucial Setup: For SMT Divergence to function, you must enter a correlated symbol (e.g., NQ1!, ES1!, or a related Forex pair) in the indicator settings.

MRC Supply & Demand Zones by rnd🚀 MRC Supply & Demand Zones: Professional Reversal & Liquidity Detection
MRC Supply & Demand Zones is a premium hybrid trading tool combining two of the most powerful concepts in technical analysis: Mean Reversion and Volume Profile.
This indicator doesn’t just show arrows — it provides deep market context by defining dynamic volatility channels and hidden supply & demand zones based on real volume data from lower timeframes.
🔥 Key Features
1. MRC (Mean Reversion Channel)
At the core lies the SuperSmoother MA (SSMA) — a next-generation moving average that eliminates market noise significantly more effectively than standard SMAs or EMAs, while maintaining minimal lag.
Logic: Price always tends to return to its mean. The indicator constructs dynamic channels (Inner and Outer) around the SSMA based on volatility (True Range).
Signals:
Long (Buy): Price extends beyond the lower outer boundary (oversold) and closes back above it.
Short (Sell): Price extends beyond the upper outer boundary (overbought) and closes back below it.
2. Supply & Demand Zones
This is not just drawing levels based on simple highs and lows. The indicator utilizes Lower Timeframe (LTF) Data to construct a detailed volume profile inside the candles.
How it works: The algorithm scans history, identifies volume imbalances, and highlights zones where major players have shown significant interest.
Visualization: Automatically draws red (Supply) and blue (Demand) rectangles that act as price magnets and strong support/resistance levels.
⚙️ Settings Guide
🔹 Block: MRC Settings (Channel Settings)
Control signal sensitivity and channel width here.
Min Range %:
What: Sets the minimum channel width as a percentage of the current price.
Why: Prevents the channel from squeezing into a "thin line" during flat markets, filtering out false signals during low volatility.
Outer Multiplier:
Default: 1.9
Role: Defines the boundaries for "extreme" overbought/oversold conditions. Higher values result in fewer, but more accurate entry signals.
Inner Multiplier:
Default: 1.0
Role: Defines the boundaries of "normal" price oscillation. Often used as the first target for taking profits (Take Profit).
SSMA Length:
Default: 200
Role: The period of the main trend line. 200 is ideal for defining the long-term trend and the global "center" of price.
Source:
Default: hlc3 (High+Low+Close / 3).
Role: The price data used for calculations.
🔹 Block: Supply & Demand Zones
Controls the liquidity search algorithm.
Supply & Demand Zones (On/Off): Toggle the display of the rectangular zones.
Threshold %: Defines how "significant" the volume must be. Adjusts the filtering of weak zones.
Supply/Demand Zones Color: Select the color and opacity for seller and buyer zones.
Profile Lookback Range:
Fixed Range: Analyzes a fixed number of recent bars.
Visible Range: Analyzes only the bars currently visible on the screen.
Lookback Length: The depth of history (number of bars) for volume analysis (works in Fixed Range mode).
Profile Number of Rows: Profile resolution. Higher numbers result in more detailed and narrower zones.
🔔 Alert System
You will never miss an entry. The indicator includes built-in conditions for creating alerts:
Long Signal: Triggers on a green triangle (upward reversal from the lower boundary).
Short Signal: Triggers on a red triangle (downward reversal from the upper boundary).
💡 Why use this indicator?
This is a ready-made "all-in-one" trading strategy. You get the trend (SSMA), volatility (MRC), and liquidity levels (S&D) in one compact script. It is perfect for scalping and day trading on any asset (Crypto, Forex, Stocks).

Orderbook Table1. Indicator Name
Orderbook Table
This is an order book style trading volume map
that upgraded the price from my first script to label
2. One-line Introduction
A visual heatmap-style orderbook simulator that displays volume and delta clustering across price levels.
3. Overall Description
Orderbook Table is a powerful visual tool designed to replicate an on-chart approximation of a traditional order book.
It scans historical candles within a specified lookback window and accumulates traded volume into price "bins" or levels.
Each level is color-coded based on total volume and directional bias (delta), offering a layered view of where market interest was concentrated.
The indicator approximates order flow by analyzing each candle's directional volume, separating bullish and bearish volume.
With adjustable parameters such as level depth, price bin density, delta sensitivity, and opacity, it provides a highly customizable visualization.
Displayed directly on the chart, each level shows the volume at that price zone, along with a price label, offset to the right of the current bar.
Traders can use this tool to detect high liquidity zones, support/resistance clusters, and volume imbalances that may precede future price movements.
4. Key Benefits (Title + Description)
✅ On-Chart Volume Heatmap
Shows volume distribution across price levels in real-time directly on the price chart, creating a live “orderbook” view.
✅ Delta-Based Bias Coloring
Color changes based on net buying/selling pressure (delta), making aggressive demand/supply zones easy to spot.
✅ High Customizability
Users can adjust lookback bars, price bins, opacity levels, and delta usage to fit any market condition or asset class.
✅ Lightweight Simulation
Approximates orderbook depth using candle data without needing L2 feed access—works on all assets and timeframes.
✅ Clear Visual Anchoring
Volume quantities and price levels are offset to the right for easy viewing without cluttering the active chart area.
✅ Fast Market Context Recognition
Quickly identify price levels where volume concentrated historically, improving decision-making for entries/exits.
5. Indicator User Guide
📌 Basic Concept
Orderbook Table analyzes a configurable number of past bars and distributes traded volume into price "bins."
Each bin shows how much volume occurred around that price level, optionally adjusted for bullish/bearish candle direction.
⚙️ Settings Overview
Lookback Bars: Number of candles to scan for volume history
Levels (Total): Number of price levels to display around the current price
Price Bins: Granularity of price segmentation for volume distribution
Shift Right: How far to offset labels to the right of the current bar
Max/Min Opacity: Controls visual strength of volume coloring
Use Candle Delta Approx.: If enabled, colors the volume based on candle direction (green for up, red for down)
📈 Example Timing
Look for green clusters (bullish bias) below current price → possible strong demand zones
Price enters a high-volume level with previously aggressive buyers (green), suggesting support
📉 Example Timing
Red clusters (bearish bias) above current price can act as resistance or supply zones
Price stalling at a red-heavy volume band may indicate exhaustion or reversal opportunity
🧪 Recommended Use
Use as a support/resistance mapping tool in ranging and trending markets
Pair with candlestick analysis or momentum indicators for refined entry/exit points
Combine with VWAP or volume profile for multi-dimensional volume insight
🔒 Cautions
This is an approximation, not a true L2 orderbook—volume is based on historical candles, not actual limit order data
In low-volume markets or higher timeframes, bin granularity may be too coarse—adjust "Price Bins" accordingly
Delta calculation is based on open-close direction and does not reflect true buy/sell volume splits
Avoid overinterpreting low-opacity (light color) zones—they may indicate low interest rather than true resistance/support
+++

[MTX] Weekly Support & Resistance Weekly Support & Resistance
Overview
Discover key market structure with this all-in-one indicator:
Weekly Support & Resistance (SR) levels , Fair Value Gap (FVG) detection , and Automatic Fibonacci retracements .
Designed for MTX traders, it plots non-repainting weekly highs/lows/opens/closes, highlights unmitigated FVGs for potential imbalances, and auto-draws Fib levels, Perfect for swing/day traders on XAUUSD.
🚀 Key Features
- Weekly SR Levels : Plots previous week's High (resistance), Low (support), Open, and Close. Optional historical levels (Week -2/-3).
- SR Zones : Customizable % zones around levels for dynamic support/resistance bands. Fill colors for easy visualization.
- FVG Detection : Identifies bullish (green) and bearish (red) Fair Value Gaps on your chart timeframe.
- buy/sell Signals :
- Trend Filter : Optional EMA/SMA to filter signals
- Auto Fibonacci : auto-retracement with 20+ levels (0%, 23.6%, 38.2%, 50%, 61.8%, 100%, extensions to 423.6%, negatives). Custom colors, labels, and background fills.
- Alerts: Built-in for FVG creation/mitigation + all buy/sell signals. Set up once for real-time notifications.
⚠️ Important Disclaimer
This indicator is for educational and analysis purposes only. It provides visual tools and signals based on historical price action— not financial advice. Past performance ≠ future results. Trading involves risk; use proper risk management. Backtest thoroughly. No guarantees of profitability. Consult a financial advisor.
#tradingview #smc #MTX #fvg #fibonacci #supportresistance

Nexural TransformNexural Transform: Fisher + CVD Order Flow Indicator
What This Indicator Does
Nexural Transform combines a Fisher Transform with Cumulative Volume Delta (CVD) analysis to help identify potential turning points and measure buying/selling pressure beneath price action. Instead of just showing you what price is doing, it attempts to show you what's happening in the order flow - who's in control and whether momentum is building or fading.
The indicator analyzes intrabar volume to separate buying from selling pressure, then integrates this with Fisher Transform momentum calculations to generate signals that consider both price extremes and volume conviction.
Key Features
Core Mechanics:
Fisher Transform with CVD momentum weighting
Intrabar volume analysis for true buying/selling pressure
Adaptive length based on market volatility
Volume-weighted price calculations
Dynamic sigma bands that adjust to current market conditions
Order Flow Detection (always active):
Absorption zones - large volume with minimal price movement
Iceberg orders - hidden liquidity reveals itself
Liquidity sweeps - stop hunts that fail to follow through
Failed auctions - breakouts without volume support
Exhaustion scoring - when moves run out of steam
Smart money tracking - large lot activity
Stacked imbalances - consecutive directional pressure
Additional Tools:
Instant divergence detection (real-time price vs. CVD mismatches)
Traditional divergence signals
Session-based filtering (RTH vs. overnight)
Confidence scoring for signals
Customizable statistics box with three detail levels
How to Use It
Understanding the Display:
The main line oscillates around zero with dynamic sigma bands (1 sigma, 2 sigma, 3 sigma)
Green zones = oversold conditions with buying pressure
Red zones = overbought conditions with selling pressure
The gray signal line shows the previous bar's value
Optional CVD overlay shows cumulative volume delta scaled to fit
Signal Types:
Elite Signals (confidence greater than 100%) - Rare, highest conviction setups
High Confidence Signals (confidence greater than 70%) - Strong probabilistic edge
Standard crossovers - Fisher crosses signal line at extremes
Divergences - Price makes new highs/lows but CVD disagrees
Best Practices:
Use on liquid instruments (ES, NQ, major stocks with good volume)
Works best on 5min-1hr timeframes for intraday trading
Pay attention during key session times (open, 10:30-11:00, close)
Watch the statistics box for exhaustion, streak counts, and order flow activity
Don't trade signals in isolation - confirm with price action and structure
Reduce position size or avoid trading during lunch session (12:00-13:30 EST)
Interpreting Order Flow:
"ABS" in stats = absorption happening (potential reversal zone)
"ICE" = iceberg orders detected (hidden liquidity)
"LIQ" = liquidity sweep (stop hunt - look for reversal)
"TRAP" = failed auction (breakout likely to fail)
High exhaustion scores (greater than 50) = move losing momentum
Honest Pros & Cons
What This Indicator Does Well:
Provides multi-dimensional view of market structure
Catches divergences between price and underlying order flow
Adapts to changing volatility conditions
Offers clear confidence levels - you know when signals are stronger
Works across multiple trading styles (scalping to swing)
Session awareness helps avoid low-probability times
Statistics box gives you real-time market context
Limitations to Understand:
Steep learning curve - order flow concepts take time to grasp
Not a holy grail - no indicator is; you still need proper risk management
Can be noisy in choppy/low volume conditions - like most oscillators
Requires liquid markets - won't work well on illiquid stocks or crypto with thin order books
Lagging component - Fisher Transform is smoothed, so it's not predictive
Works best with context - needs support/resistance, trend analysis, etc.
Information dense - the statistics box can overwhelm beginners
Who This Is For
Good fit if you:
Trade futures (especially ES/NQ) or high-volume stocks
Want to understand order flow beyond just price candles
Use multiple timeframe analysis
Are comfortable with technical concepts
Want confluence factors for your existing strategy
Trade during active market sessions
Probably not for you if:
You're brand new to trading (start simpler)
You trade low-volume instruments
You want a "buy here, sell there" magic system
You don't want to learn order flow concepts
You're looking for a fully automated strategy
Configuration Tips
The indicator comes pre-configured with tested defaults, but you can customize:
Fisher Length (10) - Lower = more sensitive, higher = smoother
CVD Weight (0.3) - How much volume influences the oscillator
Dynamic Bands - Keep ON for adaptive levels that adjust to volatility
Session Filters - Keep ON to reduce overnight noise
Stats Detail Level - Start with "Compact", move to "Order Flow" as you learn
Final Thoughts
This isn't a signal-spamming indicator that paints arrows all over your chart. It's a tool for understanding market structure through the lens of volume and momentum. The best trades happen when multiple factors align - Fisher at extremes, CVD confirming, order flow showing institutional activity, and price respecting key levels.
Treat it as one piece of your trading puzzle, not the whole picture. Use it to confirm what you're seeing in price action, not to replace proper chart reading and risk management.
Test it thoroughly on a demo account. Learn what the order flow signals mean. Understand when it works best and when to ignore it. No indicator works in all market conditions, and this one is no exception.
Questions? Found a bug? Have suggestions?
Drop a comment below. I actively maintain this indicator and appreciate genuine feedback from traders actually using it in the markets.
Remember: Past performance doesn't guarantee future results. Always use proper position sizing and risk management.

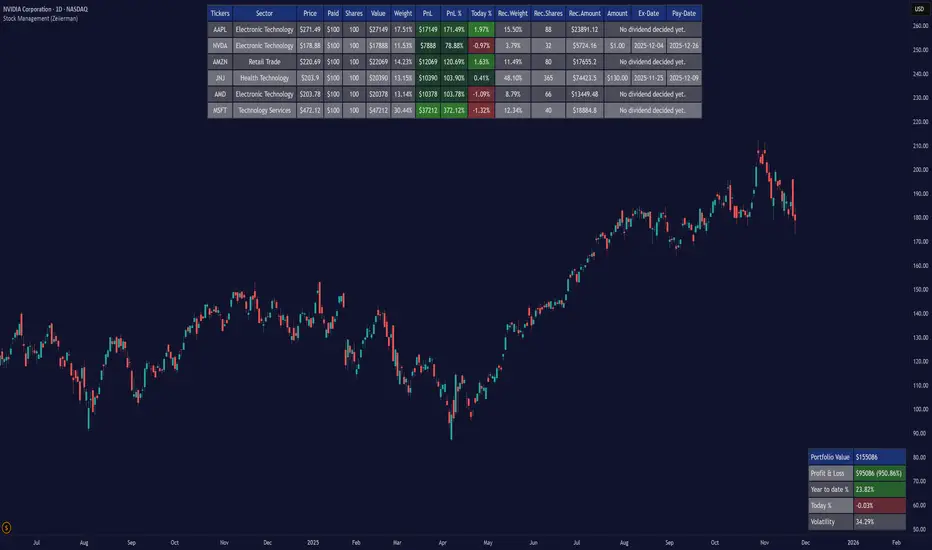
Stock Management (Zeiierman)█ Overview
Stock Management (Zeiierman) gives investors a complete, real-time view of their portfolio directly inside TradingView. It tracks performance, allocation, volatility, and dividends in one unified interface, making it easy to understand both how your portfolio is performing and how it behaves in terms of risk and exposure.
Rather than analyzing each chart in isolation, Stock Management (Zeiierman) turns TradingView into a lightweight portfolio cockpit. You can define up to 20 stock positions (ticker, shares, average cost), and the tool will:
Normalize all positions into a single user-selected currency
Calculate live position value, PnL, PnL%, and daily movement
Compute total portfolio value, performance, and volatility
Optionally generate a risk-parity style Recommended Allocation
Display upcoming dividend amounts, ex-dates, and pay-dates for your holdings
All of this appears as clean on-chart tables, including a main portfolio table, an optional dividend table, and an optional summary panel, allowing you to manage your portfolio while still watching price action. It is a visual portfolio layer built entirely around your own inputs, integrated seamlessly into the TradingView environment.
⚪ Why This One Is Unique
Most investors rely on basic broker dashboards that show position values but provide little insight into risk, exposure, or how each holding interacts with the rest of the portfolio. Stock Management (Zeiierman) goes far beyond that by building an intelligent, unified portfolio layer directly inside TradingView.
It automatically normalizes global holdings into a single reporting currency using live FX data, stabilizes allocation with a volatility-aware weighting engine, and structures your information through an adaptive column framework that highlights performance and risk in real time. A weighted summary blends portfolio movement, volatility, and long-horizon behavior into a clean snapshot, while dividend schedules and projected payouts are fully integrated into the same interface.
█ Main Features
⚪ 1. Portfolio Tracker
The core of Stock Management (Zeiierman) is a dynamic, real-time portfolio table that brings all key position data into one intelligent view. Each holding is displayed with:
Ticker
Sector
Price
Average Paid Price
Shares
Position Value
Position Weight
Profit & Loss
Profit & Loss %
Today % Change
Recommended Allocation
The table updates continuously with market prices, giving investors an immediate understanding of performance, exposure, and risk across all positions.
⚪ 2. Dividend Information
Dividend data for your holdings is automatically fetched, organized, and presented alongside your positions. This includes dividend amount, ex-date, and pay-date, along with projected payouts based on your share count. All dividend-related information is integrated directly into the portfolio view, so you can plan cash flow without switching tools.
⚪ 3. Portfolio Summary
A dedicated summary panel consolidates the entire portfolio into a single snapshot: total value, total PnL, YTD %, today’s change, and overall volatility. The volatility reading is particularly valuable, providing a quick gauge of your portfolio’s risk level and how sensitive it may be to market movement.
⚪ 4. Portfolio Weight Recommendation
An intelligent weighting engine reviews your current allocations and highlights where your portfolio is overexposed or underweighted. It offers recommended allocation levels designed to reduce concentration risk and improve balance, giving you a clearer path toward a more stable long-term positioning.
█ How to Use
⚪ Performance Tracking
Quickly assess your entire portfolio’s profit, loss, daily movement, and volatility from one centralized dashboard. The summary panel gives you an instant read on how your holdings are performing and how sensitive they are to market swings.
⚪ Dividend Management
Monitor upcoming dividend amounts, ex-dates, and pay-dates directly inside your portfolio table. This ensures you never miss a payout opportunity and can plan your expected cash flow with complete clarity.
⚪ Risk Management & Optimization
Use portfolio-wide volatility and the intelligent Recommended Allocation engine to identify imbalances in your holdings. These insights help you adjust position sizes, reduce concentration risk, and maintain a more stable long-term portfolio profile.
⚪ Currency Comparison
Switch between different base currencies to evaluate performance in local or international terms. All positions are automatically normalized using live FX data, making global portfolio management effortless.
█ How It Works
Stock Management (Zeiierman) continuously gathers price, currency, dividend, and volatility data for every ticker you track. All values are automatically converted into your selected reporting currency, so global holdings remain comparable in one unified view.
It builds a live portfolio snapshot of each bar, updating position values, PnL, daily returns, YTD performance, and overall volatility. This gives you an always-current understanding of how your portfolio is performing and how each holding contributes to risk and exposure.
An intelligent, volatility-aware allocation model generates recommended portfolio weights and position sizes, helping you identify where you may be overexposed or underweighted. Dividend information is integrated directly into the table, projecting future payouts and highlighting upcoming ex-dates and pay-dates.
-----------------
Disclaimer
The content provided in my scripts, indicators, ideas, algorithms, and systems is for educational and informational purposes only. It does not constitute financial advice, investment recommendations, or a solicitation to buy or sell any financial instruments. I will not accept liability for any loss or damage, including without limitation any loss of profit, which may arise directly or indirectly from the use of or reliance on such information.
All investments involve risk, and the past performance of a security, industry, sector, market, financial product, trading strategy, backtest, or individual's trading does not guarantee future results or returns. Investors are fully responsible for any investment decisions they make. Such decisions should be based solely on an evaluation of their financial circumstances, investment objectives, risk tolerance, and liquidity needs.
MaxToro 1H Pivots HL + Sessions + Wick Detector + EMAs [v2.4]MaxToro 1H Pivots + Sessions + Wick Detector + EMAs — Indicator Description
The MaxToro 1H Pivots + Sessions + Wick Detector + EMAs indicator is a multi-tool market-structure system designed to highlight liquidity, wick imbalances, intraday session behavior, and dynamic trend direction. It combines several professional-grade tools into a single clean overlay.
Core Features
1. Automatic Pivot High/Low Mapping (1H-Style Labels)
Plots swing highs and lows using customizable left/right lengths.
Labels each pivot with the exact price for easy reference.
Helps identify structural shifts, liquidity zones, and trending environments.
2. Session Visualization (Tokyo, London, New York)
Highlights the three major trading sessions directly on the chart.
Custom session times (America/Chicago timezone).
Each session has a separate color for fast volatility recognition.
Ideal for traders using:
Time-of-day models
ICT Killzones
Session-based liquidity shifts
3. Wick Rejection Detector
This system identifies candles with abnormally large wicks, helping you detect:
Liquidity sweeps
Rejection zones
Stop hunts
Market inefficiencies
Features include:
Upper wick detections
Lower wick detections
Bar highlighting
Optional wick-range lines
Alerts for both upper and lower wick events
Perfect for spotting algorithmic manipulation and reversal zones.
4. EMA Trend Filters (20 / 50 / 100 / 200)
This version includes a full moving average suite:
EMA 20 → short-term momentum
EMA 50 → mid-term trend
EMA 100 → structure bias
EMA 200 → higher-timeframe trend anchor
Features:
Toggle on/off
Adjustable opacity
Clean color-coded lines
Works as dynamic support/resistance
Confluence with pivots & wick sweeps
5. Information Table
A corner-based info box shows wick conditions in real time:
Wick multiplier
Upper wick signal (true/false)
Lower wick signal (true/false)
Helps traders interpret candle behavior without scanning every bar.
What This Indicator Helps You Do
✔ Identify liquidity sweeps
Wick detector + pivot labels show where algorithms take out highs/lows.
✔ Improve directional bias
EMA 100/200 and pivot structure help confirm trend direction.
✔ Read session-driven volatility
You instantly see when price is entering or exiting high-volume killzones.
✔ Catch reversals early
Wick rejections highlight exhaustion, displacement setups, and trap candles.
✔ Trade with confidence
You always know:
Where pivots are
What session you’re in
Where major EMAs sit
Whether candles show aggressive wick pressure
Ideal For
ICT/SMC traders
Liquidity & sweep-based strategies
Session-based traders
Trend-followers or scalpers
Anyone using 1H pivots for intraday directional bias
Summary
This all-in-one indicator blends institutional concepts—liquidity mapping, wick manipulation, time-of-day behavior, and trend structure—to give you a complete picture of the market in one clean visual tool.
Perfect for mechanical execution and top-down confluence.

Sphinx Trade ChecklistSphinx Trade Checklist — Your Rule-Based Trading Companion
Sphinx Trade Checklist is not a price-based indicator — it’s a structured decision-making tool designed to help traders follow a consistent, rule-based approach before entering any trade.
This checklist window guides you through a complete top-down analysis process:
1. Bias (Higher Timeframe) — Daily
Start by identifying the overall market bias. Determine whether price is in premium/discount, note any FVGs/imbalances, and confirm the larger directional context. This prevents impulsive trades and keeps you aligned with the dominant flow.
2. Mid-Term Structure — 4H / 1H
Next, analyze the mid-term structure:
• Key swing points
• Liquidity levels
• OB zones / FVGs
• SMT divergence
This section ensures you understand the structural roadmap that price is currently respecting.
3. Micro Entry — 15m / 5m
Finally, refine your entry on the lower timeframes. Look for your specific confirmations such as:
• Liquidity sweeps
• FVGs
• CHoCH / BOS
• Discount / Premium entries
This is the final step before execution, helping you stay disciplined and avoid weak, emotional trades.
⸻
Why This Tool Matters
Most traders lose not because of strategy but because they skip steps, enter too early, or misread the higher timeframe bias.
Sphinx Trade Checklist keeps your process organized, objective, and consistent — forcing you to confirm each layer of analysis before pressing the button.
Whether you’re a beginner building good habits or an advanced trader wanting more structure, this tool helps you stay crystal-clear on your bias, structure, and entry criteria.

Forever ModelForever Model is a comprehensive trading framework that visualizes market structure through Fair Value Gaps (FVGs), Smart Money Technique (SMT) divergences, and order block confirmations. The indicator identifies potential price rotations by tracking internal liquidity zones, correlation breaks between assets, and confirmation signals across multiple timeframes.
Designed for clarity and repeatability, the model presents a structured visual logic that supports manual analysis while maintaining flexibility across different assets and timeframes. All components are non-repainting, ensuring historical accuracy and reliable backtesting.
Description
The model operates through a three-part sequence that forms the visual foundation for identifying potential market rotations:
Fair Value Gaps (FVGs)
FVGs are price imbalances detected on higher timeframes—areas where price moved rapidly between candles, leaving an inefficiency that may be revisited. The indicator identifies both bullish and bearish FVGs, displaying them with color-coded levels that extend until mitigated.
: Chart showing FVG detection with colored lines indicating bullish (green) and bearish (red) gaps
Smart Money Technique (SMT)
SMT detects divergence between the current chart asset and a correlated pair. When one asset makes a higher high while the other forms a lower high (or vice versa), it indicates a potential shift in delivery. The indicator draws visual lines connecting these divergence points and can filter SMTs to only display those occurring within FVG ranges.
: Chart showing SMT divergence lines between two correlated assets with labels indicating the pair name]
Order Block Confirmations (OB)
When price confirms a signal by crossing a pivot level, an Order Block is created. The confirmation line extends from the pivot point, labeled as "OB+" for bullish signals or "OB-" for bearish signals. The latest OB extends to the current bar, while previous OBs remain fixed at their confirmation points.
: Chart showing OB confirmation lines with OB+ and OB- labels at confirmation points]
Key Features
Higher Timeframe (HTF) Detection
FVGs are detected on a higher timeframe than the current chart, with automatic HTF selection based on the current timeframe or manual override options. This ensures that internal liquidity zones are identified from the appropriate structural context.
External Range Liquidity (ERL)
Tracks the latest higher timeframe pivot highs and lows, marking external liquidity levels that may be revisited. ERL levels are displayed as horizontal lines with optional labels, providing context for potential continuation targets.
: Chart showing ERL lines at recent HTF pivot points
Signal Creation and Confirmation System
The model creates pending signals when FVG levels are mitigated. Signals confirm when price closes beyond a pivot level, creating the OB confirmation line. Stop levels are automatically calculated from the maximum (bearish) or minimum (bullish) price between signal creation and confirmation.
SMT Filtering Options
Display all SMTs or only those within FVG ranges
Require SMT for signal confirmation (optional filter)
Automatic or manual SMT pair selection
Support for both correlated and inverse correlated pairs
Directional Bias Filter
Filter FVG detection to show only bullish bias, bearish bias, or both. This allows analysts to align with higher timeframe structure or focus on unidirectional setups.
Confirmation Line Management
Toggle to extend only the latest confirmation line or all confirmation lines
Transparent label backgrounds with colored text (red for bearish, green for bullish)
Automatic cleanup of old confirmation lines (keeps last 50)
Labels positioned at line end (latest) or middle (older lines)
Position Sizing Calculator
Optional position sizing based on account balance, risk percentage or fixed amount, and instrument-specific contract sizes. Supports prop firm calculations and can display position size, entry, and stop levels in the dashboard.
Information Dashboard
A customizable floating table displays:
Current timeframe and HTF
Remaining time in current bar
Current bias direction
Latest confirmed signal details (type, size, entry, stop)
Pending signal status
The dashboard can be repositioned, resized, and styled to match your preferences.
Special Range Creation
When signals confirm, the model can automatically create special range levels from stop prices. These levels persist on the chart as important reference points, even after mitigation, serving as potential reversal zones for future signals.
Label and Visualization Controls
Toggle FVG labels on/off
Toggle confirmation lines on/off
Customizable colors for bullish and bearish FVGs
ERL color customization
SMT line width adjustment
Order Flow Integration (Optional)
The indicator includes optional Open Interest (OI) based special range detection, allowing integration with order flow analysis for enhanced context.
Technical Notes
All components are non-repainting—once formed, they remain on the chart
FVGs cannot be mitigated on their creation bar
Signal-based special ranges persist even after mitigation (important stop levels)
SMT detection supports both HTF and chart timeframe modes
Maximum 50 confirmation lines are maintained for performance
The model is designed to work across all asset classes and timeframes, providing a consistent framework for identifying potential market rotations through the interaction of internal liquidity, correlation breaks, and confirmation signals, this does not constitute as trading advice, past performance is no indication of future performance , this is entirely done for entertainment and educational purposes

Elliott Wave + SMC Fusion # Elliott Wave + SMC Fusion
## TITLE:
Elliott Wave + Smart Money Concepts Fusion
---
## SHORT DESCRIPTION:
Automated Elliott Wave pattern detection with Smart Money Concepts confirmation, EWO oscillator integration, and confluence scoring system.
---
## FULL DESCRIPTION:
### 📊 OVERVIEW
This indicator combines three powerful trading methodologies into a unified system:
- **Elliott Wave Theory** - Automated detection of Wave 1-2 impulse patterns
- **Smart Money Concepts (SMC)** - Order Blocks and Fair Value Gaps for institutional confirmation
- **Elliott Wave Oscillator (EWO)** - Momentum-based signal validation
The core concept is to identify high-probability Wave 3 entries by detecting completed Wave 1-2 structures and validating them with SMC and momentum indicators.
---
### 🔧 HOW IT WORKS
**1. Pattern Detection (ZigZag Method)**
- Uses pivot high/low detection to identify swing points
- Validates Wave 2 retracement using Fibonacci ratios (default: 38.2% - 88.6%)
- Requires minimum wave size to filter noise
- Applies confirmation bars to avoid premature signals
**2. Wave Projections**
- Wave 3 target: Fibonacci extension of Wave 1 (default: 1.618)
- Wave 4 retracement: Percentage of Wave 3 (default: 38.2%)
- Wave 5 projection: Extension of Wave 1 from Wave 4
**3. Smart Money Validation**
- **Order Blocks**: Identifies last opposing candle before breakout (institutional footprint)
- **Fair Value Gaps**: Detects price imbalances for potential support/resistance
**4. EWO Confirmation**
- Calculates momentum: (EMA5 / EMA34 - 1) × 100
- Signal line crossovers confirm trend direction
- Strong signals occur at extremes (< -13 or > 13 threshold)
**5. Confluence Scoring (0-100%)**
Points awarded for:
- Fibonacci quality of Wave 2 retracement (10-30 pts)
- Order Block presence (15 pts)
- Fair Value Gap presence (10 pts)
- Volume confirmation (10-15 pts)
- Trend alignment with EMA50 (10 pts)
- EWO confirmation (10-20 pts)
---
### 🎯 UNIQUE FEATURES
**Pattern Locking System**
- Once a valid pattern is detected, it locks until:
- Pattern invalidates (price breaks Wave 0)
- Pattern completes (Wave 5 reached)
- Auto-timeout (configurable bars)
- Prevents rapid signal flipping and false alerts
**Signal Stability Controls**
- Adjustable cooldown between signals (default: 20 bars)
- Minimum bar distance between wave points
- Direction change requirement option
- Confirmation bars after Wave 2 formation
**Visual Wave Tracking**
- Solid lines for impulse waves (0→1, 2→3, 4→5)
- Dashed lines for corrective waves (1→2, 3→4)
- Numbered labels on each wave point
- Real-time projection lines to targets
**Comprehensive Dashboard**
- Current wave status and lock state
- Pattern grade (A+ to D based on confluence)
- Projected vs actual wave levels (✓ when completed)
- SMC confirmation status
- Risk/Reward ratio calculation
- EWO trend direction
---
### 📈 TRADING APPLICATION
**Entry Strategy**
- Wait for Wave 1-2 pattern detection (diamond signal)
- Check confluence score (>65% = higher probability)
- Verify EWO alignment with pattern direction
- Enter after 30% retracement of Wave 2 (customizable)
**Risk Management**
- Stop Loss: Below Wave 0 (with buffer)
- Take Profit 1: Wave 3 projection
- Take Profit 2: Wave 5 projection
- R:R displayed in dashboard
**Invalidation Rules**
- Price breaks below Wave 0 (bullish) or above (bearish)
- Wave 2 level violated before Wave 3 forms
- Pattern timeout exceeded
---
### ⚙️ KEY SETTINGS
**Elliott Wave**
- ZigZag Length: Pivot detection sensitivity
- Fib Tolerance: Acceptable retracement range
- Min Wave Size: Filter small movements
**Signal Stability**
- Signal Cooldown: Minimum bars between signals
- Lock Pattern Until Invalid: Prevent signal changes
- Confirmation Bars: Wait after Wave 2
**Wave Projection**
- Wave 3/4/5 Fibonacci extensions
- Projection display distance
**EWO Settings**
- Fast/Slow EMA lengths
- Signal smoothing
- Strength threshold
**SMC Settings**
- Order Block lookback period
- FVG minimum size percentage
---
### 🔔 ALERTS
- New bullish/bearish pattern detected
- High confluence setup (>75%)
- Pattern invalidation
- Wave completion
---
### ⚠️ IMPORTANT NOTES
- This indicator identifies **potential** Elliott Wave patterns based on mathematical rules
- Elliott Wave analysis is subjective - patterns may be interpreted differently
- Always combine with other analysis methods and proper risk management
- Past pattern performance does not guarantee future results
- Pattern locking prevents repainting but delays new pattern detection
- Best used on higher timeframes (1H+) for cleaner wave structures
---
### 📚 METHODOLOGY REFERENCES
**Elliott Wave Theory**
- Wave 2 typically retraces 38.2% - 88.6% of Wave 1
- Wave 3 is often the strongest, extending 161.8% of Wave 1
- Wave 4 usually retraces 38.2% of Wave 3
- Wave 5 completes the impulse structure
**Smart Money Concepts**
- Order Blocks represent institutional supply/demand zones
- FVGs indicate price inefficiencies that may act as magnets
**Elliott Wave Oscillator**
- Developed to identify wave momentum
- Crossovers signal potential wave transitions
- Extreme readings often coincide with wave completions
---
### 🎨 VISUAL ELEMENTS
- **Green**: Bullish patterns and projections
- **Red**: Bearish patterns and projections
- **Orange**: Wave projection levels
- **Purple**: Order Block zones
- **Yellow**: Fair Value Gaps
- **Blue**: Entry levels
- **Diamond shapes**: New pattern signals
- **Triangle shapes**: EWO crossover signals
---
### 💡 TIPS FOR BEST RESULTS
1. Use on liquid markets with clear trend behavior
2. Higher timeframes produce more reliable patterns
3. Look for confluence scores above 65%
4. Verify EWO alignment before entry
5. Consider market context (overall trend, key levels)
6. Adjust ZigZag length based on your trading style
7. Increase cooldown period for longer-term signals
---
**Indicator Type**: Overlay
**Markets**: All (Crypto, Forex, Stocks, Commodities)
**Timeframes**: All (1H+ recommended)
**Style**: Pattern Recognition + Momentum + Price Action

MP Universal FVG Detector🇺🇸 English Description
MP Universal FVG Detector
A clean and powerful indicator that automatically detects classic ICT 3-candle Fair Value Gaps on any market and any timeframe.
It highlights bullish and bearish imbalances with clear colored boxes, helping you quickly spot inefficient price zones where liquidity is likely to return.
Perfect for:
• Smart Money Concepts
• ICT/Inner Circle Trader setups
• Breaker / OB / Displacement traders
• Scalpers, day traders, swing traders
The indicator works with all assets: crypto, forex, stocks, indices, commodities — and on all timeframes.
🇺🇦 Опис українською
MP Universal FVG Detector
Чистий і потужний індикатор, який автоматично визначає класичні 3-свічкові Fair Value Gap (FVG) у стилі ICT на будь-якому ринку та будь-якому таймфреймі.
Він підсвічує бичачі та ведмежі дисбаланси кольоровими боксами, щоб ти легко бачив неефективні зони ціни, куди з великою ймовірністю повернеться ліквідність.
Підходить для:
• Smart Money Concepts
• ICT/Inner Circle Trader структур
• Breaker / Order Block / Displacement трейдерів
• Скальпінгу, внутрідеяльної та свінг-торгівлі
Працює з усіма активами: крипта, форекс, акції, індекси, товари — і на всіх таймфреймах.

Ross Cameron 5 Pillars FilterFirst, I am not Ross Cameron. This indicator is based on his five pillars of stock selection.
ROSS CAMERON 5 PILLARS MOMENTUM FILTER
🎯 OVERVIEW
This indicator automatically checks if the current symbol meets Ross Cameron's famous "5 Pillars" stock selection criteria from Warrior Trading - a proven methodology for identifying high-probability momentum day trading setups.
📊 ROSS CAMERON'S 5 PILLARS
1️⃣ RELATIVE VOLUME ≥5x (Automated ✅)
• Compares current volume to 30-day average
• Minimum 5x confirms institutional/retail interest
• High RVol = high liquidity and momentum potential
2️⃣ DAILY % CHANGE ≥10% (Automated ✅)
• Stock must already be showing momentum
• Default threshold: 10% up from previous close
• Confirms demand is already present
3️⃣ NEWS CATALYST (Manual Check ⚠️)
• Breaking news justifies the price movement
• Look for: earnings, FDA approvals, partnerships, contracts
• 🔥 icon flags stocks with ≥15% momentum (likely news-driven)
4️⃣ PRICE RANGE $1-$20 (Automated ✅)
• Sweet spot for retail trader momentum
• Highly volatile small-cap stocks
• Accessible price range for position building
5️⃣ FLOAT <10 MILLION SHARES (Automated ✅)
• Low float creates supply/demand imbalances
• Enables explosive 50-100%+ intraday moves
• Automatically checked when data available
• Shows actual float with ✅/❌ indicator
🚀 KEY FEATURES
✅ GREEN BACKGROUND HIGHLIGHT
• Visual alert when ALL automated criteria are met
• Instantly identify potential setups while scanning watchlist
📋 DETAILED BREAKDOWN TABLE
• Shows pass/fail status for each pillar
• Displays actual values (RVol, %, Float, etc.)
• Color-coded for quick interpretation
🔥 STRONG MOMENTUM INDICATOR
• Highlights stocks ≥15% (likely have news catalyst)
• Helps prioritize which stocks to research first
🔔 BUILT-IN ALERTS
• "Ross Cameron Criteria Met" - All automated criteria pass
• "Strong Momentum Alert" - Stock showing explosive movement
⚙️ FULLY CUSTOMIZABLE
• Adjust all thresholds to your trading style
• Configurable table position and display
• Toggle volume spike filter on/off
💡 HOW TO USE
BEST WORKFLOW:
1. Build a watchlist of small-cap stocks using TradingView's Stock Screener
2. Add this indicator to your charts
3. Flip through your watchlist - look for GREEN BACKGROUNDS
4. Check the table for detailed breakdown of each pillar
5. VERIFY NEWS CATALYST (required for Pillar 3)
6. If float shows N/A, verify manually on Finviz
7. Execute your trading plan with proper risk management
OPTIMAL TIMING:
• Pre-Market (8:00-9:30 AM ET) - Identify gap-up candidates
• Morning Session (9:30 AM-12:00 PM ET) - Prime momentum window
• Avoid lunch hour (12:00-2:00 PM ET) - Low volume, choppy
ALERT SETUP:
1. Click "Create Alert" on your chart
2. Select "Ross Cameron Criteria Met" condition
3. Get notified when new setups appear real-time
⚙️ CUSTOMIZABLE SETTINGS
PILLAR 1 - RELATIVE VOLUME:
• Min RVol: 5.0x (Ross's minimum, increase for more selective)
• RVol Period: 30 days (industry standard)
PILLAR 2 - MOMENTUM:
• Min Daily %: 10% (increase to 15% for stronger setups)
PILLAR 3 - CATALYST:
• Strong Momentum %: 15% (threshold for 🔥 indicator)
PILLAR 4 - PRICE RANGE:
• Min Price: $1.00 (adjust based on account size)
• Max Price: $20.00 (Ross's sweet spot)
PILLAR 5 - FLOAT:
• Max Float: 10M shares (ultra-aggressive traders use 5M)
ADDITIONAL FILTERS:
• Volume Spike: 2x (Warrior Trading standard)
• Confirms intraday momentum continuation
📈 INTERPRETATION GUIDE
✅ GREEN BACKGROUND = GO!
• All automated criteria are met
• Check news catalyst before trading
• Verify setup on chart (not overextended)
• Follow your risk management plan
❌ NO GREEN BACKGROUND = WAIT
• At least one criterion failed
• Check table to see which pillar(s) failed
• May become valid later if momentum increases
🔥 FLAME ICON = HIGH PRIORITY
• Stock showing very strong momentum (≥15%)
• Likely has significant news catalyst
• Research news IMMEDIATELY
• Often the best setups of the day
⚠️ N/A FOR FLOAT = MANUAL CHECK
• TradingView doesn't have float data for this symbol
• Verify on Finviz.com or similar
• If float >10M, setup is invalid per Ross's criteria
📚 RECOMMENDED STRATEGIES
GAP AND GO:
• Stock gaps up 10%+ on news
• Enters above gap high with volume
• Targets: 20-50% gains
VWAP BOUNCE:
• Pullback to VWAP support
• Enters on bounce with volume confirmation
• Tight stop below VWAP
HIGH OF DAY BREAKOUT:
• New HOD with volume surge
• Momentum continuation play
• Trail stop as it runs
ABCD PATTERN:
• Classic reversal pattern
• Enters on D-point breakout
• Target: A-B distance from C
⚠️ RISK WARNINGS
• DAY TRADING IS HIGHLY RISKY - Most day traders lose money
• This indicator finds setups - YOUR EXECUTION determines success
• Always use proper risk management (1-2% risk per trade)
• Never trade without stop losses
• Paper trade extensively before using real money
• Past performance does not guarantee future results
🔧 TECHNICAL DETAILS
• Pine Script v6
• Works on any timeframe (calculates daily metrics automatically)
• Compatible with TradingView Free, Pro, Premium
• No repainting - all calculations based on confirmed data
• Efficient code - minimal lag
📊 DATA SOURCES
• Relative Volume: Calculated from 30-day volume average
• Daily %: Previous day's close vs current price
• Float: TradingView's shares_outstanding_float data
• Volume Spike: 20-period volume moving average
🎯 WHO THIS IS FOR
IDEAL FOR:
✅ Day traders focused on momentum strategies
✅ Traders who follow Ross Cameron/Warrior Trading methodology
✅ Small-cap stock traders ($1-$20 range)
✅ Scalpers and swing traders seeking high-volatility setups
NOT IDEAL FOR:
❌ Long-term investors
❌ Large-cap stock traders
❌ Options-only traders
❌ Traders who don't monitor news catalysts
💬 USAGE TIPS
1. COMBINE WITH OTHER TOOLS
• Use alongside your charting/technical analysis
• Verify pattern setups (bull flags, ABCD, etc.)
• Check Level 2 / Time & Sales for confirmation
2. MAINTAIN A WATCHLIST
• Update daily with fresh small-cap movers
• Use Finviz Gap Scanner as starting point
• Focus on sectors with momentum
3. RISK MANAGEMENT IS KEY
• Never risk more than 1-2% per trade
• Use 2:1 minimum profit/loss ratio
• Cut losses quickly, let winners run
• Position size based on volatility (ATR)
4. TRACK YOUR RESULTS
• Keep a trading journal
• Note which setups work best for you
• Refine criteria based on your data
• Continuous improvement mindset
📝 DISCLAIMER
This indicator is for EDUCATIONAL PURPOSES ONLY. It is not investment advice, a recommendation to buy/sell securities, or a guarantee of profits. Trading involves substantial risk of loss. Always:
• Conduct your own research and due diligence
• Consult with a licensed financial advisor
• Never risk money you cannot afford to lose
• Understand that most day traders lose money
• Practice in a simulator before trading real money
The creator of this indicator is not affiliated with Ross Cameron or Warrior Trading. This is an independent implementation of publicly available trading methodology.
📈 SUPPORT & FEEDBACK
If you find this indicator helpful, please:
• Give it a thumbs up 👍
• Leave a comment with your experience
• Share with other momentum traders
• Follow for updates and new indicators
For questions or suggestions, leave a comment below!
---
🏆 HAPPY TRADING! Remember: The indicator finds opportunities, but YOUR discipline, risk management, and execution determine your success.
#DayTrading #Momentum #RossCameron #WarriorTrading #SmallCaps #GapAndGo #Scalping #StockScreener

X ATM Option Ladder Premium (1DTE Dynamic Wings)X ATM Option Ladder Premium is a specialized options-market visualization tool designed for intraday tracking of at-the-money (ATM) option premiums in index ETFs such as QQQ and SPY.The script dynamically identifies the ATM contract on every bar and plots real-time call-versus-put premium differences, with columns for positive/negative diffs and markers (blue dots for positive, red squares for negative) to represent upward price ticks in the option premiums.By analyzing premium levels and direction data from multiple strikes within a dynamic ± range (approximating 0.25 delta wings for 1DTE), the indicator produces a real-time histogram that reflects how premium skew evolves relative to the underlying price.Complementary status tables display the active strike, ladder position, IV-derived wing depth, and warnings when the underlying moves outside the monitored range.Core FeaturesDynamic ATM selection – Each bar automatically maps to the option contract closest to the underlying’s price.Bidirectional premium comparison – Visual separation of call and put premiums (optional columns), with premium diff as the primary histogram and “up” markers highlighting contracts trading above their prior close.Multi-strike ladder analysis – Samples strikes within IV-adjusted wings (±2-5 points typical for 1DTE at 15-25% IV) from the defined center to capture skew and momentum near the money; uses VIX1D for real-time IV approximation.Optimized data calls – Uses tuple requests to minimize request.security() load, enabling a wider ladder within TradingView limits.Session awareness – Restricts processing to the 9:30 AM – 4:15 PM ET option-trading window.Status dashboard – Displays date, active strike, warning flags (“⚠︎ / •outside”), wing parameters (e.g., “±3 (VIX1D=20%)”), and ladder details directly on chart.Use CaseThe indicator is intended for intraday traders and options-premium analysts who want to visualize how short-term pricing dynamics and sentiment migrate across the ATM region as the underlying moves. Typical applications include:Monitoring real-time call/put premium imbalances to detect skew shifts, put-call parity deviations, or implied vol divergences.Identifying premium clustering near the money—where theta decay or gamma effects can signal underlying price acceleration or pinning.Detecting when price exits the monitored ladder (⚠︎ / •outside), signaling a potential regime change or requiring manual recentering.Integrating premium flow into broader volatility or ETF models (e.g., VIX alignment or QQQ/SPY skew confirmation for straddle/strangle trades).Technical NotesStatic-center architecture ensures historical consistency: prior bars remain fixed even after re-centering.Ladder depth is dynamically computed for 1DTE 0.25Δ wings via VIX1D IV (fallback to fixed ±3); capped at ±5 to stay under TradingView’s security-call limits.auto_nudge is enabled to smoothly align the selected lane with the active ATM without requiring user intervention.Indicator is optimized for 1-minute to 5-minute charts; use overlay = false to preserve scale clarity. Manual 1DTE expiry input required (e.g., YYMMDD format).

Michael's FVG Detector═══════════════════════════════════════
Michael's FVG Detector
═══════════════════════════════════════
A clean and efficient Fair Value Gap (FVG) indicator for TradingView that helps traders identify market imbalances with precision.
───────────────────────────────────────
Overview
───────────────────────────────────────
Fair Value Gaps (FVGs) are price inefficiencies that occur when there's a gap between the wicks of candlesticks, indicating rapid price movement with minimal trading activity. These gaps often act as support/resistance zones where price may return to "fill the gap."
This indicator automatically detects and visualizes both bullish and bearish FVGs on any timeframe, making it easy to spot potential trading opportunities.
───────────────────────────────────────
Features
───────────────────────────────────────
Core Functionality
Automatic FVG Detection : Identifies Fair Value Gaps in real-time as they form
Bullish & Bearish FVGs : Detects both upward and downward price gaps
3-Candle Pattern : Uses classic FVG logic (current candle low > high from 2 bars ago for bullish, vice versa for bearish)
Gap Size Display : Shows the exact size of each FVG in ticks directly on the box
Confirmed Bars Only : Only draws FVGs on confirmed bars to prevent repainting
Customization
Color Settings : Fully customizable colors for bullish and bearish FVGs with transparency control
Text Color : Configurable color for the tick size labels
Default Styling : Comes with sensible defaults (20% transparency, dark gray labels)
Performance Optimization
Smart Cleanup : Automatically removes boxes outside the visible chart area
Efficient Rendering : Maintains optimal performance even on lower timeframes
No Repainting : Uses confirmed bars only for reliable signals
───────────────────────────────────────
How It Works
───────────────────────────────────────
Detection Logic
Bullish FVG:
Current bar's low is higher than the high from 2 bars ago
Creates an upward gap that price left behind during bullish momentum
Bearish FVG:
Current bar's high is lower than the low from 2 bars ago
Creates a downward gap that price left behind during bearish momentum
Visual Display
Each detected FVG is displayed as:
A semi-transparent colored box spanning the gap area
The box extends from bar -2 to the current bar
Gap size in ticks shown at the bottom-left of each box
Singular/plural formatting ("1 tick" vs "X ticks")
───────────────────────────────────────
Performance Notes
───────────────────────────────────────
Cleanup runs every 50 bars to maintain optimal performance
Only creates boxes on confirmed bars (no real-time repainting)
Efficiently manages memory by removing off-screen boxes
Suitable for both manual and automated trading strategies
───────────────────────────────────────
Disclaimer
───────────────────────────────────────
This indicator is for educational and informational purposes only. It is not financial advice. Always do your own research and risk management before making trading decisions.
───────────────────────────────────────
Author : Michael
Version : 1.0
License : Free for personal use
Last Updated : November 2025

🎯 Wyckoff Scalping Pro V2🎯 Wyckoff Scalping Pro V2
Short Description:
Advanced Wyckoff methodology combined with order flow, liquidity analysis, and multi-factor scoring system. Professional-grade scalping and day trading tool with 10-point signal strength rating.
Full Description:
Wyckoff Scalping Pro V2 is a comprehensive trading system that combines classical Wyckoff methodology with modern Smart Money Concepts for precision entries in any timeframe.
🎯 What Makes This System Unique?
Unlike basic indicators that just show patterns, this system uses a 10-Point Scoring System to rate every potential trade:
Signal Strength Components:
✅ Wyckoff Patterns (3 points) - Spring, Upthrust, SOS, SOW
✅ Liquidity Grabs (2 points) - Smart Money stop hunts
✅ Trend Alignment (2 points) - Current timeframe trend
✅ HTF Alignment (2 points) - Higher timeframe confirmation
✅ Volume Confirmation (1 point) - Extreme volume spikes
Only signals with 5+ points are displayed, ensuring you only see high-probability setups!
🔥 Core Features
📊 1. Wyckoff Methodology
Four classic accumulation/distribution patterns:
SPRING (Bullish Reversal)
Price breaks below swing low
Quick recovery with volume
Stop losses swept → reversal up
3-point signal component
UPTHRUST (Bearish Reversal)
Price breaks above swing high
Quick rejection with volume
Bull trap → reversal down
3-point signal component
SOS (Sign of Strength)
Strong bullish candle after accumulation
Breakout with volume
Trend initiation signal
SOW (Sign of Weakness)
Strong bearish candle after distribution
Breakdown with volume
Downtrend initiation signal
💹 2. Order Flow Analysis
Order Blocks
Institutional buying/selling zones
Automatic detection based on strong moves
Limited to 10 zones for clean charts
Transparent boxes for minimal clutter
Fair Value Gaps (FVG)
Price imbalances likely to be filled
Minimum size filter (customizable)
Blue (bullish) and purple (bearish)
Maximum 8 gaps shown
Supply & Demand Zones (Optional)
Classic S/D methodology
Fresh zones only
Toggle on/off for preferences
Professional zone labeling
💧 3. Liquidity Analysis
Liquidity Grabs Detection
Identifies sweep of swing highs/lows
Confirms with volume and candle structure
Yellow labels for visibility
Only major liquidity events shown
Why This Matters:
Smart money often "hunts stops" by sweeping liquidity before reversing. These grabs are powerful reversal signals.
📈 4. Multi-Timeframe Trend Analysis
Current Timeframe:
Fast EMA (default: 9)
Slow EMA (default: 21)
Major trend EMA (default: 200)
Higher Timeframe:
Customizable HTF (default: 15min)
Automatic alignment check
Background tint shows HTF trend
Can require HTF confirmation for signals
🎯 5. Two Trading Modes
STRICT MODE (Default - Recommended)
Requires trend alignment
HTF must confirm
Minimum 5/10 strength
Higher win rate, fewer signals
Best for beginners
FAST MODE
No trend requirements
HTF optional
Minimum 5/10 strength
More signals, lower win rate
For experienced scalpers
📊 6. Live Dashboard
Real-time information panel showing:
Current TF trend (Bull/Bear)
HTF trend status
Volume analysis (Normal/High/Extreme)
Major trend (Above/Below 200 EMA)
Active signal (LONG/SHORT/WAIT)
Signal strength (X/10 points)
Operating mode (Strict/Fast)
⚙️ Customization
Signal Filter Settings:
Min Signal Strength: 3-9 (default: 5)
→ Higher = fewer but better signals
Signal Cooldown: 1-20 bars (default: 5)
→ Prevents signal spam
Strict Mode: ON/OFF
→ Requires trend + HTF alignment
Wyckoff Settings:
Wyckoff Period: 10+ (default: 20)
→ Lookback for pattern detection
Volume Threshold: 1.5+ (default: 2.0)
→ How much above average for confirmation
Order Flow:
Order Blocks: Toggle ON/OFF
Liquidity Grabs: Toggle ON/OFF
Fair Value Gaps: Toggle ON/OFF
FVG Min Size: 0.2-5% (default: 0.5%)
Supply/Demand Zones: Toggle ON/OFF (default: OFF)
Trend Filter:
Fast EMA: Default 9
Slow EMA: Default 21
Major EMA: Default 200
Use 200 EMA Filter: Toggle
Multi-Timeframe:
HTF Timeframe: Any (default: 15min)
Require HTF Alignment: Toggle
💡 How To Use
For Scalping (M1-M5):
Set HTF to M15
Use Strict Mode
Min Signal Strength: 6
Focus on liquidity grabs
Quick in and out
For Day Trading (M15-H1):
Set HTF to H1 or H4
Use Strict Mode
Min Signal Strength: 5
Watch all components
Swing for larger moves
For Swing Trading (H4-D1):
Set HTF to Daily or Weekly
Use Strict Mode
Min Signal Strength: 7
Disable S/D zones (less clutter)
Hold for days
🎯 Entry Rules
LONG Entry:
Required:
Green triangle appears below bar
Label shows "LONG"
Strength ≥ 5/10 in dashboard
Optional (for higher probability):
Strength 7+/10
Spring or SOS pattern present
Liquidity grab occurred
HTF shows green trend
Above 200 EMA
Stop Loss:
Below order block or swing low
10-20 pips buffer
Take Profit:
Next supply zone or opposite order block
Minimum 1:2 RRR
SHORT Entry:
Required:
Red triangle appears above bar
Label shows "SHORT"
Strength ≥ 5/10 in dashboard
Optional (for higher probability):
Strength 7+/10
Upthrust or SOW pattern present
Liquidity grab occurred
HTF shows red trend
Below 200 EMA
Stop Loss:
Above order block or swing high
10-20 pips buffer
Take Profit:
Next demand zone or opposite order block
Minimum 1:2 RRR
📊 Best Markets & Timeframes
✅ Forex
All major pairs (EUR/USD, GBP/USD, etc.)
Best on M5-H1
High liquidity = cleaner signals
✅ Gold (XAUUSD)
Excellent for scalping
M5-M15 optimal
Strong liquidity events
✅ Crypto
Bitcoin, Ethereum
M15-H1 recommended
Volatile = more opportunities
✅ Indices
S&P 500, NASDAQ, etc.
M15-H4 optimal
Clear trends
✅ Stocks
Large cap only
Day trading timeframes
Sufficient volume required
🔔 Alert System
Available Alerts:
🟢 LONG Entry Signal
🔴 SHORT Entry Signal
🟡 Bullish Liquidity Grab
🟡 Bearish Liquidity Grab
🔵 Spring Pattern
🔴 Upthrust Pattern
Alert Messages Include:
Ticker symbol
Current price
Signal strength (X/10)
Pattern type
Recommended Setup:
Enable LONG and SHORT entry alerts
Set to "Once Per Bar Close"
Notification to mobile app
📈 Performance Expectations
Realistic Win Rates:
Strict Mode (5/10 min, with trend):
Win Rate: 65-75%
Signals: 3-8 per day (M15)
Best for: Most traders
Strict Mode (7/10 min, HTF aligned):
Win Rate: 75-85%
Signals: 1-3 per day (M15)
Best for: Conservative traders
Fast Mode (5/10 min, no filters):
Win Rate: 55-65%
Signals: 10-20 per day (M15)
Best for: Experienced scalpers
With Liquidity Grabs:
Win Rate: +10-15% increase
Reversal probability very high
Combine with Wyckoff for best results
💎 Pro Tips
Tip #1: Combine Patterns
Best Setup = Liquidity Grab + Spring/Upthrust
→ 80%+ win rate
→ Smart money confirmed on both sides
Tip #2: Use Signal Strength
5-6 points = OK to trade
7-8 points = Excellent trade
9-10 points = Rare, perfect setup
Tip #3: HTF Alignment
When HTF agrees with signal:
→ Larger position size allowed
→ Wider profit targets
→ Higher probability
Tip #4: Volume Matters
"EXTREME" volume in dashboard:
→ Institutional activity confirmed
→ Higher confidence in setup
→ Stronger moves expected
Tip #5: Clean Charts
Turn OFF S/D zones for day trading
Keep only Order Blocks + FVG
Less clutter = better focus
Tip #6: Signal Cooldown
Increase cooldown during:
→ Low volatility periods
→ Range-bound markets
→ To avoid overtrading
Decrease cooldown during:
→ High volatility
→ Trending markets
→ Major news events
🎨 Visual Design
Clean & Professional:
Minimal chart clutter
Only essential information
Transparent zones (92-95%)
Clear signal markers
Professional color scheme
Information Hierarchy:
Entry signals = LARGEST (impossible to miss)
Liquidity grabs = Medium (yellow labels)
Wyckoff patterns = Small (diamonds)
Zones = Transparent backgrounds
🆚 Comparison to Other Indicators
vs. Basic Order Block Indicators:
✅ Multi-factor scoring system
✅ Wyckoff patterns included
✅ Liquidity analysis built-in
✅ HTF confirmation
✅ Volume analysis vs. Simple Wyckoff Indicators:
✅ Order flow integration
✅ Fair value gaps
✅ Signal strength rating
✅ Multi-timeframe analysis
✅ Professional dashboard vs. Complex "All-in-One" Tools:
✅ Not overwhelming
✅ Focused on what matters
✅ Clean visual design
✅ Fast calculations
✅ Beginner-friendly with pro features
🎯 Who Is This For?
✅ Perfect For:
Scalpers (M1-M5)
Day traders (M15-H1)
Swing traders (H4-D1)
Traders learning Wyckoff
Anyone wanting quality over quantity
Traders seeking multi-confirmation
⚠️ Not Ideal For:
Complete beginners (learn basics first)
"Signal chasers" wanting 50+ signals/day
Traders who don't use stop losses
Very long-term investors
📚 Educational Value
This indicator teaches you:
Classical Wyckoff methodology
How institutions hunt liquidity
Order flow analysis
Multi-timeframe confluence
Volume analysis importance
Risk management through scoring
Learn while you trade!
⚡ Technical Specifications
Pine Script v5
Optimized for speed
No repainting
Real-time calculations
Maximum 200 boxes (clean limits)
Maximum 200 lines
Efficient array management
Works on all liquid markets
🚀 Getting Started (Quick Guide)
Add to Chart
Apply to your favorite pair
Default settings work well
Choose Your Mode
Strict Mode: ON (recommended)
HTF: Set to 15min (or higher for H1+ charts)
Set Alerts
LONG Entry Signal
SHORT Entry Signal
Start Small
Demo trade first
Watch signal strength
Learn the patterns
Scale Up
Once comfortable
Increase position size
Focus on 7+ strength signals
🎯 Final Thoughts
Wyckoff Scalping Pro V2 is not just an indicator - it's a complete trading system that respects your screen space while giving you professional-grade analysis.
The 10-point scoring system ensures you're never guessing about signal quality. You always know exactly how strong a setup is before entering.
Quality over quantity - This system prioritizes high-probability setups over signal spam. You might see 3-8 signals per day on M15, and that's exactly the point. Each one is carefully filtered.
📞 Support & Feedback
Questions? Drop a comment below!
Found this useful? Hit that ⭐ button!
Have suggestions? I'm listening!
Happy Trading! 🚀📈

BTC CME Gaps Detector [SwissAlgo]BTC CME Gaps Detector
Track Unfilled Gaps & Identify Price Magnets
------------------------------------------------------
Overview
The BTC CME Gap Detector identifies and tracks unfilled price gaps on any timeframe (1-minute recommended for scalping) to gauge potential trading bias.
Verify Gap Behavior Yourself : Use TradingView's Replay Mode on the 1-Minute chart to observe how the price interacts with gaps. Load the BTC1! ticker (Bitcoin CME Futures), enable Replay Mode, and play forward through time (for example: go back 15 days). You may observe patterns such as price frequently returning to fill gaps, nearest gaps acting as near-term targets, and gaps serving as potential support/resistance zones. Some gaps may fill quickly, while others may remain open for longer periods. This hands-on analysis lets you independently assess how gaps may influence price movement in real market conditions and whether you may use this indicator as a complement to your trading analysis.
------------------------------------------------------
Purpose
Price gaps occur when there is a discontinuity between consecutive candles - when the current candle's low is above the previous candle's high (gap up), or when the current candle's high is below the previous candle's low (gap down).
This indicator identifies and tracks these gaps on any timeframe to help traders:
Identify gap zones that may attract price (potential "price magnets")
Monitor gap fill progression
Assess potential directional bias based on nearest unfilled gaps (long, short)
Analyze market structure and liquidity imbalances
------------------------------------------------------
Why Use This Indicator?
Universal Gap Detection : Identifies all gaps on any timeframe (1-minute, hourly, daily, etc.)
Multi-Candle Mitigation Tracking : Detects gap fills that occur across multiple candles
Distance Analysis : Shows percentage distance to nearest bullish and bearish gaps
Visual Representation : Color-coded boxes indicate gap status (active vs. mitigated)
Age Filtering : Option to display only gaps within specified time periods (3/6/12/24 months), as older gaps may lose relevance
ATR-Based Sizing : Minimum gap size adjusts to instrument volatility to filter noise (i.e. small gaps)
------------------------------------------------------
Trading Concept
Gaps represent price zones where no trading occurred. Historical market behavior suggests that unfilled gaps may attract price action as markets tend to revisit areas of incomplete price discovery. This phenomenon creates potential trading opportunities:
Bullish gaps (above current price) may act as upside targets where the price could move to fill the gap
Bearish gaps (below current price) may act as downside targets where price could move to fill the gap
The nearest gap often provides directional bias, as closer gaps may have a higher probability of being filled in the near term
This indicator helps quantify gap proximity and provides a visual reference for these potential target zones.
EXAMPLE
Step 1: Bearish Gaps Appear Below Price
Step 2: Price Getting Close to Fill Gap
Step 3: Gap Mitigated Gap
------------------------------------------------------
Recommended Setup
Timeframe: 1-minute chart recommended for maximum gap detection frequency. Works on all timeframes (higher timeframes will show fewer, larger gaps).
Symbol: Any tradable instrument. Originally designed for BTC1! (CME Bitcoin Futures) but compatible with all symbols.
Settings:
ATR Length: 14 (default)
Min Gap Size: 0.5x ATR (adjust based on timeframe and noise level)
Gap Age Limit: 3 months (configurable)
Max Historical Gaps: 300 (adjustable 1-500)
------------------------------------------------------
How It Works
Gap Detection : Identifies price discontinuities on every candle where:
Gap up: current candle low > previous candle high
Gap down: current candle high < previous candle low
Minimum gap size filter (ATR-based) eliminates insignificant gaps
Mitigation Tracking : Monitors when price touches both gap boundaries. A gap is marked as filled when the price has touched both the top and bottom of the gap zone, even if this occurs across multiple candles.
Visual Elements :
Green boxes: Unfilled gaps above current price (potential bullish targets)
Red boxes: Unfilled gaps below current price (potential bearish targets)
Gray boxes: Filled gaps (historical reference)
Labels: Display gap type, price level, and distance percentage
Analysis Table: Shows :
Distance % to nearest bullish gap (above price)
Distance % to nearest bearish gap (below price)
Trade bias (LONG if nearest gap is above, SHORT if nearest gap is below)
------------------------------------------------------
Key Features
Detects gaps on any timeframe (1m, 5m, 1h, 1D, etc.)
Boxes extend 500 bars forward for active gaps, stop at the fill bar for mitigated gaps
Real-time distance calculations update on every candle
Configurable age filter removes outdated gaps
ATR multiplier ensures gap detection adapts to market volatility and timeframe
------------------------------------------------------
Disclaimer
This indicator is provided for informational and educational purposes only.
It does not constitute financial advice, investment recommendations, or trading signals. The concept that gaps attract price is based on historical observation and does not guarantee future results.
Gap fills are not certain - gaps may remain unfilled indefinitely, or the price may reverse before reaching a gap. This indicator should not be used as the sole basis for trading decisions.
All trading involves substantial risk, including the potential loss of principal. Users should conduct their own research, apply proper risk management, test strategies thoroughly, and consult with qualified financial professionals before making trading decisions.
The authors and publishers are not responsible for any losses incurred through the use of this indicator.

FVG Visual Super Clean (ticks)This is a robust and highly visual indicator designed for traders utilizing Smart Money Concepts (SMC) or Inner Circle Trader (ICT) methodologies.
Its core function is to automatically identify, visualize, and manage Fair Value Gaps (FVGs) or price inefficiencies, offering deep insight into institutional order flow.
Key Features & Capabilities
Advanced FVG Detection: Accurately identifies bullish and bearish Fair Value Gaps (FVGs) based on the 3-bar pattern.
Wick vs. Body Logic: Configurable option to use candle wicks (high/low) or bodies (open/close) for FVG calculation.
Displacement Confirmation: Includes an optional filter to require price displacement (a strong close) for higher conviction setups.
Mitigation Tracking & Management: The script actively tracks how much the price has filled or "mitigated" the FVG.
Threshold Auto-Removal: FVGs that reach a user-defined mitigation percentage (mitigation_pct) are automatically removed to keep the chart clean.
Mitigated Visibility: An optional setting allows mitigated FVGs to remain visible, repainting them with a distinct "Mitigated" color (blue by default) to show the exact point of rebalance.
Visual Efficiency:
Automatic Extension: Active, unmitigated FVGs are automatically extended forward in time until they are filled or pruned.
Equilibrium Line: Draws a dotted line at the 50% level (Equilibrium) of each FVG, a key reference point in SMC/ICT trading.
Tick-Based Filtering: Allows filtering gaps by a minimum size in ticks, reducing noise from insignificant micro-gaps.
Trend Context: Integrates a configurable Moving Average (EMA or SMA) for contextual trend analysis. The MA line changes color dynamically (green/red) to quickly signal momentum.
Optimized Performance: Implements a lookback window (lookback_days) and a cleanup routine to manage the number of drawing objects, ensuring smooth performance even on low timeframes.
Ideal For:
Traders focused on SMC/ICT Order Blocks, Imbalances, and Price Delivery.
Backtesting price action strategies around institutional liquidity.
Identifying high-probability entries (e.g., at the 50% line) and targets (e.g., unmitigated gaps).

Rage of UltronRage of Ultron - Multi-Timeframe Smart Money Trading System
Advanced Confluence-Based Trading Indicator
Rage of Ultron is a comprehensive multi-timeframe trading system that combines Smart Money Concepts (SMC) with macro market context, RSI divergences, liquidity sweeps, and volume analysis to identify high-probability setups across all markets.
Key Features
Multi-Timeframe Alignment
* Weekly Bias - Directional trend context
* Daily Structure - Order Blocks and Fair Value Gaps
* 4H Confirmation - Entry timing and execution
* Real-time MTF alignment scoring (🟢 Bull Aligned / 🔴 Bear Aligned / 🟡 Mixed)
Smart Money Concepts
* Order Blocks (OB) - Institutional entry zones with visual clarity
* Fair Value Gaps (FVG) - Price imbalances and retracement magnets
* Change of Character (CHoCH) - Market structure breaks (▲▼)
* Liquidity Sweeps - Stop hunt detection before reversals (💧)
Technical Analysis
* RSI Divergences - Regular and hidden divergences with zones (◆)
* RSI Swing Failure Patterns - Grade-A reversal setups (★)
* Automatic Fibonacci - Dynamic retracements and extensions
* Volume Impulse Detection - Weighted confirmation signals
Macro Market Radar
* DXY - Dollar strength assessment
* BTC Dominance - Crypto market risk gauge
* USDT Dominance - Stablecoin flow analysis
* Combined risk environment scoring
Confluence Scoring System (0-7)
Quantified setup quality with three alert tiers:
* Tier 1 (Score 6-7): Full confluence + sweep + volume + MTF alignment
* Tier 2 (Score 5): High confluence + volume or sweep
* Tier 3 (Score 4): Standard confluence setups
"Rage" Volume State
* 🟢 RAGE PULSE - Explosive volume spike (score 6+ trigger)
* ⚡ Active - Strong volume with good confluence
* 🟡 Stable - Moderate volume conditions
* 🔴 Dormant - Low volume, wait for confirmation
Visual Design
* Clean Zone Rendering - Persistent OB/FVG boxes with limited extension
* Signal Bar Highlighting - Colored fills and contrasting borders for instant recognition
* Dynamic Symbol Placement - ATR-based offset prevents overlap
* Comprehensive Panel - Real-time macro + trade metrics in one view
* Toggleable Legend - Learn signals, hide once familiar
How to Use
1. Set Your Timeframes - Default 1W/1D/4H works for swing trading
2. Monitor Macro Environment - Check risk-on/off context
3. Wait for Confluence ≥4 - Let multiple signals align
4. Enter on Tier 1/2 Alerts - Best probability setups
5. Use Fib Extensions for Targets - Systematic profit taking
Customizable Settings
* Multi-timeframe periods
* RSI length and divergence sensitivity
* Liquidity sweep parameters
* Fibonacci swing lookback
* Volume thresholds
* Shape offset multiplier
* Visual toggles (Fibs, extensions, legend)
Built-in Alert System
Three-tier alert structure lets you filter by setup quality. Set alerts for Tier 1 only for highest conviction trades, or include Tier 2 for more opportunities.
Best Practices
* Use on clean timeframes - 1H+ for less noise
* Combine with support/resistance - Zones near key levels = highest probability
* Respect the macro - Don't fight extreme risk-off environments
* Wait for the full stack - Best trades have 4+ aligned signals
* Practice on demo first - Learn signal behavior in your market
Works On
* Cryptocurrency (spot & futures)
* Forex pairs
* Stock indices
* Individual stocks
* Commodities
Note: This indicator identifies potential setups but does not guarantee profits. Always use proper risk management, position sizing, and stops. Past performance does not predict future results.
Created by cdotgnz | For educational purposes
