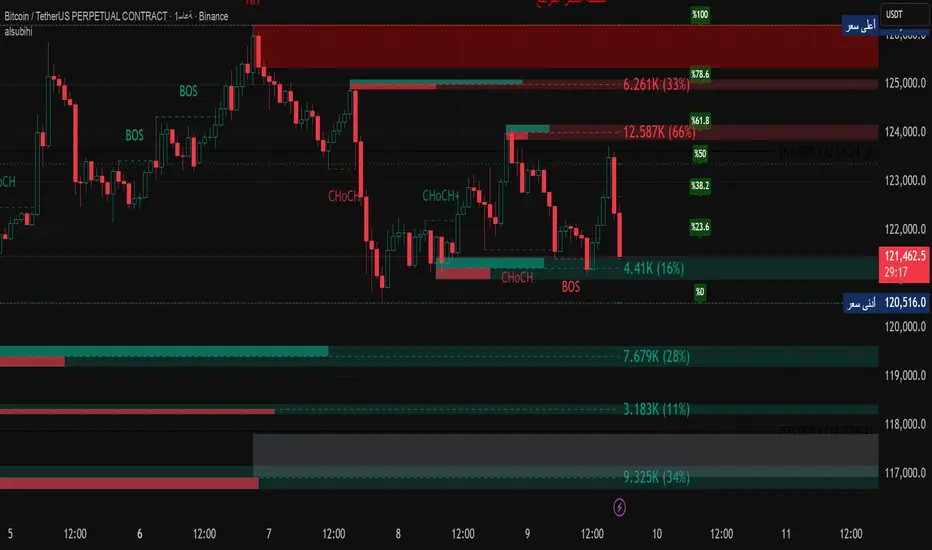
alsubihi.2Advanced Market Structure Indicator
This custom-built indicator provides an in-depth analysis of market structure changes to help traders identify key price levels, trends, and potential reversals. It combines multiple tools to give you a clearer picture of market behavior and improve your decision-making process.
Key Features:
Break of Structure (BOS):
The BOS indicator identifies significant changes in market structure, marking when the price breaks previous highs or lows, signaling a potential trend shift. Green lines represent upward breaks (bullish trend), while red lines show downward breaks (bearish trend).
Change of Character (Choch):
This feature helps to highlight subtle shifts in market dynamics. A change in character (Choch) indicates when the market transitions between bullish or bearish behavior. Green indicates a bullish character change, while red shows a bearish one.
Premium vs Discount Zones:
The indicator identifies price levels that are considered 'Premium' (high price levels) and 'Discount' (low price levels), assisting traders in recognizing overbought or oversold conditions and making better trading decisions based on market conditions.
Support and Resistance Levels:
Automatically drawn support and resistance lines are included to show critical price areas where reversals or breakouts might occur, helping traders anticipate price action.
Equilibrium Zone:
This is the price level where supply and demand balance out, acting as a key reference point for identifying potential market reversals or continuation.
Why Use This Indicator?
This all-in-one tool helps traders make informed decisions by combining multiple technical analysis concepts into a single, easy-to-use indicator. It reduces the complexity of analyzing price action and allows traders to quickly identify potential entry and exit points with greater accuracy.
Whether you are an experienced trader or just starting, this indicator provides you with the essential tools needed to identify trend shifts, key support and resistance zones, and price extremes, leading to more profitable trading decisions.
14 سبتمبر
ملاحظات الأخبار
📌 Summary of the Indicator
Market Structure (MS):
Detects swing & internal BOS, CHoCH, CHoCH+. Can color candles or bars by trend.
Multi-Timeframe Scanner (MTF):
Shows trend direction on multiple TFs (5m → 1W).
Highs/Lows (HTF):
Plots previous Day/Week/Month/Year highs & lows as liquidity levels.
Order Blocks (OB):
Draws volumetric order blocks, with filters (BOS/CHoCH), overlap rules, mitigation, and volume metrics.
Fair Value Gaps (FVG/VI/OG):
Detects price imbalances, extends them, and removes when mitigated.
Accumulation/Distribution Zones:
Highlights Wyckoff-style accumulation (green) or distribution (red).
Equal Highs/Lows (EQH/EQL):
Marks liquidity pools at equal highs or lows.
Premium/Discount Bands:
Splits swing range into premium, equilibrium, and discount zones.
RSI & ADX:
Momentum filters for overbought/oversold and trend strength.
DEMA-ATR Baseline:
Adaptive EMA with ATR constraints; alerts for trend shifts.
Regression Channel:
Auto-fits best regression length using Pearson-R, shows channel with std bands.
Fibonacci Ladder:
Auto plots levels 0.236 → 1.618 based on recent swing.
👉 In short: it’s a full SMC toolkit — structure + liquidity + OB/FVG + momentum filters + extra tools (fib, regression, ATR baseline).
📌 ملخص المؤشر
البنية الهيكلية (Market Structure):
يحدد BOS و CHoCH داخلي وسوينغ، ويقدر يلوّن الشموع حسب الاتجاه.
سكانر متعدد الأطر (MTF):
يعرض الاتجاه على عدة فريمات من 5m إلى 1W.
هاي/لو من أطر عليا (HTF Highs/Lows):
يرسم قمم وقيعان اليوم/الأسبوع/الشهر/السنة السابقة (مناطق سيولة).
بلوكات الطلب/العرض (Order Blocks):
يرسم بلوكات مع فلاتر (BOS/CHoCH)، خيارات تداخل، إزالة عند الكسر، ويعرض حجم التداول بداخلها.
الفجوات السعرية (FVG/VI/OG):
يحدد الفجوات غير المغطاة، يمددها، ويحذفها عند التغطية.
مناطق التجميع/التوزيع:
يوضح مناطق Wyckoff (أخضر للتجميع، أحمر للتوزيع).
قمم وقيعان متساوية (EQH/EQL):
يميز مناطق السيولة فوق القمم أو تحت القيعان المتساوية.
مناطق Premium/Discount/Equilibrium:
يقسم آخر نطاق إلى مناطق غالية (Premium)، توازن (Equilibrium)، ورخيصة (Discount).
RSI و ADX:
مؤشرات إضافية لقياس التشبع وقوة الاتجاه.
خط DEMA-ATR:
EMA متكيف مع قيود ATR، يتغير لونه حسب الاتجاه، مع تنبيهات جاهزة.
قناة الانحدار (Regression):
تختار أفضل طول باستخدام معامل الارتباط Pearson-R، وترسم قناة مع انحراف معياري.
فيبوناتشي (Fibonacci):
يرسم مستويات 0.236 حتى 1.618 حسب آخر حركة سعرية.
👉 باختصار: المؤشر هو أداة SMC متكاملة تجمع الهيكل، السيولة، البلوكات، الفجوات، والمؤشرات المساعدة.
Search in scripts for "imbalance"
Fair Value Gap + VI + FP_FVGThe Ultimate Fair Value Gap Indicator that you need.
Based on ICT's updated definition post 2022, if volume imbalances exists, we have to include the VI as part of the FVG.
As of 2025, ICT has introduced the suspension block - which is a FVG that has VI on both sides of the candle. This indicator shows the suspension block via the border.
Inclusive of HTF and current TF.
First Presented FVG is also included with the option to toggle current day and historical days.

MK_OSFT-Momentum Confluence DetectorMOMENTUM CONFLUENCE DETECTOR - Trading Indicator Overview
What This Indicator Does
The Momentum Confluence Detector is a comprehensive Pine Script indicator designed to identify high-probability trading opportunities by detecting momentum bars that align with multiple confluence factors. It combines traditional technical analysis with advanced Smart Money Concepts to filter out noise and highlight the most significant price movements.
CORE FUNCTIONALITY
📊 Momentum Bar Detection Identifies unusual volume and bar size expansion using customizable multipliers
Detects bullish, bearish, and neutral momentum bars based on OHLC relationships
Uses moving averages to establish baseline volume and bar size thresholds
🔄 Multi-Filter Confluence System
The indicator employs up to 5 different filter types to validate momentum signals:
Level Concept Filter - Choose between:
- Support/Resistance Levels : Traditional pivot-based S/R zones with touch counting and break tracking
- Smart Money Concepts : Institutional order flow analysis including Order Blocks, Fair Value Gaps (FVGs), and market structure breaks
Trend Filter : EMA/SMA-based trend direction confirmation with alignment requirements
Breakout Filter : Detects price breakouts beyond recent highs/lows with percentage thresholds
Volatility Filter : ATR expansion confirmation to ensure signals occur during active market conditions
Market Session Filter : Filters signals to specific trading sessions (Tokyo, London, New York)
ADVANCED FEATURES
🎯 Smart Money Concepts Integration
Order Blocks : Identifies institutional supply/demand zones from major and minor structure breaks
Fair Value Gaps (FVGs) : Detects price imbalances and tracks their evolution through partial fills and inversions
Market Structure : Recognizes Break of Structure (BOS) and Change of Character (CHoCH) patterns
Retracement Patterns : Tracks HLH (Higher-Low-Higher) and LHL (Lower-High-Lower) institutional patterns
📈 Support/Resistance System
Multi-timeframe pivot detection (3, 5, 7-bar spans)
Volume-weighted strength calculation for level importance
Dynamic level merging and break tracking
Automatic level type classification (Support/Resistance/Flip zones)
⚙️ Intelligent Filtering Logic
ALL Mode : Requires all enabled filters to pass (high precision)
ANY Mode : Requires at least one filter to pass (higher frequency)
Real-time filter status tracking and visualization
Visual Features
Signal Markers : Clear triangular markers for qualified momentum bars
Unfiltered Signals : Optional display of raw momentum bars for comparison
Level Visualization : Dynamic S/R level boxes and lines with strength indicators
Structure Lines : BOS/CHoCH break visualization with major/minor classification
Fair Value Gaps : Color-coded boxes showing bullish/bearish FVGs with partial fill tracking and IFVG conversion
Order Blocks : Institutional supply/demand zones displayed as colored boxes with major/minor classification
Information Table : Real-time display of signal details and filter status
Session Boxes : Visual representation of active trading sessions
Practical Applications
✅ Swing Trading : Identify high-probability reversal and continuation setups
✅ Day Trading : Spot intraday momentum shifts with institutional backing
✅ Multi-Timeframe Analysis : Combine major and minor structure analysis
✅ Risk Management : Filter out low-quality setups using confluence requirements
✅ Educational : Understand market structure and institutional order flow
Customization Options
Adjustable momentum thresholds for different market conditions
Comprehensive filter settings with individual enable/disable controls
Visual customization for colors, sizes, and display preferences
Alert system with detailed signal information
Performance optimization settings for different chart timeframes
Who Should Use This Indicator
This indicator is suitable for traders who:
Want to combine multiple technical analysis approaches
Seek to understand institutional market behavior
Prefer confluence-based trading setups
Need customizable filtering for different market conditions
Value comprehensive signal validation over high-frequency alerts
The Momentum Confluence Detector transforms complex market analysis into clear, actionable signals by requiring multiple forms of confirmation before highlighting trading opportunities.

EQ + Bandas Pro 📊 EQ + Bands Pro is an advanced indicator built on OHLC analysis. It calculates a synthetic equilibrium price and plots dynamic, robust bands that adapt to volatility while filtering outliers. The tool highlights zones of overvaluation and undervaluation, helping traders identify key imbalances, potential reversals, and trend confirmations.

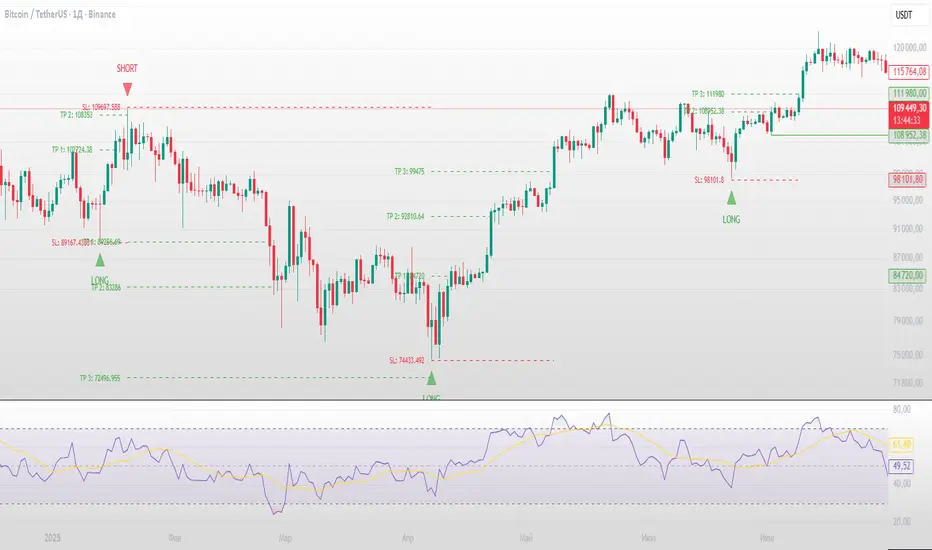
ICT Multi-Timeframe Market Structure Tracker [SwissAlgo]ICT Multi-Timeframe Market Structure Tracker
Tracks the ICT market structure across three core timeframes (1-Week, 1-Day, 1-Hour) simultaneously.
----------------------------------------------------------------------
Why this Indicator?
You know market structure matters, whether you trade stocks, Forex, commodities, or crypto.
You've studied ICT concepts - " Change of Character ", " Break of Structure ", " Premium/discount zones ". You understand that multi-timeframe alignment is where the edge lives.
But here's what's probably happening while you apply the ICT concepts for your trading decisions:
You're manually drawing structural highs and lows across three timeframes
You're calculating Fibonacci retracements by hand for each timeframe
You're switching between weekly, daily, and hourly charts, trying to remember where each pivot was, trying to detect the critical events you're waiting for
By the time you've mapped it all out, the setup is gone. Or worse, you missed that the 1-hour just broke the structure while you were checking the weekly bias.
What about seeing all three timeframes at once instead? You need to know immediately when the price enters a premium or discount zone. You need alerts that fire when structure breaks or character changes - across all timeframes - without babysitting your screen.
----------------------------------------------------------------------
The Indicator, at a Glance
This indicator:
tracks ICT market structure across three core timeframes (1-Week, 1-Day, 1-Hour) simultaneously .
automatically plots Fibonacci retracement levels from your defined structural pivots
monitors price position (during retracements) in real-time
sends consolidated alerts when actionable events occur on any timeframe
The 1-Week View: Mid-Term Trend Bias for lower timeframes
The 1-Day View: Swings nested within the 1-Week Structure
The 1-Hour View: Swings nested within the 1-Day Structure
One glance tells you:
* Current trend direction per timeframe
* Exact Fib zone price is trading right now
* Whether the structure just broke or the character changed
* If you're in a potential long/short setup zone
The indicator helps you reduce chart-hopping, manual calculations, and minimize the missed structural shifts.
----------------------------------------------------------------------
Who is this for?
This tool is built for day traders who understand ICT concepts and need efficient multi-timeframe structure tracking. If you know what a Change of Character is, why 0.382-0.5 retracements matter in uptrends, and how to trade external structure, this indicator eliminates the manual structure tracking so you can focus on confirming and executing your trading tactics.
New to ICT? This indicator assumes foundational knowledge of the Inner Circle Trader methodology developed by Michael J. Huddleston. Before using this tool, familiarize yourself with concepts like market structure breaks, premium/discount arrays, and liquidity engineering. The ICT framework offers a unique perspective on institutional order flow and price action - but this indicator is designed for those already applying these concepts, not learning them for the first time.
Critical Skill Required : You must understand the difference between external structure (key swing highs/lows that define market direction) and internal structure (minor fluctuations within the range).
Selecting incorrect pivots - such as marking internal noise instead of true structural points - will generate false signals and undermine the entire analysis. This indicator tracks structure based on YOUR inputs. If those inputs are wrong, every Fibonacci level, alert, and bias signal will be wrong. Learn to identify clean structural breaks before using this tool.
Trading Experience Matters: This tool tracks structure and fires alerts, but interpreting those signals requires understanding context, confluences, and risk management. If you're early in your trading journey, consider this a professional-grade instrument that becomes powerful once you have the conceptual foundation to use it effectively.
----------------------------------------------------------------------
How It Works
Step 1: Define Your Structure
You, the ICT expert or student, define the structural high and low for each timeframe, with their exact dates. This empowers you to control the analysis.
Based on your entries, the indicator establishes trend direction by timeframe and calculates Fibonacci retracement levels automatically.
* Structural High/Low: Key swing points that define external structure per ICT methodology
* Auto-Validation: Built-in autoscan feature confirms your pivot entries match actual price extremes
* Deterministic Behavior: Date stamps ensure the indicator behaves consistently across all sessions
Step 2: Monitor The Tables
Two tables provide a structural context:
Multi-Timeframe Analysis Table (top-right):
Current close, high, low, and 0.5 Fib for all three timeframes
Trend direction (↑/↓)
Days since structure established (i.e., "age" or maturity)
Current Fibonacci zone
Real-time alerts: Trend changes, breakouts, and trade bias signals
Detailed Fibonacci Table (middle-right):
All nine Fib retracement levels (1.0 to 0.0) for the selected timeframe
Exact price at each level
Percentage distance from current price
Visual marker showing current position
Step 3: Monitor The Chart
Visual elements show structure at a glance:
Fibonacci Retracement Zones: Color-coded bands show premium (red), discount (green), and equilibrium (gray) areas based on trend direction
Structural Lines: Red (high) and green (low) horizontal lines mark your defined pivots with automatic fill showing the current range (based on higher timeframe pivots)
Pivot Dots: Optional small markers highlight potential structural turning points on your current timeframe (reference only - always validate pivots yourself)
Trend Indicator: Top-center banner displays the selected timeframe's current trend
Auto-pivot points
Step 4: Get Alerts and Decide the Way Forward
Set one alert on the 1-hour chart only (if you set the alert on other timeframes, you may get delayed feedback).
You'll receive notifications when ANY of these events occur on ANY timeframe:
* Change of Character (ChoC): Trend reversal confirmed by price breaking the opposite structural level
* Break of Structure (BoS): Continuation confirmed by price breaking the same-direction structural level
* Trade Bias Signals: Price entering key Fibonacci zones (0.382-0.5 for longs in uptrend, 0.5-0.618 for shorts in downtrend, with + and ++ variants for deeper retracements)
* Reversal Warnings: Price entering extreme zones (0.882-1.0 or 0.0-0.118), suggesting potential trend exhaustion and reversal towards the opposite direction
All alerts fire once per bar close with a consolidated message showing which timeframes triggered and what conditions were met.
----------------------------------------------------------------------
Understanding the 3 Timeframes Hierarchy
The three timeframes may be conceived as nested layers of structure:
* 1-Week (Macro Bias) : May help you determine your core directional bias (long/short) in a mid-term perspective. The 1-Week TF may operate as your highest-conviction filter and help you contextualize shorter-term market moves (which may align or misalign with the trend appearing on such a timeframe).
* 1-Day (Swing Structure) : Operates within the weekly range. The daily structure can contradict the weekly structure temporarily (due to retracements, consolidations). This is where you may identify intermediate swing opportunities.
* 1-Hour (Execution Structure) : Operates within the daily range. It may help you identify entry timing and short-term bias. Can show opposite trends during retracements, and some traders look for alignment with higher timeframes as part of their setup criteria.
Example: Weekly uptrend (bullish bias) → Daily pulls back into downtrend (retracement phase) → Hourly shows uptrend resumption (this may be interpreted as an entry signal). All three trends can differ simultaneously, but when all three align (in one direction or another), you may start evaluating your moves.
----------------------------------------------------------------------
Using the Tool effectively
When this indicator signals a potential setup (entering key Fibonacci zones, structure breaks, or bias shifts), treat it as a starting point for deeper analysis, not a direct entry signal.
Before executing, consider using additional tools to refine timing:
Fair Value Gaps (FVG) : Identify imbalances where the price moved too quickly, leaving potential fill zones
Order Blocks : Locate the last opposing candle before a strong move - often institutional entry points
Liquidity Zones : Map where stop losses likely cluster (equal highs/lows, round numbers)
Premium/Discount Confirmation: Verify you're buying at a discount or selling at a premium relative to the current range
Session Timing/Kill Zones : Align entries with high-liquidity sessions (London/New York opens)
This indicator shows you where the structure sits and when it shifts. Your job is to combine that context with precise entry models. The alerts narrow your focus to high-probability zones - then you apply your edge within those zones.
----------------------------------------------------------------------
How to Set Up Alerts
This indicator monitors all three timeframes simultaneously and fires consolidated alerts when any condition triggers. Follow these steps to configure alerts properly:
Step 1: Set Your Chart to the 1-Hour Timeframe
Alerts must be created on the 1-hour chart for optimal timing
Do not use higher timeframes (4H, 1D, 1W) or alerts may be delayed
Lower timeframes (15M, 5M) will work but may generate more frequent notifications
Step 2: Open the Alert Menu
Click the "Alert" button (clock icon) in the top toolbar
Or use keyboard shortcut: Alt+A (Windows) / Option+A (Mac)
Step 3: Configure Alert Settings
Condition: Select "ICT Multi-Timeframe Market Structure Tracker "
Alert Type: Choose "Any alert() function call"
Options: Select "Once Per Bar Close"
Expiration: Set to "Open-ended alert" (no expiration)
Alert Name: Choose a descriptive name (e.g., "BTC Market Structure Alerts")
Step 4: Configure Notifications
Notification Methods: Check your preferred channels (app notification, email, webhook, etc.)
Sound: Optional — choose alert sound if desired
Step 5: Create Alert
Click the "Create" button
Alert is now active and will monitor all three timeframes
Important Notes:
You only need ONE alert setup total — it monitors 1W, 1D, and 1H simultaneously
Alert messages show which timeframe(s) triggered and what conditions were met
Alerts fire once per bar close to avoid mid-bar noise
If you change your structural pivot inputs, the alert continues working with new parameters
Example Alert Message:
BTC Market Structure Alert:
🟢 1D Bullish BoS
📈 1H Long Setup (0.382-0.5)
This tells you the 1-Day broke structure bullishly AND the 1-Hour entered a long setup zone — both events happened on the same bar close.
----------------------------------------------------------------------
Key Features
* Tracks 1-Week, 1-Day, and 1-Hour structure simultaneously
* Automatic Fibonacci retracement calculation (9 levels + extensions up or down, depending on timeframe trend)
* Real-time Change of Character and Break of Structure detection
* Color-coded premium/discount zone visualization
* Multi-condition alerts across all timeframes (single alert setup required)
* Autoscan validation to confirm manual pivot entry accuracy
* Timezone-adjustable for global markets
----------------------------------------------------------------------
Important Notes
* Requires ICT Knowledge: This is not a plug-and-play system. Understanding market structure, liquidity concepts, and Fibonacci confluence is essential for effective use.
* Manual Structure Definition: You define the structural pivots. The indicator tracks and alerts - it doesn't make trading decisions.
* Chart Timeframe: Set alerts on the 1-hour chart for optimal timing across all three monitored timeframes.
----------------------------------------------------------------------
Disclaimer
This indicator is for educational and informational purposes only. It does not constitute financial, investment, or trading advice.
The indicator:
* Makes no guarantees about future market performance
* Cannot predict market movements with certainty
* May generate false indications
* Relies on historical patterns that may not repeat
* Should not be used as the sole basis for trading decisions
Users are responsible for:
* Conducting independent research and analysis
* Understanding the risks of trading
* Making their own investment/divestment decisions
* Managing position sizes and risk exposure appropriately
Trading involves substantial risk and may not be suitable for all investors. Past performance does not guarantee future results. Users should only invest what they can afford to lose and consult qualified professionals before making financial decisions. The indicator’s assumptions may be invalidated by changing market conditions.
By using this tool, users acknowledge these limitations and accept full responsibility for their trading decisions.

Swing Failure Pattern SuvorovIndicator: Logic-based Swing Failure Pattern (SFP)
What is the logic of my indicator based on and what makes it unique:
1. The indicator can calculate extreme candles that close with huge shadows and a small body and it works on any timeframe.
2. The indicator analyzes the volumes on which the desired bar was closed. This function is customizable. That is, you can build a search for signals according to your trading strategy, based on the number of volumes. What does this mean - you select the number of previous bars where the indicator calculates the average value and based on these numbers, you can set up: how many times the desired candle should be larger than the previous average volume.
3. Since SFP is based on the removal of important liquidity, the search for such situations occurs from swing structures (swing high/low). When these parameters are found on the chart (on history), the indicator draws the situation and shows where important liquidity was removed and why the trading situation appeared right now.
4. The indicator gives recommendations on possible takes and stops.
The structure of takes has a built-in logic for searching for previous swings to remove liquidity, as well as searching for imbalances to cover them (50 and 100%).
5. For TP (Take Profit): there are 3 TPthat can be adjusted to your trading strategy (Risk/Profit). For example: you always trade from 2 to 1 on the 1st Take, 3 to 1 on the second, 5 to 1 on the third: you can set all this in the indicator and all your targets will be detected by the indicator, taking into account the logic of searching for important ranges. If, for example, in your 3 to 1 range there are no important zones for TP, then the indicator writes that NaN (not found).
6. The indicator works on any timeframe.
7. The indicator has a built-in RSI logic, which comes as an additional function to the indicator. If this function is enabled, then trading situations are detected only when there is a divergence (from the swing point to the extreme bar that has formed).
ICT 369 Sniper MSS Indicator (HTF Bias) - H2LThis script is an ICT (Inner Circle Trader) concept-based trading indicator designed to identify high-probability reversal or continuation setups, primarily focusing on intraday trading using a Higher Timeframe (HTF) directional bias.
Here are the four core components of the indicator:
Higher Timeframe (HTF) Bias Filter (Market Structure Shift - MSS): It determines the overall trend by checking if the current price has broken the most recent high or low swing point of a larger timeframe (e.g., 4H). This establishes a Bullish or Bearish bias, ensuring trades align with the dominant trend.
Fair Value Gap (FVG) and OTE: It identifies price imbalances (FVGs) and calculates the Optimal Trade Entry (OTE) levels (50%, 62%, 70.5%, etc.) within those gaps, looking for price to retrace into these specific areas.
Kill Zones (Timing): It incorporates specific time windows (London and New York Kill Zones, based on NY Time) where institutional trading activity is high, only allowing entry signals during these defined periods.
Signal and Targets: It triggers a Long or Short signal when all criteria are met (HTF Bias, FVG, OTE retracement, and Kill Zone timing). It then calculates and plots suggested trade levels, including a Stop Loss (SL) and three Take Profit targets (TP1, TP2, and a dynamic Runner Target based on the weekly Average True Range or ATR).
In summary, it's a comprehensive tool for traders following ICT principles, automating the confluence check across trend, structure, liquidity, and timing.

Inversion Fair Value Gap Signals [AlgoAlpha]🟠 OVERVIEW
This script is a custom signal tool called Inversion Fair Value Gap Signals (IFVG) , designed to detect, track, and visualize fair value gaps (FVGs) and their inversions directly on price charts. It identifies bullish and bearish imbalances, monitors when these zones are mitigated or rejected, and extends them until resolution or expiration. What makes this script original is the inclusion of inversion logic—when a gap is filled, the area flips into an opposite "inversion fair value gap," creating potential reversal or continuation zones that give traders additional context beyond classic FVG analysis.
🟠 CONCEPTS
The script builds on the Smart Money Concepts (SMC) principle of fair value gaps, where inefficiencies form when price moves too quickly in one direction. Detection requires a three-bar sequence: a strong up or down move that leaves untraded price between bar highs and lows. To refine reliability, the script adds an ATR-based size filter and prevents overlap between zones. Once created, gaps are tracked in arrays until mitigation (price closing back into the gap), expiration, or transformation into an inversion zone. Inversions act as polarity flips, where bullish gaps become bearish resistance and bearish gaps become bullish support. Lower-timeframe volume data is also displayed inside zones to highlight whether buying or selling pressure dominated during gap creation.
🟠 FEATURES
Automatic detection of bullish and bearish FVGs with ATR-based thresholding.
Inversion logic: mitigated gaps flip into opposite-colored IFVG zones.
Volume text overlay inside each zone showing up vs down volume.
Visual markers (△/▽ for FVG, ▲/▼ for IFVG) when price exits a zone without mitigation.
🟠 USAGE
Apply the indicator to any chart and enable/disable bullish or bearish FVG detection depending on your focus. Use the colored gap zones as areas of interest: bullish gaps suggest possible continuation to the upside until mitigated, while bearish gaps suggest continuation down. When a gap flips into an inversion zone, treat it as potential support/resistance—bullish IFVGs below price may act as demand, while bearish IFVGs above price may act as supply. Watch the embedded up/down volume data to gauge the strength of participants during gap formation. Use the △/▽ and ▲/▼ markers to spot when price rejects gaps or inversions without filling them, which can indicate strong trending momentum. For practical use, combine alerts with your trade plan to track when new gaps form, when old ones are resolved, or when key zones flip into inversions, helping you align entries, targets, or reversals with institutional order flow logic.

Quadro Volume Profile [BigBeluga]🔵 OVERVIEW
The Quadro Volume Profile is a precision-engineered volume profiling tool that segments market activity into four distinct quadrants surrounding the current price. By separating bullish and bearish volume above and below the current price, it helps traders identify dominant forces and high-interest price zones with ease. Each quadrant includes label annotations showing total volume and its share of overall activity — delivering powerful insights into the market’s internal structure.
🔵 CONCEPTS
Four-Quadrant Volume Distribution : Volume is separated into Buy and Sell profiles both above and below the current price.
Directional Volume Logic : Bullish and bearish candle volume is allocated to specific bins, creating color-coded volume stacks.
Dynamic PoC Detection : Point of Control (PoC) levels are calculated per quadrant and optionally displayed.
Lookback-Based Anchoring : The volume histogram is anchored to a fixed lookback window, ensuring consistency and historical context.
Label-Based Analytics : Each quadrant displays a labeled breakdown of direction, total volume, and percentage weight of total activity.
🔵 FEATURES
Four separate volume profiles:
Upper Left: Bearish volume (Sell Quad above price)
Upper Right: Bullish volume (Buy Quad above price)
Lower Left: Bullish volume (Buy Quad below price)
Lower Right: Bearish volume (Sell Quad below price)
Live Labels for Each Quad:
Displays BUY or SELL direction
Shows total volume per quadrant (e.g. 607.49K)
Displays percent share of total quad volume (e.g. 18.87%)
Toggle visibility for each profile and each Point of Control (PoC) dashed PoC lines with volume annotations
Adjustable calculation period (lookBack), number of bins, and horizontal offset
Color gradient intensity represents volume strength per bin
Auto-cleaning visuals to keep the chart uncluttered
Gradient color control for Buy and Sell volumes
Clean midline split between upper and lower quadrants
🔵 HOW TO USE
Select your desired calculation period (default: 200 bars) to define the range for volume analysis.
Adjust the bins parameter for more or less resolution in volume distribution.
Toggle each quadrant on/off depending on your preference using the settings panel:
“Upper Sell Quad” – shows bearish volume above current price (left)
“Upper Buy Quad” – shows bullish volume above current price (right)
“Lower Buy Quad” – shows bullish volume below current price (left)
“Lower Sell Quad” – shows bearish volume below current price (right)
Enable or disable PoC lines for each quad to highlight where volume peaked.
Use the gradient coloring to identify volume imbalances — sharp differences between opposing quads often indicate key zones of rejection or breakout.
Monitor the midline level which splits the four quadrants — it serves as a psychological pivot zone.
🔵 CONCLUSION
The Quadro Volume Profile offers a powerful and visually intuitive way to dissect market activity around price. By splitting volume into four quadrants, traders can better interpret order flow, identify dominant volume zones, and spot potential reversals or continuation setups. Whether you're trading breakouts, liquidity sweeps, or range-bound behavior — this tool adds a structured layer of volume context to your charting workflow.

Bar Statistics - DELTA/OI/TOTAL/BUY/SELL/LONGS/SHORTSBar Statistics - Advanced Volume & Open Interest Analysis
Overview
The Bar Statistics indicator is a comprehensive analytical tool designed to provide traders with detailed insights into market microstructure through advanced volume analysis, open interest tracking, and market flow detection. This indicator transforms complex market data into easily digestible visual information, displaying six key metrics in customizable colored boxes that update in real-time.
Unlike traditional volume indicators that only show basic volume data, this indicator combines multiple data sources to reveal the underlying forces driving price movement, including volume delta calculations from lower timeframes, open interest changes, and estimated market positioning.
What Makes This Indicator Unique
1. Multi-Timeframe Volume Delta Precision
The indicator utilizes lower timeframe data (default 1-second) to calculate highly accurate volume delta measurements, providing much more precise buy/sell pressure analysis than standard timeframe-based calculations. This approach captures intraday volume dynamics that are often missed by conventional indicators.
2. Real-Time Updates
Unlike many indicators that only update on bar completion, this tool provides live updates for the developing candle, allowing traders to see evolving market conditions as they happen.
3. Market Flow Analysis
The unique "L/S" (Long/Short) metric combines open interest changes with price/volume direction to estimate net market positioning, helping identify when participants are accumulating or distributing positions.
4. Adaptive Visual Intensity
The gradient color system automatically adjusts based on historical context, making it easy to identify when current values are significant relative to recent market activity.
5. Complete Customization
Every aspect of the display can be customized, from the order of metrics to individual color schemes, allowing traders to adapt the tool to their specific analysis needs.
6.All In One Solution
6 Metrics in one indicator no more using 5 different indicators.
Core Features Explained
DELTA (Volume Delta)
What it shows: Net difference between aggressive buy volume and aggressive sell volume
Calculation: Uses lower timeframe data to determine whether each trade was initiated by buyers or sellers
Interpretation:
Positive values indicate aggressive buying pressure
Negative values indicate aggressive selling pressure
Magnitude indicates the strength of directional pressure
OI Δ (Open Interest Change)
What it shows: Change in open interest from the previous bar
Data source: Fetches open interest data using the "_OI" symbol suffix
Interpretation:
Positive values indicate new positions entering the market
Negative values indicate positions being closed
Combined with price direction, reveals market participant behavior
L/S (Net Long/Short Bias)
What it shows: Estimated net change in long vs short market positions
Calculation method: Combines open interest changes with price/volume direction using configurable logic
Scenarios analyzed:
New Longs: Rising OI + Rising Price/Volume = Long position accumulation
Liquidated Longs: Falling OI + Falling Price/Volume = Long position exits
New Shorts: Rising OI + Falling Price/Volume = Short position accumulation
Covered Shorts: Falling OI + Rising Price/Volume = Short position exits
Result: Net bias toward long (positive) or short (negative) market sentiment
TOTAL (Total Volume)
What it shows: Standard volume for the current bar
Purpose: Provides context for other metrics and baseline activity measurement
Enhanced display: Uses gradient intensity based on recent volume history
BUY (Estimated Buy Volume)
What it shows: Estimated aggressive buy volume
Calculation: (Total Volume + Delta) / 2
Use case: Helps quantify the actual buying pressure in monetary/contract terms
SELL (Estimated Sell Volume)
What it shows: Estimated aggressive sell volume
Calculation: (Total Volume - Delta) / 2
Use case: Helps quantify the actual selling pressure in monetary/contract terms
Configuration Options
Timeframe Settings
Custom Timeframe Toggle: Enable/disable custom lower timeframe selection
Timeframe Selection: Choose the precision level for volume delta calculations
Auto-Selection Logic: Automatically selects optimal timeframe based on chart timeframe
Net Positions Calculation
Direction Method: Choose between Price-based or Volume Delta-based direction determination
Value Method: Select between Open Interest Change or Volume for position size calculations
Display Customization
Row Order: Completely customize which metrics appear and in what order (6 positions available)
Color Schemes: Individual color selection for positive/negative values of each metric
Gradient Intensity: Configurable lookback period (10-200 bars) for relative intensity calculations
Visual Elements
Box Format: Clean, professional box display with clear labels
Color Coding: Intuitive color schemes with customizable transparency gradients
Real-time Updates: Live updating for developing candles with historical stability
How to Use This Indicator
For Day Traders
Volume Confirmation: Use DELTA to confirm breakout validity - strong directional moves should show corresponding volume delta
Entry Timing: Watch for volume delta divergences at key levels to time entries
Exit Signals: Monitor when aggressive volume shifts against your position
For Swing Traders
Market Flow: Focus on the L/S metric to identify when participants are accumulating or distributing
Open Interest Analysis: Use OI Δ to confirm whether moves are backed by new money or position adjustments
Trend Validation: Combine multiple metrics to validate trend strength and sustainability
For Scalpers
Real-time Edge: Utilize the live updates to see developing imbalances before bar completion
Quick Decision Making: Focus on DELTA and BUY/SELL for immediate market pressure assessment
Volume Profile: Use TOTAL volume context for optimal entry/exit sizing
Setup Recommendations
Futures Markets: Enable OI tracking and use Volume Delta direction method
Crypto Markets: Focus on DELTA and volume metrics; OI may not be available
Stock Markets: Use Price direction method with volume value calculations
High-Frequency Analysis: Set lower timeframe to 1S for maximum precision
Technical Implementation
Data Accuracy
Utilizes TradingView's ta.requestVolumeDelta() function for precise buy/sell classification
Implements error checking for data availability
Handles missing data gracefully with fallback calculations
Performance Optimization
Efficient array management with configurable lookback periods
Smart box creation and deletion to prevent memory issues
Optimized real-time updates without historical data corruption
Compatibility
Works on all timeframes from seconds to daily
Compatible with futures, forex, crypto, and stock markets
Automatically adjusts calculation methods based on available data
Risk Disclaimers
This indicator is designed for educational and analytical purposes. It provides statistical analysis of market data but does not guarantee trading success. Users should:
Combine with other forms of analysis
Practice proper risk management
Understand that past performance doesn't predict future results
Be aware that volume delta and open interest data quality varies by market and data provider
Conclusion
The Bar Statistics indicator represents a significant advancement in retail trader access to professional-grade market analysis tools. By combining multiple data sources into a single, customizable display, it provides the depth of analysis needed for comprehensive market microstructure understanding while maintaining the simplicity required for effective decision-making.

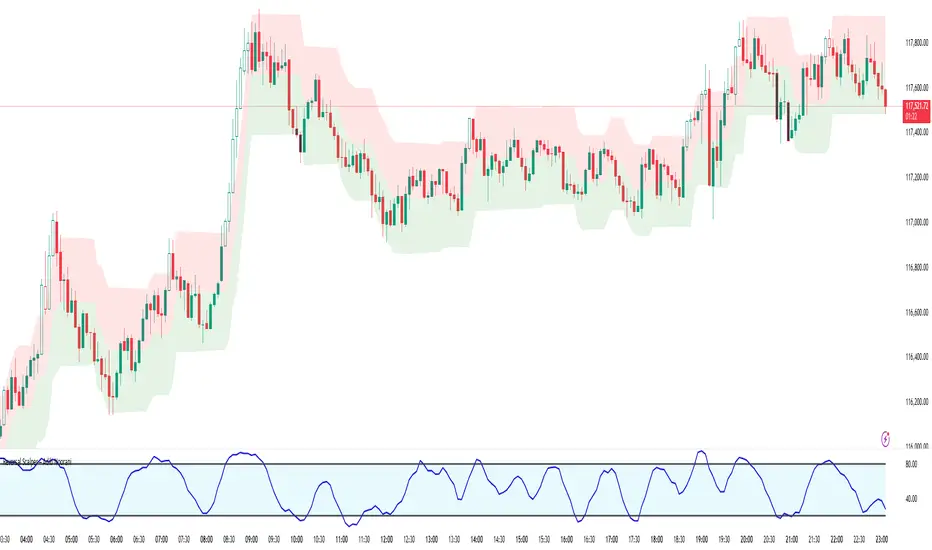
Reversal Scalper – Adib NooraniThe Reversal Scalper is an indicator designed to identify potential reversal zones based on supply and demand dynamics. It uses smoothed stochastic logic along with ATR bands, to reduce noise and highlight areas where momentum may be weakening, signaling possible market turning points.
🔹 Smooth, noise-reduced stochastic oscillator
🔹 Custom zones to highlight potential supply and demand imbalances
🔹 Non-repainting, compatible across all timeframes and assets
🔹 Visual-only tool — intended to support discretionary trading decisions
This oscillator assists scalpers and intraday traders in tracking subtle shifts in momentum, helping them identify when a market may be preparing to reverse — always keeping in mind that trading is based on probabilities, not certainties.
📘 How to Use the Indicator Efficiently
For Reversal Trading:
Buy Setup
– When the blue line dips below the 20 level, wait for it to re-enter above 20.
– Look for reversal candlestick patterns (e.g., bullish engulfing, hammer, or morning star).
– Enter above the pattern’s high, with a stop loss below its low.
Sell Setup
– When the blue line rises above the 80 level, wait for it to re-enter below 80.
– Look for bearish candlestick patterns (e.g., bearish engulfing, inverted hammer, or evening star).
– Enter below the pattern’s low, with a stop loss above its high.
🛡 Risk Management Guidelines
Risk only 0.5% of your capital per trade
Book 50% profits at a 1:1 risk-reward ratio
Trail the remaining 50% using price action or other supporting indicators
ICT Institutional Order Flow (Riz)This indicator implements Inner Circle Trader (ICT) institutional order flow concepts to identify high-probability entry points where smart money is actively participating in the market. It combines volume analysis, market structure, and price action patterns to detect institutional accumulation and distribution zones.
Core Concepts & Methodology
1. Institutional Order Blocks Detection
Order blocks represent the last opposing candle before a strong directional move, indicating institutional accumulation (bullish) or distribution (bearish) zones.
How it works:
⦁ Identifies the final bearish candle before bullish expansion (accumulation)
⦁ Identifies the final bullish candle before bearish expansion (distribution)
⦁ Validates with volume spike (2x average) to confirm institutional participation
⦁ Requires minimum 0.5% price displacement to filter weak moves
⦁ Tracks these zones as future support/resistance levels
2. Fair Value Gap (FVG) Analysis
FVGs are price inefficiencies created by aggressive institutional orders that leave gaps in price action.
Detection method:
⦁ Bullish FVG: When current low > high from 2 bars ago
⦁ Bearish FVG: When current high < low from 2 bars ago
⦁ Minimum gap size filter (0.1% default) eliminates noise
⦁ Monitors gap fills with volume for entry signals
⦁ Gaps act as magnets drawing price back for "rebalancing"
3. Liquidity Hunt Detection
Institutions often trigger retail stop losses before reversing direction, creating liquidity for their positions.
Algorithm:
⦁ Calculates rolling 20-period highs/lows as liquidity pools
⦁ Detects wicks beyond these levels (0.1% sensitivity)
⦁ Identifies rejection back inside range (liquidity grab)
⦁ Volume spike confirmation ensures institutional involvement
⦁ These reversals often mark significant turning points
4. Volume Profile Integration
Analyzes volume distribution across price levels to identify institutional interest zones.
Components:
⦁ Point of Control (POC): Price level with highest volume (institutional consensus)
⦁ Value Area: 70% of volume range (institutional comfort zone)
⦁ Uses 50-bar lookback to build volume histogram
⦁ 20 price levels for granular distribution analysis
5. Market Structure Analysis
Determines overall trend bias using pivot points and swing analysis.
Process:
⦁ Identifies swing highs/lows using 3-bar pivots
⦁ Bullish structure: Price above last swing high
⦁ Bearish structure: Price below last swing high
⦁ Filters signals to trade with institutional direction
Signal Generation Logic
BUY signals trigger when ANY condition is met:
1. Order Block Formation: Bearish-to-bullish transition + volume spike + strong move
2. Liquidity Grab Reversal: Sweep below lows + recovery + volume spike
3. FVG Fill: Price fills bullish gap with institutional volume (within 3 bars)
4. Order Block Respect: Price bounces from previous bullish OB + volume
SELL signals trigger when ANY condition is met:
1. Order Block Formation: Bullish-to-bearish transition + volume spike + strong move
2. Liquidity Grab Reversal: Sweep above highs + rejection + volume spike
3. FVG Fill: Price fills bearish gap with institutional volume (within 3 bars)
4. Order Block Respect: Price rejects from previous bearish OB + volume
Additional filters:
⦁ Signals align with market structure (no counter-trend trades)
⦁ No new signals while position is active
⦁ All signals require volume confirmation (institutional fingerprint)
Trading Style Auto-Configuration
The indicator features intelligent preset configurations for different trading styles:
Scalping Mode (1-5 min charts):
⦁ Volume multiplier: 1.5x (more signals)
⦁ Tighter parameters for quick trades
⦁ Risk:Reward 1.5:1, ATR multiplier 1.0
Day Trading Mode (15-30 min charts):
⦁ Volume multiplier: 1.7x (balanced)
⦁ Medium sensitivity settings
⦁ Risk:Reward 2:1, ATR multiplier 1.5
Swing Trading Mode (1H-4H charts):
⦁ Volume multiplier: 2.0x (quality focus)
⦁ Conservative parameters
⦁ Risk:Reward 3:1, ATR multiplier 2.0
Custom Mode:
⦁ Full manual control of all parameters
Visual Components
⦁ Order Blocks: Colored rectangles (green=bullish, red=bearish)
⦁ Fair Value Gaps: Orange boxes showing imbalances
⦁ Liquidity Levels: Dashed blue lines at key highs/lows
⦁ Volume Spikes: Yellow background highlighting
⦁ POC Line: Orange line showing highest volume price
⦁ Value Area: Blue shaded zone of 70% volume
⦁ Buy/Sell Signals: Triangle markers with text labels
⦁ Stop Loss/Take Profit: Dotted lines (red/green)
Information Panel
Real-time dashboard displaying:
⦁ Current trading mode
⦁ Volume ratio (current vs average)
⦁ Market structure (bullish/bearish)
⦁ Active order blocks count
⦁ Position status
⦁ Configuration details
How to Use
Step 1: Select Trading Style
Choose your style in settings - all parameters auto-adjust
Step 2: Timeframe Selection
⦁ Scalping: 1-5 minute charts
⦁ Day Trading: 15-30 minute charts
⦁ Swing: 1H-4H charts
Step 3: Signal Interpretation
⦁ Wait for BUY/SELL markers
⦁ Check volume ratio >2 for strong signals
⦁ Verify market structure alignment
⦁ Note automatic SL/TP levels
Step 4: Risk Management
⦁ Default 2:1 risk:reward (adjustable)
⦁ Stop loss: 1.5x ATR from entry
⦁ Position sizing based on stop distance
Best Practices
1. Higher probability setups occur when multiple conditions align
2. Volume confirmation is crucial - avoid signals without volume spikes
3. Trade with structure - longs in bullish, shorts in bearish structure
4. Monitor POC - acts as dynamic support/resistance
5. Confluence zones where OBs, FVGs, and liquidity levels overlap are strongest
Important Notes
⦁ Not a standalone system - combine with your analysis
⦁ Works best in trending markets with clear structure
⦁ Adjust settings based on instrument volatility
⦁ Backtest thoroughly on your specific markets
⦁ Past performance doesn't guarantee future results
Alerts Available
⦁ ICT Buy Signal
⦁ ICT Sell Signal
⦁ Volume Spike Detection
⦁ Liquidity Grab Detection
This indicator provides a systematic approach to ICT concepts, helping traders identify where institutions are entering positions through volume analysis and key price action patterns. The auto-configuration feature ensures optimal settings for your trading style without manual adjustment.
Disclaimer
This tool is for educational and research purposes only. It is not financial advice, nor does it guarantee profitability. All trading involves risk, and users should test thoroughly before applying live.

Precision Fair Value Gap (FVG)This indicator scans historical price action to automatically detect unmitigated Fair Value Gaps (FVGs) with precision.
It highlights bullish and bearish gaps that remain open until price fills them, helping traders spot key liquidity imbalances used in Smart Money Concepts (SMC).
🔹 Features
Detects both bullish and bearish FVGs.
Auto-removes mitigated gaps once price returns to fill them.
Configurable gap size, line weight, and colors.
Optimized for performance with capped lookback and line control.
Works on all timeframes and markets.
Perfect for traders who rely on price action and institutional order flow to refine entries, exits, and confluence zones.

Crypto OI AgregatedCrypto OI Aggregated — Open Interest Aggregator for Crypto Exchanges
General Description
The indicator is designed for comprehensive analysis of Open Interest (OI) across major cryptocurrency exchanges. It consolidates data from multiple platforms, visualizes it as candlestick charts or deltas, and builds tables with breakdowns by exchange and contract type. This allows traders to quickly understand where market interest is concentrated and how the market structure is shifting.
Unlike standard tools that only show data from a single exchange, this indicator provides a full market overview and makes it easy to compare dynamics across different platforms.
⸻
Key Features
• Aggregation of OI data from exchanges: Binance, Bybit, OKX, Bitget, Kraken, HTX, Deribit (feel free to leave a comment if you’d like me to add other exchanges that provide open interest data)
• Support for contract types: USDT.P, USD.P, USDC.P, USD.PM
• Automatic normalization of various OI data formats from different providers
• Display modes:
• OI candlestick chart (total aggregated OI)
• OI Delta (change in OI per bar)
• Full table with detailed data by exchange and contract type
• Short summary table with totals in USD and base assets
• Support for USD or COIN denomination
• Convenient formatting for large numbers
• Customizable colors
⸻
How to Use the Indicator
1. Select Exchanges
In the settings, enable or disable specific exchanges. It is recommended to activate only the ones you need for analysis — this will make the indicator faster.
2. Choose Data Type
• OI — aggregated open interest from selected exchanges.
• OI delta — delta (change in OI compared to the previous bar).
3. Denomination
• USD — values are converted into USD equivalents.
• COIN — values are shown in the base asset (BTC, ETH, etc.).
4. Reading the Chart
• OI candlesticks show the overall OI dynamics.
• Delta histogram highlights how much OI has grown or decreased per bar.
• Colors are fully customizable.
5. Tables
• Enabled via the Show table option.
• Full Table → Rows = exchanges, Columns = contract types. Cells contain OI values in either USD or the base asset, depending on settings. Quickly shows where the main interest is concentrated.
• Short Table → Displays only the total OI values in USD and the base asset.
⸻
Important Notes
• For better readability of large values, two custom formatting functions were implemented. They work similarly to format.volume, but with improved digit grouping and adjustable decimal precision. In the tables, the top row is formatted using format.volume, while the bottom row uses the improved formatting functions for clearer representation.
str(d, n, s) =>
str.substring(d, 0, str.length(d) - n) + '.' + str.substring(d, str.length(d) - n, str.length(d) - (n - 2)) + s
format(_r) =>
d = str.tostring(math.round(_r))
str.length(d) > 9 ? str(d, 9, " B") : str.length(d) > 6 ? str(d, 6, " M") : str.length(d) > 3 ? str(d, 3, " K") : d
⸻
Conclusion: Crypto OI Aggregated is a convenient and powerful tool for cryptocurrency derivatives traders. It enables tracking of OI dynamics across multiple exchanges simultaneously, detecting imbalances between contracts, and identifying signals that are not visible when analyzing a single exchange.

High Probability Order Blocks [AlgoAlpha]🟠 OVERVIEW
This script detects and visualizes high-probability order blocks by combining a volatility-based z-score trigger with a statistical survival model inspired by Kaplan-Meier estimation. It builds and manages bullish and bearish order blocks dynamically on the chart, displays live survival probabilities per block, and plots optional rejection signals. What makes this tool unique is its use of historical mitigation behavior to estimate and plot how likely each zone is to persist, offering traders a probabilistic perspective on order block strength—something rarely seen in retail indicators.
🟠 CONCEPTS
Order blocks are regions of strong institutional interest, often marked by large imbalances between buying and selling. This script identifies those areas using z-score thresholds on directional distance (up or down candles), detecting statistically significant moves that signal potential smart money footprints. A bullish block is drawn when a strong up-move (zUp > 4) follows a down candle, and vice versa for bearish blocks. Over time, each block is evaluated: if price “mitigates” it (i.e., closes cleanly past the opposite side and confirmed with a 1 bar delay), it’s considered resolved and logged. These resolved blocks then inform a Kaplan-Meier-like survival curve, estimating the likelihood that future blocks of a given age will remain unbroken. The indicator then draws a probability curve for each side (bull/bear), updating it in real time.
🟠 FEATURES
Live label inside each block showing survival probability or “N.E.D.” if insufficient data.
Kaplan-Meier survival curves drawn directly on the chart to show estimated strength decay.
Rejection markers (▲ ▼) if price bounces cleanly off an active order block.
Alerts for zone creation and rejection signals, supporting rule-based trading workflows.
🟠 USAGE
Read the label inside each block for Age | Survival% (or N.E.D. if there aren’t enough samples yet); higher survival % suggests blocks of that age have historically lasted longer.
Use the right-side survival curves to gauge how probability decays with age for bull vs bear blocks, and align entries with the side showing stronger survival at current age.
Treat ▲ (bullish rejection) and ▼ (bearish rejection) as optional confluence when price tests a boundary and fails to break.
Turn on alerts for “Bullish Zone Created,” “Bearish Zone Created,” and rejection signals so you don’t need to watch constantly.
If your chart gets crowded, enable Prevent Overlap ; tune Max Box Age to your timeframe; and adjust KM Training Window / Minimum Samples to trade off responsiveness vs stability.

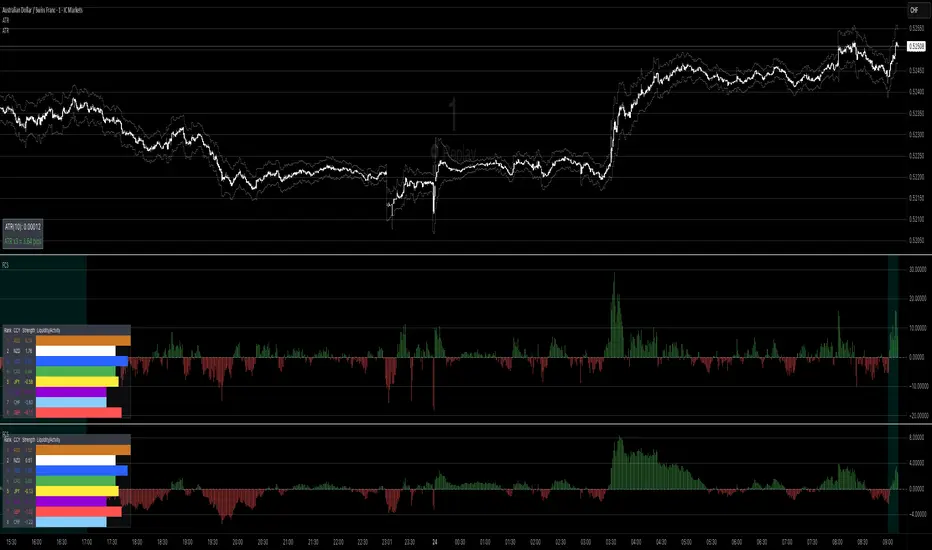
Forex Currency Strength What this indicator does
It compares the relative strength of the 8 major currencies (USD, EUR, GBP, JPY, AUD, CAD, NZD, CHF) by looking at all 28 currency pairs. Each currency is smoothed (averaged) with a moving average to reduce noise.
From this it shows:
• Currency strength lines → how each major currency is performing over time (optional view).
• Pair divergence histogram → the difference in strength between the two currencies of the chart pair (e.g. EUR vs USD on an EURUSD chart). Green means the base currency is stronger, red means the quote currency is stronger.
• Ranking table → shows the strongest to weakest currency at the current moment. The strongest is highlighted green, the weakest red.
• Session highlighting → shows your chosen trading session on the chart (background shading, optional vertical line at the session start).
• Alerts → you can set TradingView alerts when:
• the pair divergence crosses above or below zero
• the divergence strength gets big enough (above your threshold)
• the difference between the strongest and weakest currency becomes large
⸻
👉 In plain words:
This indicator helps you quickly see which currencies are strong, which are weak, and whether the pair you are trading has a clear directional bias. It also highlights trading sessions and can notify you when strong moves or imbalances appear.
// ─────────────────────────────────────────────────────────────
// Forex Currency Strength (8 Majors, %R) + Divergence + Ranking
// ─────────────────────────────────────────────────────────────
//
// === Inputs ===
//
// exchPrefix → Broker/feed prefix (e.g. "OANDA:", "FX:", or "" for ICMarkets)
// tf → Data timeframe (empty = chart timeframe)
// smoothLen → Smoothing length (MA) for currency strength (default = 14)
// smoothMethod → MA method (SMA, EMA, WMA, DEMA)
// viewMode → Display mode: "Strength Lines", "Pair Divergence", "Both"
// (Tip: set to "Pair Divergence" to hide lines by default)
// barsLimit → Number of bars to display
//
// sessionStr → Trading session time (e.g. "0800-1700"); session is highlighted on chart
//
// alertDivAbs → Threshold for alerts on |divergence|
// alertGapTF → Threshold for alerts on Top–Flop ranking gap
//
// scaleK → Scaling factor (here ×1000)
//
// rankPos → Position of the ranking table (top/bottom left/right)
// rankTextSize → Font size for the ranking table (tiny, small, normal, large, huge)
//
// === Outputs ===
//
// • 8 currency strength lines (optionally visible)
// • Divergence (current pair) as histogram
// • Ranking table (top & flop highlighted)
// • Session highlighting (background color + optional vertical line)
// • Alerts on divergence crosses, |divergence| thresholds & top–flop gaps
//
// === Alert Conditions ===
//
// longDivCross → Divergence (current pair) crosses above 0
// shortDivCross → Divergence (current pair) crosses below 0
// divAbsUp → |Divergence| exceeds alertDivAbs threshold
// gapUp → Top–Flop ranking gap exceeds alertGapTF threshold
//
// ─────────────────────────────────────────────────────────────
STOCK SCHOOL | FVGThe Stock School FVG Indicator is designed to help traders identify and trade Fair Value Gaps (FVGs) and Inverse FVGs (IFVGs) with precision.
Built for both intraday and swing traders, this tool highlights high-probability trading zones where institutions leave imbalances in the market.
✨ Key Features:
Auto-detects FVGs & IFVGs in real-time
Works on all timeframes and instruments (Nifty, BankNifty, Stocks, Forex, Crypto)
Non-repainting logic for reliable signals
Clean and easy-to-use interface with Stock School styling
Perfect for Smart Money Concept (SMC) traders
🚀 With this indicator, you can:
Spot institutional footprints quickly
Combine with BOS, CHoCH, Order Blocks for high accuracy
Trade liquidity sweeps + FVG collisions with confidence
💡 Disclaimer:
This indicator is for educational purposes only. Trading involves risk. Always use proper risk management.

NWOG/NDOG by OutOfOptionsNew Week Opening Gap (NWOG) and New Day Opening Gap (NDOG)
NWOG and NDOG represent price imbalances formed when markets skip over certain levels at the start of a new week or trading day. These gaps often serve as magnets for price action throughout the week or day, drawing prices back to fill them while also functioning as key support or resistance zones. They are particularly relevant in futures markets, though less so in equities.
Consequent Encroachment (CE)
The CE, which is the midpoint of an NWOG or NDOG, frequently emerges as a critical level—especially if the gap remains unbalanced. In such cases, it can exert a strong pull on price, encouraging retracement or consolidation.
Indicator Features
This indicator allows you to display any number of NWOGs and NDOGs directly on your chart, with complete customization of their visual appearance. You can assign distinct colors to the most recent gaps for easy identification. Unlike other tools, it includes a filtering option to exclude minor gaps that may lack significance. Additionally, the "Smart" mode intelligently positions price labels to ensure they remain visible and uncluttered at all times.
How Does it Work
The indicator tracks all daily closes and new day opens, capturing the two values representing the top/bottom of NDOG/NWOG. I If the day begins on a Sunday, the gap is identified as NWOG; otherwise, it is classified as NDOG. A key feature of the indicator is that it avoids duplicating NDOGs that are also NWOGs.
Next, the indicator applies the size filter setting (if set above 0) to skip minor gaps. Valid gaps are then displayed on the screen using a style configured in the indicator settings for the most recent NDOG/NWOG.
To prevent the chart from becoming cluttered, the indicator limits the number of NWOG/NDOGs shown. When a new NWOG/NDOG is added, it checks the total displayed, and if this exceeds the configured limit, the oldest NWOG/NDOG is removed. Additionally, the indicator updates the display style of the previous NWOG/NDOG to the generic (non-last) style as specified in the settings.
For labels showing NWOG/NDOG price ranges and CE, the indicator offers a "Smart" option that dynamically positions labels 10 bars from the last candle and adjusts them every 5 candles. Otherwise, labels are placed at the end of the week for NWOGs and at the end of the following day for NDOGs.

Rolling VWAP 7-30-907, 30, and 90-day VWAP (Volume Weighted Average Price) indicator on TradingView provides traders with multiple perspectives on market sentiment and price efficiency across short, medium, and long-term horizons. The 7-day VWAP is particularly useful for active traders or intraday participants who want to gauge near-term value and liquidity. It highlights short-term imbalances, helping to identify overbought or oversold conditions relative to recent trading activity. Meanwhile, the 30-day VWAP smooths out shorter-term noise, offering a more balanced benchmark that swing traders often use to spot trend alignment or potential reversals within a monthly cycle.
The 90-day VWAP serves as a longer-term institutional benchmark, reflecting deeper capital flows and market consensus over a quarter. It’s particularly valuable for position traders or those tracking whether price is consistently trading above or below this broader measure of value, which can indicate long-term accumulation or distribution phases. Using all three together provides a layered framework: the 7-day VWAP for tactical entries, the 30-day VWAP for swing positioning, and the 90-day VWAP for strategic trend confirmation. This multi-timeframe approach allows traders to align short-term signals with medium and long-term market structure, improving precision and conviction in decision-making.
Prof Satoshi

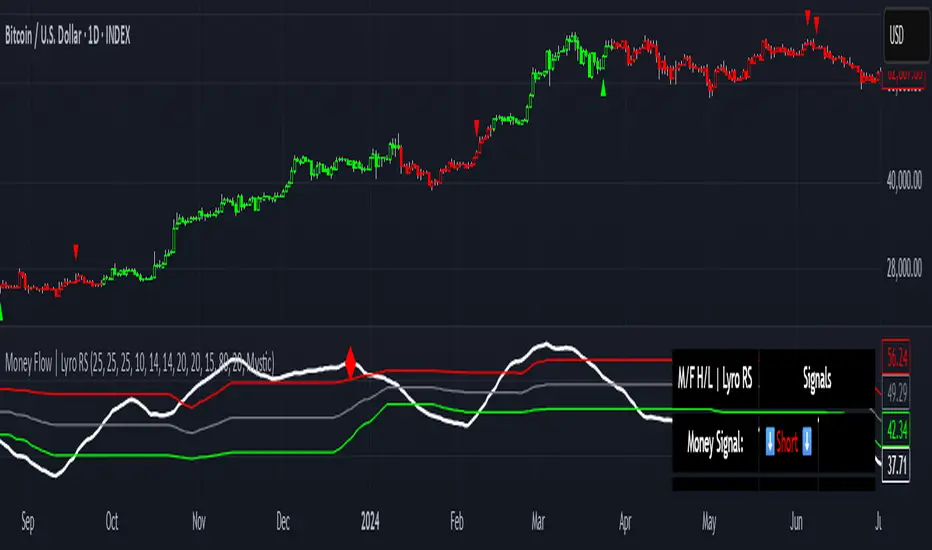
Money Flow | Lyro RSMoney Flow | Lyro RS
The Money Flow is a momentum and volume-driven oscillator designed to highlight market strength, exhaustion, and potential reversal points. By combining smoothed Money Flow Index readings with volatility, momentum, and RVI-based logic, it offers traders a deeper perspective on money inflow/outflow, divergences, and overbought/oversold dynamics.
Key Features
Smoothed Money Flow Line
EMA-smoothed calculation of the MFI for noise reduction.
Clear thresholds for overbought and oversold zones.
Normalized Histogram
Histogram plots show bullish/bearish money flow pressure.
Color-coded cross logic for quick trend assessment.
Relative Volatility Index (RVI) Signals
Detects overbought and oversold conditions using volatility-adjusted RVI.
Plots ▲ and ▼ markers at exhaustion points.
Momentum Strength Gauge
Calculates normalized momentum strength from ROC and volume activity.
Displays percentage scale of current momentum force.
Divergence Detection
Bullish divergence: Price makes lower lows while money flow makes higher lows.
Bearish divergence: Price makes higher highs while money flow makes lower highs.
Plotted as diamond markers on the oscillator.
Signal Dashboard (Table Overlay)
Displays real-time status of Money Flow signals, volatility, and momentum.
Color-coded readouts for instant clarity (Long/Short/Neutral + Momentum Bias).
How It Works
Money Flow Calculation – Applies EMA smoothing to MFI values.
Normalization – Scales oscillator between relative high/low values.
Trend & Signals – Generates bullish/bearish signals based on midline and histogram cross logic.
RVI Integration – Confirms momentum exhaustion with overbought/oversold markers.
Divergences – Identifies hidden market imbalances between price and money flow.
Practical Use
Trend Confirmation – Use midline crossovers with histogram direction for money flow bias.
Overbought/Oversold Reversals – Watch RVI ▲/▼ markers for exhaustion setups.
Momentum Tracking – Monitor momentum percentage to gauge strength of current trend.
Divergence Alerts – Spot early reversal opportunities when money flow diverges from price action.
Customization
Adjust length, smoothing, and thresholds for different markets.
Enable/disable divergence detection as needed.
Personalize visuals and dashboard display for cleaner charts.
⚠️ Disclaimer
This indicator is a tool for technical analysis and does not provide guaranteed results. It should be used alongside other methods and proper risk management. The creator is not responsible for financial decisions made using this script.
SMC Suite - OB . Breaker . Liquidity Sweep . FVGSMC Suite — Order Blocks • Breaker • Liquidity Sweep • FVG
What it does:
Maps institutional SMC structure (OB → Breaker flips, Liquidity Sweeps, and 3-bar FVGs) and alerts when price retests those zones with optional r ejection-wick confirmation .
Why this isn’t “just a mashup”?
This tool implements a specific interaction between four classic SMC concepts instead of only plotting them side-by-side:
1. OB → Breaker Flip (automated): When price invalidates an Order Block (OB), the script converts that zone into a Breaker of opposite bias (bullish ⇄ bearish), extends it, and uses it for retest signals.
2. Liquidity-Gated FVGs : Fair Value Gaps (3-bar imbalances) are optionally gated—they’re only drawn/used if a recent liquidity sweep occurred within a user-defined lookback.
3. Retest Engine with Rejection Filter : Entries are not whenever a zone prints. Signals fire only if price retests the zone, and (optionally) the candle shows a rejection wick ≥ X% of its range.
4. Signal Cooldown : Prevents spam by enforcing a minimum bar gap between consecutive signals.
These behaviors work together to catch the sequence many traders look for: sweep → impulse → OB/FVG → retest + rejection.
Concepts & exact rules
1) Impulsive move and swing structure
• A bar is “ impulsive ” when its range ≥ ATR × Impulsive Mult and it closes in the direction of the move.
• Swings use Pivot Length (lenSwing) on both sides (HH/LL detection). These HH/LLs are also used for sweep checks.
2) Order Blocks (OB)
• Bullish OB : last bearish candle body before an i mpulsive up-move that breaks the prior swing high . Zone = min(open, close) to low of that candle.
• Bearish OB : last bullish candle body before an impulsive down-move that breaks the prior swing low . Zone = high to max(open, close).
• Zones extend right for OB Forward Extend bars.
3) Breaker Blocks (automatic flip)
If price invalidates an OB (closes below a bullish OB’s low or above a bearish OB’s high), that OB flips into a Breaker of opposite bias:
• Invalidated bullish OB → Bearish Breaker (resistance).
• Invalidated bearish OB → Bullish Breaker (support).
Breakers get their own style/opacity and are used for separate Breaker Retest signals.
4) Liquidity Sweeps (decluttered)
• Bullish sweep : price takes prior high but closes back below it.
• Bearish sweep : price takes prior low but closes back above it.
Display can be tiny arrows (default), short non-extending lines, or hidden. Old marks auto-expire to keep the chart clean.
5) Fair Value Gaps (FVG, 3-bar)
• Bearish FVG : high < low and current high < low .
• Bullish FVG : low > high and current low > high .
• Optional gating: only create/use FVGs if a sweep occurred within ‘Recent sweep’ lookback.
6) Retest signals (what actually alerts)
A signal is true when price re-enters a zone and (optionally) the candle shows a rejection wick:
• OB Retest LONG/SHORT — same-direction retest of OB.
• Breaker LONG/SHORT — opposite-direction retest of flipped breaker.
• FVG LONG/SHORT — touch/fill of FVG with rejection.
You can require a wick ratio (e.g., bottom wick ≥ 60% of range for longs; top wick for shorts). A cooldown prevents back-to-back alerts.
How to use
1. Pick timeframe/market : Works on any symbol/TF. Many use 15m–4h intraday and 1D swing.
2. *Tune Pivot Length & Impulsive Mult:
• Smaller = more zones and quicker flips; larger = fewer but stronger.
3. Decide whether to gate FVGs with sweeps : Turn on “Require prior Liquidity Sweep” to focus on post-liquidity setups.
4. Set wick filter : Start with 0.6 (60%) for cleaner signals; lower it if too strict.
5. Style : Use the Style / Zones & Style / Breakers groups to set colors & opacity for OB, Breakers, FVGs.
6. Alerts : Add alerts on any of:
• OB Retest LONG/SHORT
• Breaker LONG/SHORT
• FVG LONG/SHORT
Choose “Once per bar close” to avoid intrabar noise.
Inputs (key)
• Swing Pivot Length — swing sensitivity for HH/LL and sweeps.
• Impulsive Move (ATR ×) — defines the impulse that validates OBs.
• OB/FVG Forward Extend — how long zones project.
• Require prior Liquidity Sweep — gate FVG creation/usage.
• Rejection Wick ≥ % — confirmation filter for retests.
• Signal Cooldown (bars) — throttles repeated alerts.
• Display options for sweep marks — arrows vs short lines vs hidden.
• Full color/opacity controls — independent palettes for OB, Breakers, and FVGs (fills & borders).
What’s original here
• Automatic OB → Breaker conversion with separate retest logic.
• Liquidity-conditioned FVGs (FVGs can be required to follow a recent sweep).
• Unified retest engine with wick-ratio confirmation + cooldown.
• Decluttered liquidity visualization (caps, expiry, and non-extending lines).
• Complete styling controls for zone types (fills & borders), plus matching signal label colors.
🔹 Notes
• This script is invite-only.
• It is designed for educational and discretionary trading use, not as an autotrader.
• No performance guarantees are implied — always test on multiple markets and timeframes.

S&R ZonesThis indicator automatically detects swing highs and swing lows on the chart using a 3-bar swing structure. Once a swing point is confirmed, it evaluates the price movement and body size of subsequent candles. If the movement meets a volume-based range condition (2.5× the average body size of the last 5 candles), the indicator creates a zone around that swing.
Swing High Zones: Drawn from the highest price of the swing cluster down to its midpoint.
Swing Low Zones: Drawn from the lowest price of the swing cluster up to its midpoint.
These zones act as dynamic support and resistance levels and remain on the chart until they are either:
Broken (price closes beyond the zone), or
Expired (more than 200 bars old).
Zones are color-coded for clarity:
🔴 Red shaded areas = Swing High resistance zones.
🟢 Green shaded areas = Swing Low support zones.
This makes the indicator useful for identifying high-probability reversal areas, liquidity zones, and supply/demand imbalances that persist until invalidated.

High Time Frame FVG [TakingProphets]HTF FVG
The HTF FVG indicator is built for traders who want a clean, multi-timeframe view of Fair Value Gaps (FVGs) without manually flipping charts. It automatically detects unmitigated FVGs across up to five higher timeframes and overlays them directly on your active chart, keeping your execution bias aligned with higher-timeframe liquidity.
✨ What it does
📌 Multi-timeframe mapping – Detects and plots bullish/bearish FVGs across up to 5 custom HTFs + your current chart.
🧩 Auto-labeling – Each gap is tagged with its originating timeframe (e.g., M5, H1, D1).
🔄 Live updates – FVGs extend forward in time and are automatically removed once mitigated based on your plan.
🟢 Inverse FVGs (optional) – Highlight “inverse gaps” for traders who utilize them in reversal models.
🎯 Consequent Encroachment lines – Enable mid-gap CE levels for precision-based trade management.
⚡ Optimized performance – Built with array management, capped lookback periods, and per-timeframe limits for smooth charting.
🛠️ How it works
Fair Value Gaps are detected using a 3-candle structure:
Bullish FVG → the high of two candles ago is below the low of the prior candle.
Bearish FVG → the low of two candles ago is above the high of the prior candle.
For each selected timeframe:
When an FVG forms, a box is drawn from the gap boundaries and extended forward by a configurable number of bars.
If price closes into the gap on its originating timeframe, the box is automatically removed.
If Consequent Encroachment is enabled, a mid-gap line is plotted for refined targeting.
When multiple gaps exist per side, only the closest unmitigated one remains highlighted for clarity.
⚙️ Inputs & customization
Detection Sensitivity → High / Medium / Low
Lookback Period → 1 Day / 1 Week / 1 Month / Max
Extend Gaps → Add extra forward bars beyond the originating candle.
Show Consequent Encroachment → Toggle CE midlines on/off.
Show Inverse FVGs → Mark inverted gaps for advanced models.
Custom HTFs → Choose up to 5 timeframes to map onto your execution chart.
Appearance Settings → Configure colors, transparency, label size, and gap boundary styles.
📈 Practical tips
Use smaller execution timeframes (e.g., 1m–5m) and overlay multiple HTFs (e.g., M15, H1, H4, D1).
Watch for stacked HTF FVGs in the same price zone — these often create higher-probability draw areas.
Pair CE midlines with session timing, PD arrays, and liquidity concepts to refine entries.
Limit your lookback period and max stored FVGs for better performance during volatile sessions.
📌 Notes
This tool does not generate buy/sell signals. It’s a context mapping utility to help align your trading plan with higher-timeframe structure.
Weekend gaps are automatically filtered out to reduce false positives.
🏷️ Credits & disclaimer
Concepts: ICT / Smart Money methodologies around imbalances and liquidity gaps.
Disclaimer: This script is for educational purposes only and should not be considered financial advice. Always test on demo and trade your own plan.
