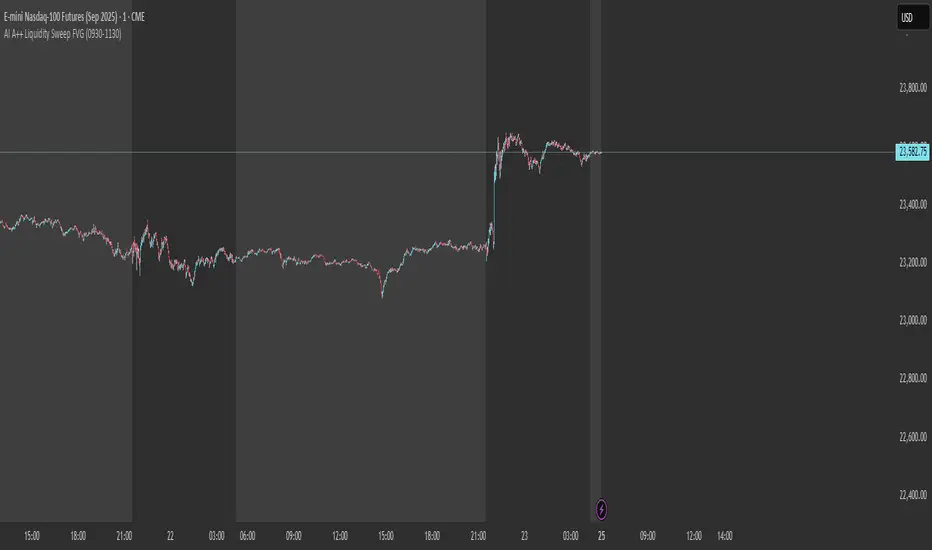
AI A++ Liquidity Sweep FVGThat is a critical question. For the "AI A++ Liqu-idity Sweep FVG" indicator to work exactly as designed, you must have your chart set to the:
1-Minute (1m) Timeframe
The Reason:
The logic of the script is built to analyze the very specific, rapid price action that occurs in the first few minutes of the New York session open.
FVG Detection: A Fair Value Gap is a three-candle pattern. On the 1-minute chart, this allows us to see the rapid imbalances created by the opening burst of volume. On a higher timeframe like the 5-minute or 15-minute, these subtle but powerful gaps would be smoothed over and might not even be visible.
Liquidity Sweep Precision: The script is looking for a quick "stop hunt" that pierces the pre-market high or low and then immediately reverses. This action is most clearly and accurately seen on the 1-minute chart.
Using any other timeframe will cause the indicator to analyze the market incorrectly and either miss valid setups or provide false signals.
So, to confirm your setup for Monday morning:
Instrument: MNQ (Micro E-mini Nasdaq-100 Futures)
Timeframe: 1-Minute
Indicator: "AI A++ Liquidity Sweep FVG" active on the chart.
Alert: Alert set up for the indicator.
You are now perfectly set up to catch the exact A++ setup we are waiting for.
Search in scripts for "imbalance"
Smart Money SignalsSmart Money Signals – Market Flow & Structure Visualizer
Overview
Smart Money Signals is a precision trading tool designed for traders who want to see market structure and momentum flow in real time. By detecting pivots, momentum imbalances, and dynamic support/resistance levels, the indicator transforms raw price action into a clear visual narrative of where capital is entering and exiting the market.
Instead of lagging averages or cluttered signals, Smart Money Signals highlights the moments that matter most—where bullish and bearish flows are confirmed, where support or resistance breaks, and where momentum zones show the true battleground between buyers and sellers. Its adaptive design makes it equally effective for scalpers seeking sharp entries, swing traders tracking reversals, and longer-term traders looking for confirmation of bias.
How It Works
The engine behind Smart Money Signals relies on swing detection and a configurable sensitivity filter. By monitoring directional momentum across recent bars, the system identifies bullish pivots (where downside exhaustion flips into strength) and bearish pivots (where upward thrust collapses into weakness).
When price confirms a pivot, the indicator draws flow lines to mark the breakout and labels them as either continuation or reversal events, depending on existing market bias. Momentum zones are automatically plotted, highlighting the critical areas where buyers defended price or sellers pressed it lower.
Dynamic support and resistance levels extend forward in time, updating live as price develops. These zones change color when broken, visually signaling whether structure has held or failed. Gradient background shading further emphasizes moments of extreme momentum, such as overbought or oversold surges, so that traders instantly see when market pressure intensifies.
Signals and Market Flows
Smart Money Signals provides visual cues that are both intuitive and actionable:
📈 Bullish Flow Signals appear when price breaks above a confirmed pivot, signaling continuation or reversal into strength.
📉 Bearish Flow Signals appear when price breaks below a confirmed pivot, indicating continuation or reversal into weakness.
Momentum Zones highlight the defended areas between pivots, giving traders a visual map of where structure is strongest.
Dynamic Support & Resistance lines extend across the chart, shifting from defense to failure when broken, ensuring that the most relevant levels are always visible.
Break Signals mark the exact bar where key levels give way, confirming structural violations in real time.
By filtering out noise and focusing on meaningful flow events, the system helps traders avoid overreaction and focus only on high-probability structural shifts.
Strategy Integration
Smart Money Signals is versatile across trading styles:
Trend Continuation : Enter in the direction of flow signals, using dynamic zones as both confirmation and stop-loss placement.
Reversal Trading : Watch for pivots tagged as reversal points, where market bias flips and new structure is created.
Momentum Zone Entries : Use the automatically drawn zones to identify low-risk entries on pullbacks or retests.
Bias Alignment : The integrated dashboard reveals the current market bias—bullish, bearish, or neutral—helping traders stay aligned with the dominant flow.
Stop-losses can be positioned beyond the dynamic zone on the opposite side, while take-profits may be guided by the width of zones or momentum-driven extensions. On higher timeframes, the indicator provides context for macro structure, while lower timeframes allow for tactical entry refinement.
Advanced Techniques
Traders seeking deeper precision can combine Smart Money Signals with volume or order flow tools to validate pivots and zone defenses. Monitoring the sequence of bullish and bearish flows helps identify trend maturity, while analyzing the success rate of pivots in the analytics panel builds a data-driven approach to confidence in signals.
Adjusting swing period and sensitivity allows the indicator to adapt to different market conditions, from volatile crypto pairs to steady forex majors. The flexible visual themes—Cyber, Ocean, Sunset, Matrix—ensure readability across setups, while gradient shading keeps the chart intuitive even under fast-moving conditions.
Why Use Smart Money Signals
Markets are driven by liquidity, momentum, and structure. Smart Money Signals uncovers these forces by translating price action into a clear visual map of flow. It shows:
Where structure was built.
Where it was defended.
Where it was broken.
And where momentum is likely to carry next.
By combining flow detection, dynamic zones, and a live analytics dashboard, the indicator provides traders with a complete framework for reading price action in real time.
Whether you trade crypto, forex, or indices, Smart Money Signals adapts seamlessly to any asset class, giving you clarity, precision, and confidence to execute without second-guessing.

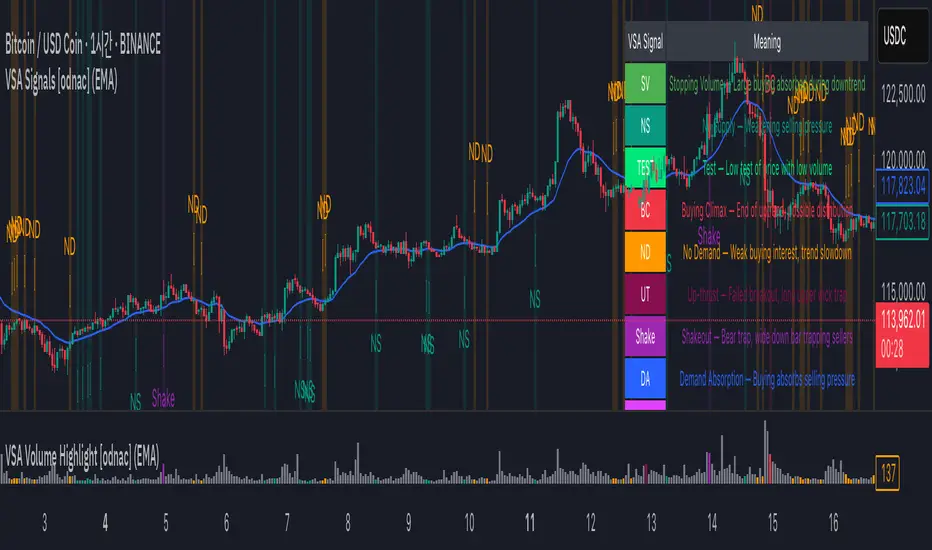
VSA Signals [odnac]This indicator applies Volume Spread Analysis (VSA) concepts to highlight important supply and demand events directly on the chart. It automatically detects common VSA patterns using price spread, relative volume, and candle structure, with optional trend filtering for higher accuracy.
Features:
Stopping Volume (SV): Signals potential end of a downtrend when heavy buying appears.
Buying Climax (BC): Indicates exhaustion of an uptrend with heavy volume near the top.
No Supply (NS): Weak selling pressure, often a bullish sign in an uptrend.
No Demand (ND): Weak buying interest, often a bearish sign in a downtrend.
Test: Low-volume test bar probing for supply.
Up-thrust (UT): Failed breakout with long upper wick, often a bearish trap.
Shakeout: Bear trap with high-volume wide down bar closing low.
Demand Absorption (DA): Demand absorbing heavy selling pressure.
Supply Absorption (SA): Supply absorbing heavy buying pressure.
Additional Options:
Background highlights for detected signals.
Configurable moving average (SMA, EMA, WMA, VWMA) as a trend filter.
Adjustable multipliers for volume and spread sensitivity.
Legend table for quick reference of signals and meanings.
Alerts available for all signals.
This tool is designed to help traders spot professional accumulation and distribution activity and to improve trade timing by recognizing supply/demand imbalances in the market.
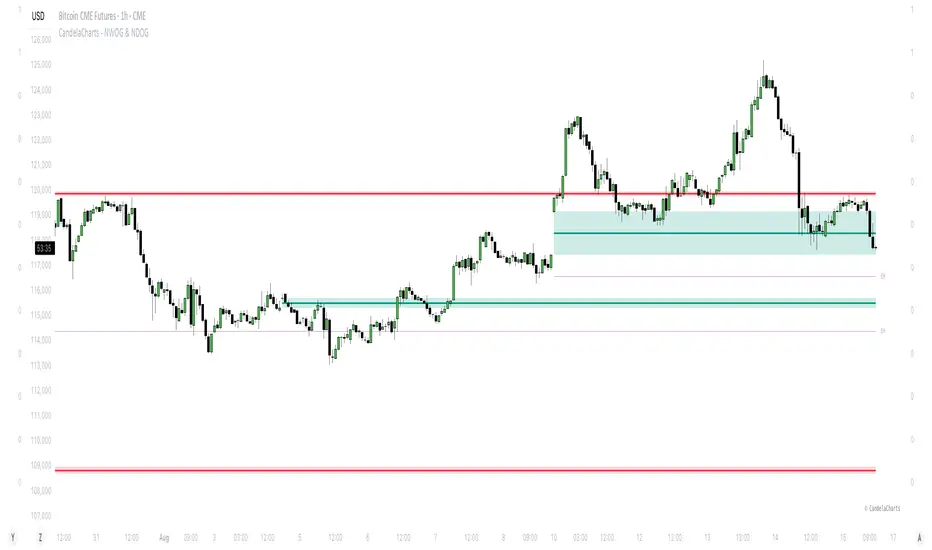
CandelaCharts - NWOG & NDOG📝 Overview
In trading, opening gaps aren’t just noise—they’re clues. Two key ones are the New Week Opening Gap (NWOG) and the New Day Opening Gap (NDOG).
The NWOG forms between Friday’s close (5 PM EST) and Sunday’s open (6 PM EST). It often acts as a magnet—price tends to revisit it, sometimes days or even weeks later. The NDOG is the daily version, showing imbalances at the start of each session.
Between two NWOGs, the Event Horizon (EH)—the midpoint—often becomes a pull for price. When the price hits it, there's a good chance it keeps moving toward the next gap.
I also watch the Optimal Trade Entry (OTE) zones, usually around the 0.68–0.79 retracements between NWOGs. These levels often line up with institutional interest and make solid spots for entries.
To simplify all this, I use an indicator that automatically detects NWOGs and NDOGs, then plots the EH and OTE levels in real time. No manual drawing. Just clean, updated levels every week.
These gaps and their derived levels help map where price is likely to go—and when to act.
📦 Features
MTF
Mitigation
Consequent Encroachment
Threshold
Hide Overlap
Advanced Styling
⚙️ Settings
Show: Controls whether NWOG/NDOG gaps are displayed on the chart.
Show Last: Sets the number of NWOG/NDOG you want to display.
Length: Determines the length of each NWOG/NDOG.
Mitigation: Highlights when an NWOG/NDOG has been touched, using a different color without marking it as invalid.
Timeframe: Specifies the timeframe used to detect NWOG/NDOGs.
Threshold: Sets the minimum gap size required for NWOG/NDOG detection on the chart.
Event Horizon: Controls whether EHs are displayed on the chart.
Show Mid-Line: Configures the midpoint line's width and style within the NWOG/NDOG. (Consequent Encroachment - CE)
Show Border: Defines the border width and line style of the NWOG/NDOG.
Hide Overlap: Removes overlapping NWOG/NDOG from view.
Extend: Extends the NWOG/NDOG length to the current candle.
Elongate: Fully extends the NWOG/NDOG length to the right side of the chart.
⚡️ Showcase
Simple
Mitigated
Bordered
Consequent Encroachment
Extended
Event Horizon
🚨 Alerts
This script provides alert options for all signals.
Bearish Signal
A bearish signal is triggered if the price enters a bearish NWOG/NDOG zone.
Bullish Signal
A bullish signal is triggered if the price enters a bullish NWOG/NDOG zone.
⚠️ Disclaimer
Trading involves significant risk, and many participants may incur losses. The content on this site is not intended as financial advice and should not be interpreted as such. Decisions to buy, sell, hold, or trade securities, commodities, or other financial instruments carry inherent risks and are best made with guidance from qualified financial professionals. Past performance is not indicative of future results.
XAUUSD 1H – FVG Buy/Sell Signals XAUUSD 1H – Fair Value Gap (FVG) Buy/Sell Signals (No Boxes)
What it is:
A clean, signal-only indicator for Gold on the 1-hour chart. It detects 3-bar Fair Value Gaps, waits for a deep retest, then confirms with strong candle structure + trend + ADX before printing a BUY/SELL arrow. No rectangles or clutter—just selective, high-quality signals.
Why it works:
Instead of chasing breakouts, the script hunts for imbalances (FVGs) where price often returns to “fair value.” It only fires when:
price revisits the gap by a configurable depth,
the candle closes beyond the far edge with a small buffer,
the candle body is ≥ ATR × K (confirms intent),
the broader trend (EMA-50/EMA-200) agrees, and
ADX (Wilder, manual) shows sufficient strength.
Key features
✅ Signal-only: arrows/labels—no boxes on chart.
✅ Deep retest logic (percentage of zone), not just a touch.
✅ Strong close filter (edge + buffer) + ATR body filter.
✅ Trend filter (EMA-50 vs EMA-200) to keep trades with the regime.
✅ ADX strength to avoid chop.
✅ One signal per zone (optional “delete on use”).
✅ Alerts for both BUY and SELL.
✅ Built for Pine v6, non-repainting logic on bar close.
Inputs you can tune
Min FVG size (pts) – ignore tiny gaps.
Retest depth (%) – how deep price must come back into the gap.
Close buffer (pts) – extra confirmation beyond zone edge.
Min body ≥ ATR× – candle strength requirement.
Min ADX – trend strength threshold.
Expire after X bars – keep zones fresh.
Delete zone after signal – true = one-shot signals.
How I use it
Apply to XAUUSD 1H.
Keep default filters for selective signals.
For more setups, lower Min FVG size or ADX and reduce retest depth; for stricter signals, do the opposite.
Combine with S/R or session timing (London/NY) for added confluence.
Notes
Signals are generated on bar close.
Designed for clarity and discipline—fewer, cleaner arrows over constant noise.
Works on other symbols/timeframes, but tuned for Gold 1H.
Tags: #XAUUSD #Gold #FVG #SmartMoney #1H #TrendFollowing #ADX #ATR #PineV6 #TradingView

Bullish & Bearish Gap Boxes with Gap Points 2025
Bullish & Bearish Gap Boxes with Gap Points & Table Functionality 2025
## **1. Highlighted Key Points in the Code**
* **Gap Detection Logic**
* **Bullish Gap:** `Low >= High ` (low is above the previous high) → bullish sentiment.
* **Bearish Gap:** `High <= Low ` (high is below the previous low) → bearish sentiment.
* **Configurable Filters**
* Minimum gap size in points (`minGapPoints`).
* Option to show/hide bullish and bearish gaps individually.
* Custom table position, row count, and text size for flexibility.
* **Visual Marking on Chart**
* **Boxes:** Drawn between gap high and low, extending to the right until price “fills” the gap.
* **Labels:** Show gap size (points + %), tooltip with exact high & low.
* **Automatic Gap Removal**
* Bullish gap deleted when `Low <= gapBottom` (gap filled).
* Bearish gap deleted when `High >= gapTop` (gap filled).
* **Gap Ranking Table**
* Shows **nearest** gaps to the current price, sorted by distance.
* Separate bear and bull gap lists, each limited to `maxBearRows` & `maxBullRows`.
* Displays type, gap size, gap %, high, and low.
* Uses the current chart timeframe in the title.
* **Multi-Timeframe Safe Handling**
* Uses `request.security()` to fetch OHLC for the active timeframe.
* Includes a function to translate timeframe into human-readable labels.
---
## **2. User Functionality**
From a trader’s perspective, here’s what your script allows:
Setting window divided into Two Parts for Better Handling normal & Table Section
✅ Functionality to Hide and Show_Gap_Tbl.
✅ **Detects and visually marks price gaps** automatically on any timeframe.
✅ **Extends gap zones** forward until price fills them.
✅ **Separates bullish and bearish gaps** for better decision-making.
✅ **Custom filtering** (minimum size, display toggles, table layout).
✅ **Gap watchlist table** showing only the nearest & most relevant gaps to current price.
✅ **Multi-timeframe compatibility** without repainting issues.
✅ **Clean chart control** with `max_labels_count` & `max_lines_count` limits to prevent overload.
✅ **Clean Tooltip control** with `Gap High` & `Gap Low` & Gap Range Points for Quick Understanding.
---
## **3. Why Gaps Are Important in Trading (Runaway vs. Normal Gaps)**
Gaps in price are **areas with no trading activity** between two consecutive bars. They represent **imbalances between supply and demand** and often occur due to overnight news, earnings, or strong market sentiment.
### **A. Normal (Common) Gaps**
* Appear in normal market moves.
* Often get “filled” quickly as price reverts to the mean.
* Not usually linked to major trends.
* Example: A small gap on a 5-min chart due to sudden but minor news.
### **B. Runaway (Continuation) Gaps**
* Happen **in the middle of strong trends** (uptrend or downtrend).
* Indicate **momentum acceleration** — institutions are aggressively entering.
* Rarely get filled in the short term.
* Example: During a bull rally, price gaps up and never comes back to retest.
---
### **Why Traders Watch Gaps**
1. **Support & Resistance Zones**
* Gaps act like **magnets** for price (gap fill targets) or **barriers** (price rejection).
2. **Trend Confirmation**
* Runaway gaps signal strong momentum; traders may enter in the direction of the gap.
3. **Trade Setup Opportunities**
* Fade the gap: Trade against it if expecting a fill.
* Follow the gap: Trade with it if expecting continuation.
4. **Volume Confirmation**
* High volume + gap = institutional activity → higher reliability.

Zero Lag Liquidity [AlgoAlpha]🟠 OVERVIEW
This script plots liquidity zones with zero lag using lower-timeframe wick profiles and high-volume wicks to mark key price reactions. It’s called Zero Lag Liquidity because it captures significant liquidity imbalances in real time by processing lower-TF price-volume distributions directly inside the wick of abnormal candles. The tool builds a volume histogram inside long upper/lower wicks, then calculates a local Point of Control (POC) to mark the price where most volume occurred. These levels act as visual liquidity zones, which can trigger labels, break signals, and trend detection depending on price interaction.
🟠 CONCEPTS
The core concept relies on identifying high-volume candles with unusually long wicks—often a sign of opposing liquidity. When a large upper or lower wick appears with a strong volume spike, the script builds a histogram of lower-timeframe closes and volumes inside that wick. It bins the wick into segments, sums volume per bin, and finds the POC. This POC becomes the liquidity level. The script then dynamically tracks whether price breaks above or rejects off these levels, adjusts the active trend regime accordingly, and highlights bars to help users spot continuation or reversal behavior. The logic avoids repainting or subjective interpretation by using fixed thresholds and lower-TF price action.
🟠 FEATURES
Dynamic liquidity levels rendered at POC of significant wicks, colored by bullish/bearish direction.
Break detection that removes levels once price decisively crosses them twice in the same direction.
Rejection detection that plots ▲/▼ markers when price bounces off levels intrabar.
Volume labels for each level, shown either as raw volume or percentage of total level volume.
Candle coloring based on trend direction (break-dominant).
🟠 USAGE
Use this indicator to track where liquidity has most likely entered the market via abnormal wick events. When a long wick forms with high volume, the script looks inside it (using your chosen lower timeframe) and marks the most traded price within it. These levels can serve as expected reversal or breakout zones. Rejections are marked with small arrows, while breaks trigger trend shifts and remove the level. You can toggle trend coloring to see directional bias after a breakout. Use the wick multiplier to control how selective the detector is (higher = stricter). Alerts and label modes help customize the signal for different asset types and chart styles.

Volume Statistics - IntraweekVolume Statistics - Intraweek: For Orderflow Traders
This tool is designed for traders using volume footprint charts and orderflow methods.
Why it matters:
In orderflow trading, you care about the quality of volume behind each move. You’re not just watching price; you’re watching how much aggression is behind that price move. That’s where this indicator helps.
What to look at:
* Current Volume shows you how much volume is trading right now.
* Central Volume (median or average over 24h or 7D) gives you a baseline for what's normal volume VS abnormal volume.
* The Diff vs Central tells you immediately if current volume is above or below normal.
How this helps:
* If volume is above normal, it suggested elevated levels of buyer or seller aggression. Look for strong follow-through or continuation.
* If volume is below normal, it may signal low interest, passive participation, a lack of conviction, or a fake move.
* Use this context to decide if what you're seeing in the footprint (imbalances, absorption, traps) is actually worth acting on.
Extra context:
* The highest and lowest volume levels and their timestamps help you spot prior key reactions.
* Second and third highest bars help you see other major effort points in the recent window.
Comment with any suggestions on how to improve this indicator.

Mayfair Reversal Change✅ Mayfair Reversal Change — By EastWave Capital
Description:
The Mayfair Reversal Change indicator is a tool designed to help traders identify potential market turning points using Stochastic Oscillator behavior and filtered price action logic. It acts as a reversal signal filter and is particularly effective when the market is overextended (overbought/oversold) and about to revert from exhaustion zones.
🔍 How It Works:
This script monitors the Stochastic %K and %D crossovers and adds a custom logic layer to filter only high-quality reversal points:
Stochastic Filter Conditions:
Uses smoothed stochastic settings:
%K smoothing = 3
%D smoothing = 3
Only shows signals after %K crosses back below 80 (for Sell) or above 20 (for Buy)
This prevents signals from appearing too early during an active overbought or oversold phase.
Directional Confirmation Logic:
Bullish signal is printed only when %K re-enters below 20 after a confirmed stochastic crossover.
Bearish signal appears only when %K re-enters above 80.
This reduces false signals that occur during continued trending moves.
Toggle Switch:
A user-toggle input is included to enable or disable the reversal filter logic.
This gives flexibility for traders who want to test signals with or without the stochastic condition.
📈 How to Use:
Timeframes: Recommended for 5M, 15M, and 30M
Markets: Compatible with any market — FX, Gold, Indices, Crypto
Entry Approach:
Wait for signal after price has reached a potential extreme area.
Confirm with chart structure, support/resistance, or SMC zone.
Enter on confirmation, placing stop loss beyond the swing high/low.
Combine with trendline breaks or price imbalances (FVG) for extra confluence.
Can be used in combination with the Mayfair FX Scalper script for dual-layer confirmation.
⚠️ Important Notes:
Signals are visual only and should be confirmed with proper strategy.
This indicator does not execute or manage trades automatically.
Designed to assist with reversal setups but should not be used in isolation.
Always manage risk, use SL/TP, and avoid over-leveraging.

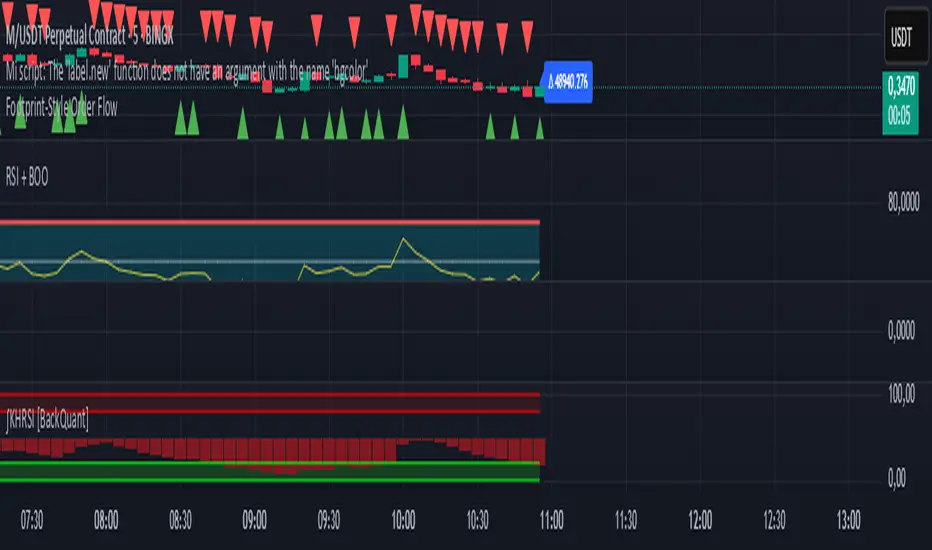
Footprint-Style Order Flow by Kalibea📊 Indicator: "Footprint-Style Order Flow by Kalibea"
Simplified Order Flow Analysis for TradingView
This indicator was created by Kalibea to bring you the power of Order Flow analysis in a clear, practical way—without technical complexity and fully compatible with TradingView.
While TradingView doesn’t support traditional footprint charts, this tool simulates institutional market reading using a smart calculation of estimated volume delta, helping you make more informed trading decisions.
🔍 What does this indicator do?
Estimated Delta: Calculates the difference between buying and selling pressure per candle, based on price movement and volume.
Smart Visual Signals:
🔼 Green Triangle: Potential buy entry (buyer dominance).
🔽 Red Triangle: Potential sell entry (seller dominance).
Delta Histogram: Displays whether each candle was driven more by buyers or sellers.
Live Labels: Shows real-time delta values above each candle for quick interpretation.
🧠 How does it help your trading?
Detects real-time market imbalances (who's in control: buyers or sellers).
Improves entry and exit timing, especially on lower timeframes.
Helps you confirm other strategies such as supply/demand zones, support/resistance, or candlestick patterns.
Provides an institutional-style reading simplified for use within TradingView.
⚙️ Fully Customizable to Your Style
Adjust the delta sensitivity to suit any market: Forex, Crypto, Indices, and more.
Turn on/off visual signals and histogram as needed.
🔑 Recommended by Kalibea for:
✅ Intraday traders and scalpers
✅ Traders looking to take the next step into institutional-style analysis
✅ Those seeking precise entries without overcomplicating their charts
💬 “Order Flow is the market’s internal voice. This indicator helps you hear it—no expensive footprint software required.”
— Kalibea
HaLftrend ModifiedHaLftrend Modified – Advanced Trend Detection, ATR Trailing Stops & Volume Profile
This robust script is a professional upgrade of the HalfTrend indicator, combining real-time trend identification, adaptive ATR-based trailing stops, and a powerful price/volume profile for a fully integrated trading decision suite. Perfect for active traders looking for precise entries, exits, and a deep understanding of price structure.
Core Features
HalfTrend Algorithm (Enhanced):
Detects market trends and reversals using high/low channel breakouts.
Plots dynamic HalfTrend lines directly on your chart, colored for bullish/bearish modes.
Buy and Sell arrows mark trend shifts, with optional on/off toggles.
Channel bands visualize the amplitude and deviation, aiding support/resistance analysis.
ATR Trailing Stop Suite:
Implements an ATR (Average True Range) trailing stop that self-adjusts to market volatility.
Automatically generates Buy and Sell signals when price crosses the trailing stop.
ATR extension signal identifies explosive breakouts—especially useful in fast markets.
Alerts available for all key events (trend change, trailing stop entries, ATR extensions).
Visual Volume Profile Overlay:
Builds a customizable volume profile or net order flow heatmap directly on your chart.
Color-coded, real-time bars let you spot demand/supply clusters, price acceptance, and rejection zones.
Dual modes: Comparison (buy vs. sell volume) or Net Order Flow (imbalances).
Fully adjustable appearance—colors, lookback, resolution, scaling, heatmap intensity, and more.
How to Use
Trend Following: Ride trends by entering on HalfTrend buy/sell signals, confirming with ATR trailing stop shifts.
Volume Analysis: Use the volume profile/heatmap as a powerful confluence tool for support/resistance and value areas.
Multi-Strategy: Ideal for scalping, Intraday , swing trading, or longer-term trend plays across all assets.

🎯SFLD🧲Swings para estudiantes de Bitcoin Traders Academy
Marca Imbalances
Marca Swings
Marca cambio de Pendiente en el Histograma del Indicador Squeeze
Tiene una Tabla de Notas Manuales
Swings for Bitcoin Traders Academy Students by CEO Carlos Garcia
Shows Swings
Shows FVG
Shows Squeeze Histogram Color Change
Has Manual Notes

BT Bar - 1.0 BTBar Description
BTBar is a visual script designed to identify and highlight candles with abnormally high volume, making it easier for traders to spot pressure imbalances and key price areas during live market action.
🔍 The script compares the current candle’s volume to the previous one, and highlights candles that exceed specific percentage thresholds (customizable by the user) using distinct colors.
Rather than relying on generic trend or scalping strategies, BTBar is based on relative volume intensity detection — a concept rooted in order flow analysis — to help traders identify:
Candles with unusual volume spikes (possible absorption or exhaustion),
Medium/high volume continuation signals,
Areas where price might reverse or accelerate.
🛠️ It also offers the option to automatically draw horizontal lines from the open of the highest-volume candles, helping traders track potential institutional decision levels throughout the day.
⚙️ How to use:
Apply BTBar to a clean chart.
Customize the volume threshold levels (e.g., 300%, 400%, etc.).
Watch for highlighted candles — these indicate moments when volume significantly broke previous levels, marking potential points of interest or behavior shifts.
Use the optional horizontal lines as visual support/resistance levels derived from volume extremes.
🧠 Underlying concept:
BTBar uses a percentage-based volume comparison approach, inspired by techniques in footprint charts and volume spike detection.
This allows traders to visually spot key market reactions without relying on numeric overload or complex setups.
SMT Divergence x outofoptions🔍 SMT Divergence — Advanced Market Correlation Analysis
This was created with and approved by @outofoptions to bring you smaller SMTs based on his original SMT Divergence indicator
SMT Divergence is a sophisticated technical analysis indicator designed to identify high-probability reversal and continuation signals through intelligent correlation analysis between related markets. This powerful tool reveals hidden market dynamics by comparing price action divergences across correlated instruments, providing traders with institutional-level market insight.
🎯 Core Capabilities:
Multi-Market Analysis : Automatically compares your chart with a correlated instrument to identify divergence patterns and market inefficiencies
Smart Liquidity Detection : Advanced algorithms identify key liquidity levels and sweep patterns for enhanced signal accuracy
Dynamic Divergence Mapping : Real-time visualization of bullish and bearish divergences with customizable line styles and colors
Intelligent Signal Validation : Optional candle-based confirmation system to filter high-probability setups from noise
Automated Line Management : Smart removal of invalidated divergences to maintain clean, actionable chart analysis
📊 Professional Features:
The SMT Divergence indicator excels at revealing market structure imbalances that often precede significant price movements. By analyzing the relationship between correlated markets, it identifies when institutional money may be positioned differently than retail sentiment suggests, providing early warning signals for potential reversals.
⚙️ Advanced Customization:
Flexible correlation pair selection for any market combination
Customizable visual styling with multiple line types and color schemes
Adjustable validation criteria for different trading styles
Professional alert system with detailed message customization
Automatic cleanup of broken or invalidated divergences
🎨 Visual Excellence:
Clean, professional line drawing with customizable styling
Dynamic labeling system with size and color options
Real-time divergence tracking and management
Institutional-grade chart presentation
Optimized performance for extended analysis periods
📈 Ideal For:
Swing traders seeking high-probability reversal signals
Multi-market analysts comparing correlated instruments
Institutional-style traders using correlation analysis
Advanced technical analysts studying market structure
Those seeking early warning signals for trend changes
🔔 Smart Alerts:
Comprehensive alert system with customizable messaging allows you to stay informed of new divergences across multiple timeframes and market sessions, ensuring you never miss critical market developments.
💡 Market Intelligence:
SMT Divergence transforms complex inter-market relationships into clear, actionable signals, giving you the same analytical edge used by professional trading institutions to identify market turning points before they become obvious to retail traders.
Educational Tool: This indicator is designed for educational and analytical purposes. Divergence analysis requires understanding of market correlation principles. Always combine with proper risk management and additional analysis methods.

Stochastic Z-Score [AlgoAlpha]🟠 OVERVIEW
This indicator is a custom-built oscillator called the Stochastic Z-Score , which blends a volatility-normalized Z-Score with stochastic principles and smooths it using a Hull Moving Average (HMA). It transforms raw price deviations into a normalized momentum structure, then processes that through a stochastic function to better identify extreme moves. A secondary long-term momentum component is also included using an ALMA smoother. The result is a responsive oscillator that reacts to sharp imbalances while remaining stable in sideways conditions. Colored histograms, dynamic oscillator bands, and reversal labels help users visually assess shifts in momentum and identify potential turning points.
🟠 CONCEPTS
The Z-Score is calculated by comparing price to its mean and dividing by its standard deviation—this normalizes movement and highlights how far current price has stretched from typical values. This Z-Score is then passed through a stochastic function, which further refines the signal into a bounded range for easier interpretation. To reduce noise, a Hull Moving Average is applied. A separate long-term trend filter based on the ALMA of the Z-Score helps determine broader context, filtering out short-term traps. Zones are mapped with thresholds at ±2 and ±2.5 to distinguish regular momentum from extreme exhaustion. The tool is built to adapt across timeframes and assets.
🟠 FEATURES
Z-Score histogram with gradient color to visualize deviation intensity (optional toggle).
Primary oscillator line (smoothed stochastic Z-Score) with adaptive coloring based on momentum direction.
Dynamic bands at ±2 and ±2.5 to represent regular vs extreme momentum zones.
Long-term momentum line (ALMA) with contextual coloring to separate trend phases.
Automatic reversal markers when short-term crosses occur at extremes with supporting long-term momentum.
Built-in alerts for oscillator direction changes, zero-line crosses, overbought/oversold entries, and trend confirmation.
🟠 USAGE
Use this script to track momentum shifts and identify potential reversal areas. When the oscillator is rising and crosses above the previous value—especially from deeply negative zones (below -2)—and the ALMA is also above zero, this suggests bullish reversal conditions. The opposite holds for bearish setups. Reversal labels ("▲" and "▼") appear only when both short- and long-term conditions align. The ±2 and ±2.5 thresholds act as momentum warning zones; values inside are typical trends, while those beyond suggest exhaustion or extremes. Adjust the length input to match the asset’s volatility. Enable the histogram to explore underlying raw Z-Score movements. Alerts can be configured to notify key changes in momentum or zone entries.

BanShen MACD Ultimate Multi Signal System[SpeculationLab]🧠 How This Script Works (Detailed Logic Breakdown)
This script is a closed-source, fully self-developed modular trading system centered around MACD divergence detection. It also includes auxiliary modules such as:
Vegas Tunnel trend filtering
Dynamic ATR-based stop placement
Engulfing candlestick pattern detection
RSI/OBV divergence modules
Fair Value Gap (FVG) recognition
A smart signal panel that consolidates all signals in real time
These components work together through a signal resonance framework, helping traders identify high-confluence, high-probability entry opportunities.
🔍 Why MACD Divergence Is the Core (Real-World Strategy Basis)
This system is based on a real-world trading strategy I’ve personally used and refined over time.
Through discretionary trading and backtesting, I discovered that divergence between price action and the MACD histogram — especially when certain structural conditions are met — produces a very high win rate.
Key observations include:
MACD peaks/troughs that are clean and well-shaped (defined pivot structure)
Large vertical differences between two MACD histogram extremes
Price making a higher high or lower low, while MACD does the opposite
Two or more divergences appearing consecutively, which creates a powerful reversal signal
These setups have proven extremely reliable in my experience. This script automates the detection of these conditions using strict logic filters.
🔷 1. MACD Divergence Engine (Core Module)
At its core, this script implements a multi-layered MACD divergence detection system, capable of identifying both **regular** and **consecutive** bullish/bearish divergences.
Key components of the logic:
- **Pivot-Based Peak Detection:**
Peaks and troughs in the MACD histogram are located using left/right lookback lengths.
These define valid turning points by requiring the center bar to be the highest (or lowest) compared to its neighbors.
- **Peak Size Thresholding:**
The height of the histogram peaks is compared to the standard deviation of MACD values.
Only peaks above a configurable multiplier (e.g., 0.1× stdev) are considered significant, filtering out noise.
- **Peak Ratio Filtering:**
For divergence to be valid, the size ratio between two histogram peaks must exceed a minimum threshold.
This prevents "flat" divergences with no meaningful MACD movement from triggering false signals.
- **Noise Suppression:**
A customizable threshold filters out weak histogram fluctuations between divergence points.
- **Price Action Confirmation:**
The divergence is only confirmed when the price forms a new high or low (depending on the type), and the MACD forms an opposing structure.
- **Consecutive Divergence Detection:**
For high-conviction setups, the script detects sequences of two or more divergences in the same direction.
These use stricter filters and flag rare but powerful market turning points.
Signals are plotted using plotshape() with visual differentiation between regular and consecutive setups. You can enable/disable each type individually.
⏰ Note: Histogram colors are styled similarly to TradingView’s built-in MACD for visual familiarity. However, this script is built entirely from scratch and does not reuse any internal TV code.
---
🔷 2. Trend Filtering via Vegas Tunnel
The **Vegas Tunnel** module plots 5 configurable EMAs (default: 12, 144, 169, 576, 676) to evaluate trend direction.
The trend is considered **bullish** when short EMAs (144/169) are positioned above long EMAs (576/676), and the price is interacting with the short EMA tunnel.
Conversely, a bearish condition is detected when the opposite is true.
A visual triangle marker highlights trend zones, and users can hide/show individual EMAs.
---
🔷 3. ATR-Based Dynamic Stop Loss
This module plots dynamic stop levels above and below the current price based on ATR.
Default setting uses 13-period ATR, and users can customize the multiplier or disable the plot.
It serves as a visual guide for risk management in live trades.
---
🔷 4. Engulfing Pattern Recognition
Candlestick-based signal detection:
- **Bullish Engulfing** occurs when a candle closes above the prior high, and the prior bar is bearish.
- **Bearish Engulfing** when a candle closes below the prior low, and the prior bar is bullish.
Users can modify the logic to use open/close levels for looser or stricter detection.
These patterns are highlighted using plotshape markers and optionally included in the signal table.
---
🔷 5. RSI and OBV Divergence Modules
These modules follow similar logic to the MACD engine:
- Use pivotlow() / pivothigh() to detect swing points.
- Confirm divergence only when price moves in one direction while RSI or OBV moves in the opposite direction.
- Require a minimum distance (in bars) between the two pivots.
- Require a certain ratio between two indicator values and their corresponding prices.
You can only enable **one of MACD/RSI/OBV divergences at a time** to avoid visual overlap, as they share the same subplot.
---
🔷 6. FVG (Fair Value Gap) Auto Detection
This module detects large single-direction price moves where price leaves a visible gap between candle 3 bars ago and 1 bar ago.
- **Bullish FVG**: high < low
- **Bearish FVG**: low > high
ATR-based filters are applied to eliminate minor gaps.
Each gap is drawn as a box and optionally extended, with a central line marking the midpoint (CE - Consequent Encroachment) level.
Traders often look for price to return to this level as an entry signal.
---
🔷 7. Smart Signal Table
All active signals (MACD, Vegas, RSI, OBV, Engulfing) are collected into a **real-time table** that displays current market bias.
- Each module reports whether it is currently giving a bullish (🟢) or bearish (🔴) condition.
- Helps users assess signal alignment (confluence).
- The table is updated every bar and appears in the bottom-right corner.
---
🔷 8. Watermark & Branding
The watermark displays the script name and author at the top-right, and can be toggled via settings.
📌 Not a Mashup — Structured System, Not a Stack of Indicators
⚠️ This is not a random mashup of unrelated indicators.
Every module in this system was intentionally designed to support the core MACD divergence logic by filtering, validating, or amplifying its signals.
Here's how the system achieves signal confluence and structure:
Vegas Tunnel acts as a macro trend filter, helping users determine whether to favor long or short trades.
For example, bullish MACD divergence is more reliable when confirmed by an uptrend in the Vegas EMAs. This prevents users from trading against momentum.
Engulfing Patterns serve as entry-level price action confirmation.
When a bullish engulfing candle appears near a MACD bullish divergence — and trend conditions from Vegas are aligned — the confluence increases dramatically.
This is especially powerful when multiple modules confirm in the same direction on the right side of the chart.
RSI and OBV Divergence modules offer redundant but independent momentum views.
Users may enable them selectively to validate MACD signals, or to use them as standalone alternatives when MACD is flat or noisy.
FVG Zones provide context for entries or targets.
For instance, a MACD bullish divergence forming near a bullish FVG gap increases the odds of reversal.
Price often "fills" these imbalances, which aligns well with reversal setups.
The Smart Signal Table aggregates signals from all modules and provides a visual, real-time overview of the current market bias.
This allows traders to act only when multiple signals are aligned — for example, when MACD is bullish, trend is up, and a bullish engulfing just printed.
Together, this framework creates a coherent decision-making system, where each tool has a defined role: trend filtering, signal confirmation, risk management, or entry detection.
🧩 It is modular in architecture, but not modular in purpose.
This system was not built by stacking indicators, but by integrating logic across modules to support a high-conviction MACD-based strategy.
🧬 Originality Statement
This script is entirely original, developed from scratch without using external libraries or public script code. The logic is fully custom, especially the consecutive divergence detection system and signal integration.
⚠️ Disclaimer
This script is for educational and informational purposes only and does not constitute financial advice. Trade at your own risk.
---
📘 中文简要说明:
这是一个完全原创、闭源的交易系统,核心逻辑为 MACD 柱状图背离信号的识别,配合多模块共振判断,构建出一个高胜率的多信号共振策略。
本指标模块化结构清晰,主要包括:
- MACD 背离识别(支持连续背离)
- Vegas EMA 隧道趋势过滤
- RSI / OBV 背离模块
- 吞没形态识别
- FVG 平衡区间自动标注
- ATR 动态止损提示
- 智能信号面板(整合所有信号并可视化)
所有模块均可单独开启/关闭,适配顺势、逆势或多周期的交易风格。
本脚本为个人实战策略的程序化实现,逻辑完全由零开发,未使用任何公用代码。适合希望提高交易胜率和信号精准度的用户使用。
免责声明:本指标仅用于技术分析学习与参考,不构成任何投资建议。请您独立判断,自行承担交易风险。

Binance Spot vs Perpetual Price index by BIGTAKER📌 Overview
This indicator calculates the premium (%) between Binance Perpetual Futures and Spot prices in real time and visualizes it as a column-style chart.
It automatically detects numeric prefixes in futures symbols—such as `1000PEPE`, `1MFLUX`, etc.—and applies the appropriate scaling factor to ensure accurate 1:1 price comparisons with corresponding spot pairs, without requiring manual configuration.
Rather than simply showing raw price differences, this tool highlights potential imbalances in supply and demand, helping to identify phases of market overheating or panic selling.
🔧 Component Breakdown
1. ✅ Auto Symbol Mapping & Prefix Scaling
Automatically identifies and processes common numeric prefixes (`1000`, `1M`, etc.) used in Binance perpetual futures symbols.
Example:
`1000PEPEUSDT.P` → Spot symbol: `PEPEUSDT`, Scaling factor: `1000`
This ensures precise alignment between futures and spot prices by adjusting the scale appropriately.
2. 📈 Premium Calculation Logic
Formula:
(Scaled Futures Price − Spot Price) / Spot Price × 100
Interpretation:
* Positive (+) → Futures are priced higher than spot: indicates possible long-side euphoria
* Negative (−) → Futures are priced lower than spot: indicates possible panic selling or oversold conditions
* Zero → Equilibrium between futures and spot pricing
3. 🎨 Visualization Style
* Rendered as column plots (bar chart) on each candle
* Color-coded based on premium polarity:
* 🟩 Positive premium: Light green (`#52ff7d`)
* 🟥 Negative premium: Light red (`#f56464`)
* ⬜ Neutral / NA: Gray
* A dashed horizontal line at 0% is included to indicate the neutral zone for quick visual reference
💡 Strategic Use Cases
| Market Behavior | Strategy / Interpretation |
| ----------------------------------------- | ------------------------------------------------------------------------ |
| 📈 Premium surging | Strong futures demand → Overheated longs (short setup) |
| 📉 Premium dropping | Aggressive selling in futures → Oversold signal (long setup) |
| 🔄 Near-zero premium | Balanced market → Wait and observe or reassess |
| 🧩 Combined with funding rate or OI delta | Enables multi-factor confirmation for short-term or mid-term signals |
🧠 Technical Advantages
* Fully automated scaling for prefixes like `1000`, `1M`, etc.
* Built-in error handling for inactive or missing symbols (`ignore_invalid_symbol=true`)
* Broad compatibility with Binance USDT Spot & Perpetual Futures markets
🔍 Target Use Cases & Examples
Compatible symbols:
`1000PEPEUSDT.P`, `DOGEUSDT.P`, `1MFLUXUSDT.P`, `ETHUSDT.P`, and most other Binance USDT-margined perpetual futures
Works seamlessly with:
* Binance Spot Market
* Binance Perpetual Futures Market

AMV Highs and LowsAMV Highs and Lows
A contextual range-coloring tool designed to simplify where you are in the current session’s structure.
What it does:
AMV Highs and Lows is a compact, real-time market structure indicator that analyzes price positioning within a rolling 4-hour range to highlight high/low zones, balanced regions, and choppy conditions.
Rolling Session Range: Automatically calculates the high, low, and volume over the last 4 hours.
Contextual Candle Coloring: Colors candles based on where price sits within that range —
Red for low zone, green for high zone, yellow for mid-range chop.
Multiple Viewing Modes: Choose from: Candle Coloring, Line Mode, Table Overlay
Volume Context (POC/VAH/VAL): Internally calculates volume percentile areas — though hidden by default — to later extend into profile-like applications.
Use case:
This tool is for intraday traders, scalpers, and orderflow/momentum traders who want a quick-glance assessment of:
Where price is sitting relative to recent structure
High Zone → Price is pressing extremes → good for breakout or reversal setups
Low Zone → Possible accumulation/distribution → trap or bounce potential
Chop Zone → Mid-range indecision → avoid or scalp with caution
Market Mood at a Glance
The color logic gives immediate visual feedback — especially helpful in fast-moving markets or when managing multiple charts.
Use this tool as a bias filter, a visual timing helper, or a session mood gauge. Combine it with your setups (liquidity zones, imbalances, VWAP, etc.) to know when to act and when to not take any entries in the market.

Automated Scalping Signals with TP/SL Indicator [QuantAlgo]🟢 Overview
The Automated Scalping Signals with Take Profit & Stop Loss Indicator is a multi-timeframe trading system that combines market structure analysis with directional bias filtering to identify potential scalping opportunities. It detects Points of Interest (POI) including Fair Value Gaps (FVG) and Order Blocks (OB) while cross-referencing entries with higher timeframe exponential moving average positioning to create systematic entry conditions.
The indicator features adaptive timeframe calculations that automatically scale analysis periods based on your chart timeframe, maintaining consistent analytical relationships across different trading sessions. It provides integrated trade management with stop loss calculation methods, configurable risk-reward ratios, and real-time performance tracking through dashboard displays showing trade statistics, bias direction, and active position status.
This advanced system is designed for low timeframe trading, typically performing optimally on 1 to 15-minute charts across popular instruments such as OANDA:XAUUSD , CME_MINI:MES1! , CME_MINI:ES1! , CME_MINI:MNQ1! , CBOT_MINI:YM1! , CBOT_MINI:MYM1! , BYBIT:BTCUSDT.P , BYBIT:ETHUSDT.P , or any asset and timeframe of your preference.
🟢 How It Works
The indicator operates using a dual-timeframe mathematical framework where higher timeframe exponential moving averages establish directional bias through cross-over analysis, while simultaneously scanning for specific market structure patterns on the POI timeframe. The timeframe calculation engine uses multiplication factors to determine analysis periods, ensuring the bias timeframe provides trend context while the POI timeframe captures structural formations.
The structural analysis begins with FVG detection, which systematically scans price action to identify imbalances where gaps exist between consecutive candle ranges with no overlapping wicks. When such gaps are detected, the algorithm measures their size against minimum thresholds to filter out insignificant formations. Concurrently, OB recognition analyzes three-candle sequences, examining specific open/close relationships that indicate potential institutional accumulation zones. Once these structural patterns are identified, the algorithm cross-references them against the higher timeframe bias direction, creating a validation filter that only permits entries aligned with the prevailing EMA cross-over state. When price subsequently intersects these validated POI zones, entry signals generate with the system calculating entry levels at zone midpoints, then applying the selected stop loss methodology combined with the configured risk-reward ratio to determine take profit placement.
To mirror realistic trading conditions, the indicator incorporates configurable slippage calculations that account for execution differences between intended and actual fill prices. When trades reach their take profit or stop loss levels, the algorithm applies slippage adjustments that worsen the exit prices in a conservative manner - reducing take profit fills and increasing stop loss impact. This approach ensures backtesting results reflect more realistic performance expectations by accounting for spread costs, market volatility during execution, and liquidity constraints that occur in live trading environments.
It also has a performance dashboard that continuously tracks and displays comprehensive trading metrics:
1/ Bias TF / POI TF: Displays the calculated timeframes used for bias analysis and POI detection, showing the actual periods (e.g., "15m / 5m") that result from the multiplier settings to confirm proper adaptive timeframe selection
2/ Bias Direction: Shows current market trend assessment (Bullish, Bearish, or Sideways) derived from EMA cross-over analysis to indicate which trade directions align with prevailing momentum
3/ Data Processing: Indicates how many price bars have been analyzed by the system, helping users verify if complete historical data has been processed for comprehensive strategy validation
4/ Total Trades: Displays the cumulative number of completed trades plus any active positions, providing volume assessment for statistical significance of other metrics
5/ Wins/Losses: Shows the raw count of profitable versus unprofitable trades, offering immediate insight into strategy effectiveness frequency
6/ Win Rate: Reveals the percentage of successful trades, where values above 50% generally indicate effective entry timing and values below suggest strategy refinement needs
7/ Total R-Multiple: Displays cumulative risk-reward performance across all trades, with positive values demonstrating profitable system operation and negative values indicating net losses requiring analysis
8/ Average R Win/Loss: Shows average risk-reward ratios for winning and losing trades separately, where winning averages approaching the configured take profit ratio indicate minimal slippage impact while losing averages near -1.0 suggest effective stop loss execution
9/ TP Ratio / Slippage: Displays the configured take profit ratio and slippage settings with calculated performance impact, showing how execution costs affect actual versus theoretical returns
10/ Profit Factor: Calculates the ratio of total winning amounts to total losing amounts, where values above 1.5 suggest robust profitability, values between 1.0-1.5 indicate modest success, and values below 1.0 show net losses
11/ Maximum Drawdown: Tracks the largest peak-to-trough decline in R-multiple terms, with smaller negative values indicating better capital preservation and risk control during losing streaks
🟢 How to Use
Start by applying the indicator to your chart and observe its performance across different market conditions to understand how it identifies bias direction and POI formations. Then navigate to the settings panel to configure the Bias Timeframe Multiplier for trend context sensitivity and POI Timeframe Multiplier for structural analysis frequency according to your trading preference and objectives.
Next, fine-tune the EMA periods in Bias Settings to control trend detection sensitivity and select your preferred POI types based on your analytical preference. Proceed to configure your Risk Management approach by selecting from the available stop loss calculation methods and setting the Take Profit ratio that aligns with your risk tolerance and profit objectives. Complete the setup by customizing Display Settings to control table visibility and trade visualization elements, adjusting UI positioning and colors for optimal chart readability, then activate Alert Conditions for automated notifications on trade entries, exits, and bias direction changes to support systematic trade management.
🟢 Examples
OANDA:XAUUSD
CME_MINI:MES1!
CME_MINI:ES1!
CME_MINI:MNQ1!
CBOT_MINI:YM1!
BYBIT:BTCUSDT.P
BINANCE:SOLUSD
*Disclaimer: Past performance is not indicative of future results. None of our statements, claims, or signals from our indicators are intended to be financial advice. All trading involves substantial risk of loss, not just upside potential. Users are highly recommended to carefully consider their financial situation and risk tolerance before trading.

Rapid ICT Suite - MTF Concepts & iFVGTitle: Rapid ICT Suite - MTF Concepts & iFVG
Overview
Unlock a new level of market analysis with the Rapid ICT Suite, a comprehensive, all-in-one indicator designed for the discerning price action trader. This powerful tool merges two distinct analytical engines into one seamless experience, allowing you to overlay critical Higher Timeframe (HTF) market structure onto your current chart while simultaneously tracking real-time Fair Value Gaps (FVGs) and their inversions (iFVGs).
Whether you are a scalper needing to respect 1H structure, a day trader aligning with the 4H bias, or a swing trader mapping the daily trend, this indicator provides the clarity and context you need to make higher-probability trading decisions. It was built from the ground up to solve common issues traders face, delivering stable, precise, and flexible analysis.
The Strategy: Targeting IRL with iFVG Entries
The Destination (The "Why"): Internal Range Liquidity (IRL)
On a Higher Timeframe (HTF), we will identify major Internal Range Liquidity (IRL) zones. In the context of ICT, IRL simply refers to unmitigated Fair Value Gaps (FVGs) that exist within a broader trading range.
These HTF FVGs act as powerful magnets for price. The market will often seek out these zones to rebalance before continuing its next major move. By plotting these on our chart, we establish a clear directional bias and a high-probability target. Our indicator will now label these HTF FVG boxes as "IRL".
The Entry Signal (The "How"): Inverted Fair Value Gaps (iFVG)
Once we have our HTF IRL target, we drop down to our Lower Timeframe (LTF) for execution.
We wait for price to create an Inverted Fair Value Gap (iFVG). An iFVG is a regular FVG that has failed and been traded through, signifying a shift in momentum.
An iFVG appearing on the LTF provides a high-precision entry signal to take a trade in the direction of the HTF IRL zone. It's our confirmation that the market is likely now making its move towards that destination.
Key Features
Multi-Timeframe Order Blocks (Boxes): Automatically identify and plot key HTF demand and supply zones (Order Blocks) onto your chart.
Multi-Timeframe Fair Value Gaps (Boxes): See where HTF imbalances exist, giving you a clear map of institutional reference points and potential targets.
Multi-Timeframe Liquidity Pools (Boxes): Pinpoint where buy-side and sell-side liquidity is likely resting, based on clusters of old highs and lows.
Current Timeframe FVG & iFVG (Lines/Labels): A second, independent engine tracks FVGs on your chosen timeframe, monitors them for mitigation, and automatically identifies when an FVG has been inverted (iFVG), a crucial shift in market dynamics.
The "Rapid" Advantage: Solving Trader Frustrations
This indicator was engineered to overcome three of the most common problems with technical indicators:
1. ✅ No More Flickering or "Ghost" Signals
The Problem: Many indicators show signals on the live, forming candle. This causes zones or signals to appear and disappear ("flicker"), leading to confusion and false entries.
The Solution: The Rapid ICT Suite uses 100% confirmed, closed-candle data for all its calculations (OB, FVG, and Liquidity). A zone will only appear on your chart after the price action that confirms it is complete. This means every signal is stable, reliable, and non-repainting.
2. ✅ Frame-Perfect, Precise Placement
The Problem: Indicators that use lookback logic often draw their signals one candle too late, causing a visual disconnect between the price pattern and the signal itself.
The Solution: We have corrected this common flaw. Every box and line is drawn starting from the exact confirmation candle of the pattern. This frame-perfect precision is critical for accurate analysis and planning your entries.
3. ✅ The Dual Analysis Engine: Uncluttered & Flexible
The Problem: Trying to analyze multiple timeframes at once can lead to cluttered charts and mental overload .
The Solution: This suite contains two independent parts that you can control separately.
Part 1 gives you the macro context—the HTF structure where big moves originate.
Part 2 gives you the micro details—the real-time FVG and iFVG story on your trading timeframe.
Use them together for a complete picture, or toggle one off to focus on a specific aspect of your strategy. This flexibility keeps your workspace clean and your analysis sharp.
How to Use & Settings Explained
The indicator settings are neatly organized into two main parts.
Part 1: MTF Concepts (OB, FVG, Liq)
This section controls the Higher Timeframe boxes that are overlaid onto your current chart.
Higher-TF for OB/FVG/Liq: This is the most important setting. Select the higher timeframe you want to analyze. For example, if you are trading on the 15-minute chart, you might set this to 240 (4-Hour) to see the key 4H zones.
Show Order-Blocks / FVGs / Liquidity: Simple toggles to turn each type of HTF zone on or off.
Max... Count: Controls how many of the most recent zones are displayed on the chart, preventing clutter from old, irrelevant zones.
Part 2: FVG & iFVG (Lines/Labels)
This section controls the second engine, which analyzes FVGs and iFVGs on its own selected timeframe.
Timeframe for FVG/iFVG: Choose the timeframe for this analysis. You can leave it blank to use your current chart's timeframe, or set it to a specific one.
Mitigation Type & Mitigation %: A powerful feature to define when an FVG is considered "used up."
Type: Choose if mitigation is counted from the candle's Wick or Close.
Percent: Set how far price must retrace into an FVG (e.g., 50%) before it is considered mitigated and the lines are removed from your chart.
FVG/iFVG Count: Controls how many of the most recent FVG/iFVG zones are displayed.
Style & Color Settings: Fully customize the appearance of the lines and labels to match your chart theme.
Final Words
This indicator was built to provide actionable clarity. By understanding the interplay between higher-timeframe structure and current price action, you can significantly enhance your trading edge. Thank you for choosing the Rapid ICT Suite.
Happy trading!

FVG fill with immediate rebalance [LuciTech]The "FVG fill with immediate rebalance AKA Golden Arrow" indicator is designed to identify Fair Value Gaps (FVGs) and detect immediate rebalances to highlight potential trading opportunities. It uses colored boxes to mark FVGs and triangular markers to signal bullish or bearish setups, helping traders pinpoint key price levels where imbalances occur and price reactions are likely.
Key Features
FVG Detection: Spots bullish and bearish Fair Value Gaps based on price action, with customizable width settings.
Golden Arrow Signals: Displays triangular markers when price fills an FVG and immediately rebalances, indicating potential reversal or continuation zones.
Customizable Colors: Bullish FVGs appear in green and bearish FVGs in red by default, with options to tweak colors in the settings.
Time Filter: Allows signals to be restricted to a specific time window, highlighted by a background fill for clarity.
Alert System: Supports TradingView alerts for "Bullish Golden Arrow" and "Bearish Golden Arrow" signals to keep traders updated on setups.
How It Works
FVG Calculation: Analyzes gaps between candles to identify FVGs, with user-defined minimum width options (points, percentages, or ATR-based).
Signal Generation: Triggers a Golden Arrow signal when price fills the FVG and rebalances immediately, based on wick penetration and closing conditions.
Visual Aids:
Bullish FVGs are shown as green boxes, bearish FVGs as red boxes.
Upward triangles mark bullish signals, downward triangles mark bearish signals.
Time-Based Filtering: Optionally limits signals to specific hours, with a background fill showing the active period.

cd_cisd_market_CxHi Traders,
Overview:
Many traders follow market structure to identify the market direction and seek trade opportunities in line with the trend.
However, markings derived from user-defined inputs can create different structures, depending on personal choices. For instance, choosing a pivot distance of 3 instead of 2 alters the structure, even though the chart remains the same. Ideally, the structure should remain consistent.
"Change in State Delivery" ( CISD ) is a widely accepted concept among traders and is considered a significant indicator of market direction based on the gain/loss of CISD levels.
In this indicator, CISD is selected as the primary criterion for marking market structure, eliminating the influence of user-dependent variations.
Here is a summary of the key logic and rules applied:
• When the price forms a new high/low, that level is only considered a pivot if a CISD has occurred.
• A bullish CISD is always followed by a bearish CISD, and vice versa.
• Pivot points form the internal structure.
• The internal structure is used to interpret the swing structure.
• Probabilities are derived from internal structure patterns.
________________________________________
Details:
How is CISD determined?
As is commonly known:
• When price makes a new high, the opening level of the first candle in the consecutive bullish candle sequence is marked.
• When price makes a new low, the opening of the first candle in the consecutive bearish sequence is marked.
• If there’s only one candle in the sequence, its opening level is used.
In a bullish market, losing a bearish CISD level (i.e., a close below it) or in a bearish market, gaining a bullish CISD level (i.e., a close above it) is interpreted as a potential shift in buyer-seller dominance and a possible market reversal.
________________________________________
How are internal (pivot) levels determined?
• When price closes below a bearish CISD level, the highest candle's high becomes a pivot high (PH).
• When price closes above a bullish CISD level, the lowest candle's low becomes a pivot low (PL).
• If the new PH is above the previous PH, it’s labeled as HH (Higher High); otherwise, LH (Lower High).
• If the new PL is below the previous PL, it’s labeled as LL (Lower Low); otherwise, HL (Higher Low).
________________________________________
Internal Market Structure:
• A series of HHs indicates a bullish internal structure.
• A series of LLs indicates a bearish internal structure.
________________________________________
Swing (Main) Market Structure:
Using internal pivots and previous swing levels, the main market structure is derived.
• A new swing high (SH) requires the price to move above the previous SH.
• A new swing low (SL) requires the price to move below the previous SL.
________________________________________
Probability Calculation:
Pivot levels forming the internal structure are coded as five-element sequences.
There are 64 possible combinations of such sequences made from consecutive PH and PL values.
Each pattern’s frequency from its starting candle is tracked.
To make it more understandable:
For example, after the four-sequence “HH, LL, LH,HL”, either HH or LH might follow.
The table shows the statistical likelihood of both possible outcomes for the most recent four-element sequence on the chart.
________________________________________
How reliable is it?
To assess reliability, results are calculated from the beginning using:
Success Rate (Suc. Rt) = Number of Correct Predictions / Total Predictions
This value is added to the table for reference.
It’s important to note that no statistical outcome guarantees certainty—every result offers a different interpretation. What truly matters is to avoid getting stopped out 😊.
________________________________________
Menu Options:
Show/hide preferences and color selections can be customized via the indicator menu.
________________________________________
What’s Coming in Future Versions?
Features such as FVG (Fair Value Gaps) between swing levels, volume imbalances, order blocks / mitigation blocks, Fibonacci levels, and relevant trade suggestions will be added.
________________________________________
This is a BETA version that I believe will help simplify your market reading. I’d be happy to hear your feedback and suggestions.
Cheerful Trading!

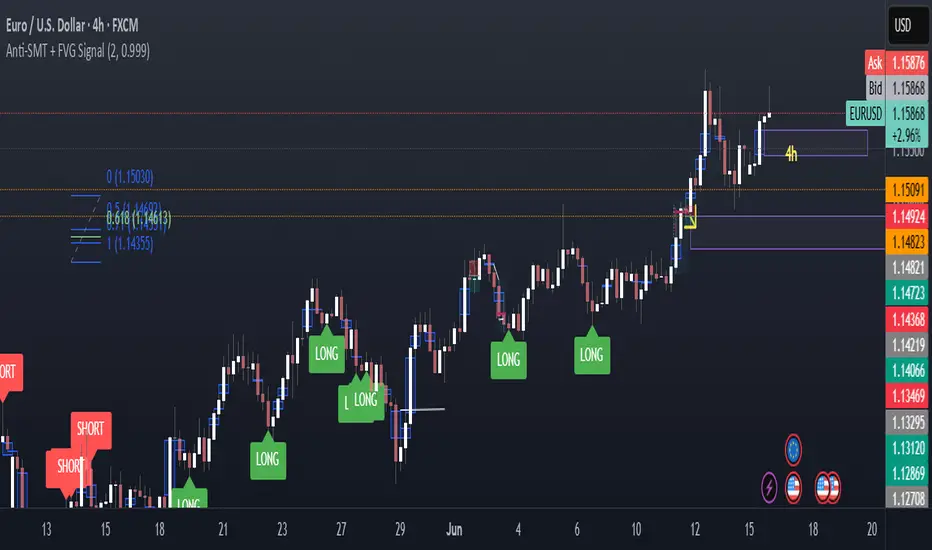
Anti-SMT + FVG SignalMade by Laila
Anti-SMT + FVG Strategy
A contrarian price-action strategy that combines SMT illusion with Fair Value Gap (FVG) confirmation and multiple filters.
Strategy Concept
This strategy challenges traditional SMT divergence logic. Instead of entering trades based on expected SMT divergence between correlated pairs (e.g., EURUSD and DXY), it assumes the divergence is false and will reverse. The concept is to take advantage of these false signals, also known as "SMT illusions."
To confirm the setup, the strategy integrates Fair Value Gaps (FVGs), which are price imbalances left unfilled between candle 1 and 3.
Anti-SMT Logic
Short Entry:
EURUSD makes a new high (Candle 1)
DXY does not make a new low
Long Entry:
EURUSD makes a new low (Candle 1)
DXY does not make a new high
This divergence is considered false, and the strategy expects a reversal.
Fair Value Gap (FVG) Confirmation
A trade is only triggered if the price touches a Fair Value Gap during:
Candle 1 (the candle that forms the SMT illusion), or
Candle 2 (entry confirmation)
This helps avoid low-quality setups and increases entry precision.
Additional Filters
To improve robustness and prevent overfitting, the strategy includes:
EMA Trend Filter:
Long entries are allowed only if price is above the 50 EMA
Short entries are allowed only if price is below the 50 EMA
Time Filter:
Trades are only permitted between 08:00 and 18:00 UTC
Cooldown Filter:
A minimum of 10 candles between trades is required to prevent overtrading
Strategy Parameters and Defaults
Optimized for EURUSD on the 4-hour (4H) timeframe
Includes realistic commission and slippage
Uses conservative position sizing (e.g., 1% per trade)
Backtesting over hundreds of trades shows approximately 57% win rate under default conditions
These results are historical and do not guarantee future performance
Purpose and Value
This strategy offers a structured and logical approach to contrarian trading by:
Introducing the concept of false SMT divergence
Using price inefficiencies (FVGs) as confirmation
Filtering trades with realistic and widely accepted conditions
Encouraging quality over quantity through strict entry rules
It is not a simple mashup but a well-defined trading system that blends institutional concepts in a usable framework.