VixTrixVixTrix - Because markets move in both directions.
VixTrix was born from a fundamental limitation in traditional volatility indicators: they only measure downside panic, completely missing the greed-driven extremes that form market tops.
How It Works:
Dual-Component Analysis:
vixBear = Panic selling intensity (distance from recent highs)
vixBull = FOMO buying intensity (distance from recent lows)
Oscillator = vixBear - vixBull = Net fear/greed imbalance
When the oscillator is positive, fear dominates (potential bottom forming). When negative, greed dominates (potential top forming).
Professional-Grade Filtering:
The magic happens with the symmetric RMS (Root Mean Square) bands. Unlike fixed percentage bands or standard deviation, RMS:
Creates mathematically symmetric positive/negative thresholds
Naturally adapts to changing volatility regimes
Provides statistical significance to extremes
VixTrix also adds selectable MA smoothing for the RMS calculation:
WMA (default): Balanced – middle-ground approach
VWMA: Volume-weighted – filters low-volume noise
EMA: Responsive – catches quick reversals
SMA: Stable – for swing trading
HMA: Fast and smooth – ideal for day trading
Signals require triple confirmation:
Statistical Extreme: Oscillator beyond RMS band
Price Action Confirmation: Correct candle color (bullish for bottoms, bearish for tops)
Momentum Continuation: Oscillator still moving toward extreme (exhaustion)
This multi-filter approach reduces premature entries and false signals while maintaining early positioning at potential reversal points.
Why This Matters for Your Trading:
In bull markets, traditional fear indicators sit near zero, giving no warning of impending tops.
VixTrix identifies when greed becomes excessive – when FOMO buying reaches statistical extremes that often precede corrections.
In range-bound markets, VixTrix excels at identifying overreactions in both directions, providing high-probability mean reversion opportunities.
During crashes, it captures the panic selling with the same precision as VixFix, but with better timing through its momentum confirmation.
VixTrix spots continuations through:
"No Signal" = Healthy Trend – Oscillator stays between RMS bands (no exhaustion)
Failed Extremes – Touches band but no triple confirmation = trend likely continues
Hidden Divergence – Price makes higher low while oscillator makes shallower low = uptrend continues
Controlled Emotions – Oscillator negative but not extreme in uptrends (greed present but not excessive)
Key Insight: When VixTrix doesn't give a signal during a pullback, institutions aren't panicking – they're just pausing before resuming the trend.
Green columns = Bullish exhaustion (potential bottoms)
Red columns = Bearish exhaustion (potential tops)
Golden RMS bands = Dynamic thresholds adapting to current volatility
Background highlights = Active signal conditions
The Result: A professional-grade oscillator that works in all market conditions – trending up, trending down, or ranging – by measuring the complete emotional spectrum driving price action.
Search in scripts for "imbalance"

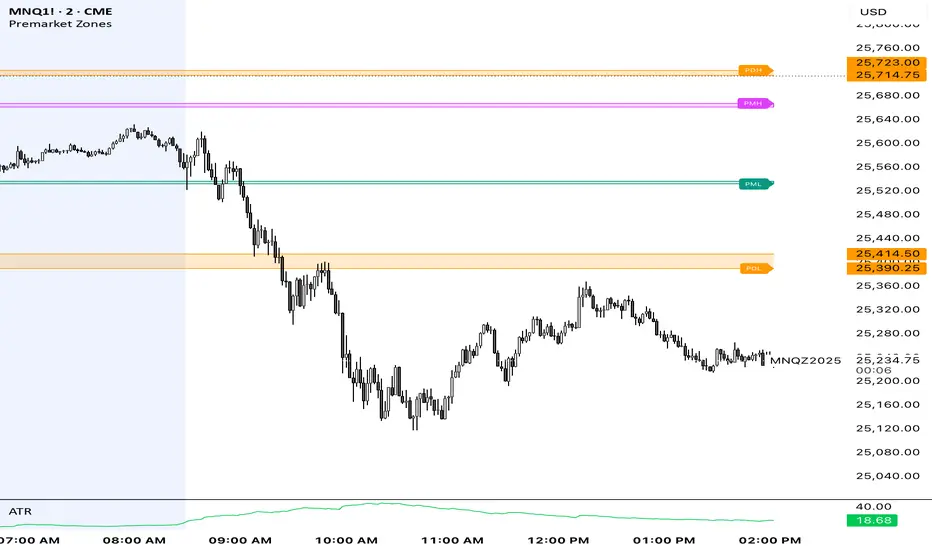
Premarket ZonesThis indicator is built for index futures traders (ES, NQ, RTY, YM) who trade liquidity, session structure, and high-probability reaction levels using true CME futures timing.
It automatically plots:
Premarket High & Low zones (wick + body)
Previous Day Futures RTH High & Low zones (PDH / PDL)
Clean right-edge labels
First-touch alerts (once per day)
All calculations are based on Central Time (CT) and CME futures sessions, not equity cash-market hours.
🕒 Session Definitions (CME / Central Time)
Session Time (CT) Purpose
Premarket 03:00 – 08:30 Overnight liquidity build
Futures RTH (Calc) 08:30 – 15:00 True CME regular trading hours
Plot Window 03:00 – 16:00 Visual extension of zones
This script intentionally uses 08:30 CT as the futures open — not 09:30 equity cash open.
🔷 Premarket Zones (PMH / PML)
The indicator builds two premarket zones using multi-timeframe precision.
How they are calculated:
1-minute candles → capture the true wick extremes
5-minute candles → capture the dominant body area
Zones:
Premarket High Zone (PMH)
Between the highest 5-minute candle body and the highest 1-minute wick
Premarket Low Zone (PML)
Between the lowest 1-minute wick and the lowest 5-minute candle body
Key behavior:
Zones finalize at 08:30 CT
Once finalized, zones are drawn as boxes that extend left to 03:00 CT
Zones extend forward through the trading day for context
PMH / PML labels are plotted on the right edge
These zones represent overnight liquidity pools commonly used for:
Opening drive continuation
Liquidity sweeps
Mean reversion
Acceptance vs rejection at the open
🔶 Previous Day High / Low (PDH / PDL)
This script plots TRUE futures PDH / PDL, not equity-based levels.
How they are calculated:
Uses only the prior day’s futures RTH (08:30–15:00 CT)
1-minute candles → wick extremes
5-minute candles → body value areas
Zones:
PDH Zone: 5m body → 1m wick
PDL Zone: 1m wick → 5m body
These levels represent:
Institutional reference points
Prior session balance extremes
High-probability reaction zones
Clean PDH / PDL labels are plotted on the right edge.
🔔 Alerts (Once Per Day)
The indicator includes first-touch alerts for:
PDH
PDL
Premarket High Zone
Premarket Low Zone
Each alert triggers only once per session, making it ideal for:
Trade planning
Discipline-based execution
Prop firm risk control
📈 How Traders Use This Script
This indicator is context-based, not predictive.
Common use cases:
Waiting for liquidity sweeps into PMH / PML
Trading rejection or acceptance at PDH / PDL
Combining with:
VWAP
Opening Range
Market structure
Volume or delta tools
It works especially well on:
Opening range days
Mean-reversion conditions
Trend continuation days after overnight imbalance
🎯 Design Philosophy
Futures-first logic
No clutter
No repainting
No equity-market assumptions
Levels professionals actually use
This script is designed to mirror how professional futures traders map their charts.
⚠️ Notes
Best used on 1m or 5m charts
Designed for CME index futures
Not a standalone trading system
Always manage risk
online Moment-Based Adaptive Detection🙏🏻 oMBAD (online Moment-Based Adaptive Detection): adaptive anomaly || outlier || novelty detection, higher-order standardized moments; at O(1) time complexity
For TradingView users: this entity would truly unleash its true potential for you ‘only’ if you work with tick-based & seconds-based resolutions, otherwise I recommend to keep using original non-online MBAD . Otherwise it may only help with a much faster backtesting & strategy development processes.
...
Main features :
O(1) time complexity: the whole method works @ O(1) time complexity, it’s lighting fast and cheap
HFT-ready: frequency, amount and magnitude of data points are irrelevant
Axiomatic: no need to optimize or to provide arbitrary hyperparameters, adaptive thresholds are completely data-driven and based on combination of higher-order central moments
Accepts weights: the method can gain additional information by accepting weights (e.g. volume weighting)
Example use cases for high-frequency trading:
Ordeflow analysis: can be applied on non-aggregated flow of market orders to gauge its imbalance and momentum
Liquidity provision: can be applied to high-resolution || tick data to place and dynamically adjust prices of limit orders
ML-based signals: online estimates of higher-order central moments can be used as features & in further feature engineering for trading signal generation
Operation & control: can be applied on PnL stream of your strategy for immediate returns analysis and equity control
Abstract:
This method is the online version of originally O(n) MBAD (Moment-Based Adaptive Detection) . It uses higher-order central & standardized moments to naturally estimate data’s extremums using all data while not touching order-statistics (i.e. current min and max) at all. By the same principles it also estimates “ever-possible” values given the data-generating process stays the same.
This online version achieves reduced time complexity to O(1) by using weighted exponential smoothing, and in particular is based on Pebay et al (2008) work, which provides mathematically correct results for the moments, and is numerically stable, unlike the raw sum-based estimates of moments.
Additionally, I provide adjustments for non-continuous lattice geometry of orderbooks, and correct re-quantization math, allowing to artificially increase the native tick size.
The guidelines of how to adjust alpha (smoothing parameter of exponential smoothing) in order to completely match certain types of moving averages, or to minimize errors with ones when it’s impossible to match; are also provided.
Mathematical correctness of the realization was verified experimentally by observing the exact match with the original non-recursive MBAD in expanding window mode, and confirmed by 2 AI agents independently. Both weighted and non-weighted versions were tested successfully.
...
^^ On micro level with moving window size 1
^^ With artificial tick size increase, moving window size 64
^^ Expanding window mode anchored to session start
^^ Demonstrates numerical stability even on very large inputs
...
∞

CVD Candle Divergence IndicatorThis indicator identifies potential reversal points by comparing the direction of price candles with the direction of cumulative volume delta (CVD) candles, while applying additional filters based on RSI behavior, volume strength, and candlestick wick structure.
It aims to highlight situations where price movement and volume delta disagree, which can signal fading momentum or absorption.
Core Concept
The script combines several independent conditions that must occur simultaneously before a signal is displayed on the chart. A signal appears only when all filters agree, reducing the number of low-quality or noise-based setups.
1. CVD Candle Direction
The indicator uses TradingView’s built-in function for volume delta candles. These candles summarize buying and selling aggression derived from lower-timeframe volume.
A CVD green candle indicates more buyer-initiated volume.
A CVD red candle indicates more seller-initiated volume.
The script looks for instances where price and CVD candles disagree:
Bullish signal: price candle is green while CVD candle is red
Bearish signal: price candle is red while CVD candle is green
This creates a form of divergence using volume delta instead of price highs and lows.
2. RSI Context Filter
Momentum is evaluated through RSI. Instead of relying only on standard overbought/oversold levels, the script also includes a recency filter based on the RSI midline (50 level).
RSI Threshold
Users can specify the RSI value required for bullish and bearish conditions.
Recency Filter
The indicator only allows signals if RSI has crossed the 50 level within a user-defined number of bars. This prevents signals during extended one-directional trends where divergence is less meaningful.
3. Volume Strength Filter
Signals are filtered through a volume-based requirement:
Current volume must exceed a moving average of volume multiplied by a user-defined factor.
This ensures that signals appear only during periods with sufficient participation and reduces noise during low-volume consolidation.
4. Wick-to-Body Ratio Filter
To incorporate price-action characteristics, the script evaluates the wick structure of each candle:
Bullish signals require a sufficiently large lower wick relative to the total candle range.
Bearish signals require a sufficiently large upper wick relative to the total candle range.
The wick percentage is fully configurable.
This adds a rejection or absorption component to the logic and prevents signals on weak or indecisive candles.
Signal Conditions
A bullish signal appears when all of the following are true:
Price candle is green
RSI is below the bullish threshold
CVD candle is red
Volume is above its threshold (if enabled)
RSI has interacted with the 50 level recently
Lower wick meets the wick-percentage requirement
A bearish signal requires the opposite conditions:
Price candle is red
RSI is above the bearish threshold
CVD candle is green
Volume is above its threshold (if enabled)
RSI recently interacted with the 50 level
Upper wick meets the wick-percentage requirement
Signals appear as arrows directly on the chart.
Use Cases
This indicator is intended for traders who work with:
Momentum shifts
Volume delta analysis
Candle structure-based confirmation
Reversal or exhaustion setups
Divergence concepts beyond price highs/lows
It does not predict market direction. Instead, it highlights areas where multiple conditions suggest a potential imbalance between price movement and volume delta.
I would strongly suggest to use this indicator only on timeframes 2-15m.
Here are a few examples:

EMA/Volume/Institutional Candle (Deep)This indicator is designed for short-term swing trading and intraday trend identification using a combination of EMA structure, momentum shifts, volume confirmation, and institutional footprint analysis.
🔹 Key Features
1. EMA Trend Framework (9, 20, 50, 200)
✔ EMA 9 & EMA 20: Ultra-short-term momentum; ideal for fast trend shifts.
✔ EMA 50: Medium-term trend guide; helps identify pullbacks vs. reversals.
✔ EMA 200: Long-term trend bias and major dynamic support/resistance.
2. EMA 9/20 Crossover Signal
✔ Bullish Crossover → EMA 9 crossing above EMA 20 indicates momentum expansion and early trend reversal.
✔ Bearish Crossover → EMA 9 crossing below EMA 20 shows momentum weakening and possible short-side opportunity.
3. High-Volume Zone Detection
✔ Highlights candles with volume spikes above average, signaling institutional interest.
✔ Useful for identifying breakout validity, liquidity grabs, or trap candles.
4. Institutional Candles (Smart Money Footprint)
✔ Automatically marks institutional order blocks, imbalance zones, or large displacement candles.
✔ Helps traders identify where smart money entered the market and potential mitigation zones.
🎯 How This Indicator Helps You Trade
✔ Quickly spot trend direction with multi-EMA alignment
✔ Identify high-probability entries with EMA 9/20 crossover + volume confirmation
✔ Find institutional zones for sniper-style entries
✔ Filter fake breakouts using volume spikes
✔ Perfect for stocks, indices, crypto, and forex

FusionPredict LiteFusionPredict Lite
Single-Timeframe Reversion Target Indicator
FusionPredict Lite highlights where price is statistically likely to revert toward equilibrium after momentum displacement.
Rather than chasing candles, this tool helps you see where price may want to go next — allowing for cleaner entries, better patience, and reduced emotional trading.
LINE COLORS
🟢 Green Line → Reversion target above current price (bullish bias)
🔴 Red Line → Reversion target below current price (bearish bias)
WHY THIS MATTERS
Knowing the reversion level helps you:
Avoid entering directly into a pullback
Anticipate where momentum may pause or unwind
Decide whether to wait for price to come to you or trade continuation confidently
This is useful not only for scalping, but also for timing cleaner entries during strong moves.
HOW TO USE
Watch how price approaches and reacts to the reversion line
Use it to plan entries without chasing price
Best on 1–5 minute charts, but works on all timeframes
Compatible with crypto, forex, futures, indices, and metals
WHAT THIS IS
FusionPredict Lite is the single-timeframe version of the FusionPredict engine.
It measures:
Momentum displacement
Oscillator imbalance
Volatility structure
…and projects where price may revert as energy normalizes.
PAIRS WELL WITH
Fusion Reversion Meter Lite™ — helps determine whether market conditions favor:
A clean move toward the target
Or a continuation without retracement
FULL VERSION
The full FusionPredict™ includes:
Multi-timeframe alignment (up to 6 timeframes)
Smart alerts and confluence logic
Advanced energy-aware projections
Available at fusionpredictor.com

11-MA Institutional System (ATR+HTF Filters)11-MA Institutional Trading System Analysis.
This is a comprehensive Trading View Pine Script indicator that implements a sophisticated multi-timeframe moving average system with institutional-grade filters. Let me break down its key components and functionality:
🎯 Core Features
1. 11 Moving Average System. The indicator plots 11 customizable moving averages with different roles:
MA1-MA4 (5, 8, 10, 12): Fast-moving averages for short-term trends
MA5 (21 EMA): Short-term anchor - critical pivot point
MA6 (34 EMA): Intermediate support/resistance
MA7 (50 EMA): Medium-term bridge between short and long trends
MA8-MA9 (89, 100): Transition zone indicators
MA10-MA11 (150, 200): Long-term anchors for major trend identification
Each MA is fully customizable:
Type: SMA, EMA, WMA, TMA, RMA
Color, width, and enable/disable toggle
📊 Signal Generation System
Three Signal Tiers: Short-Term Signals (ST)
Trigger: MA8 (EMA 8) crossing MA21 (EMA 21)
Filters Applied:
✅ ATR-based post-cross confirmation (optional)
✅ Momentum confirmation (RSI > 50, MACD positive)
✅ Volume spike requirement
✅ HTF (Higher Timeframe) alignment
✅ Strong candle body ratio (>50%)
✅ Multi-MA confirmation (3+ MAs supporting direction)
✅ Price beyond MA21 with conviction
✅ Minimum bar spacing (prevents signal clustering)
✅ Consolidation filter
✅ Whipsaw protection (ATR-based price threshold)
Medium-Term Signals (MT)
Trigger: MA21 crossing MA50
Less strict filtering for swing trades
Major Signals
Golden Cross: MA50 crossing above MA200 (major bullish)
Death Cross: MA50 crossing below MA200 (major bearish)
🔍 Advanced Filtering System1. ATR-Based ConfirmationPrice must move > (ATR × 0.25) beyond the MA after crossover
This prevents false signals during low-volatility consolidation.2. Momentum Filters
RSI (14)
MACD Histogram
Rate of Change (ROC)
Composite momentum score (-3 to +3)
3. Volume Analysis
Volume spike detection (2x MA)
Volume classification: LOW, MED, HIGH, EXPL
Directional volume confirmation
4. Higher Timeframe Alignment
HTF1: 60-minute (default)
HTF2: 4-hour (optional)
HTF3: Daily (optional)
Signals only trigger when current TF aligns with HTF trend
5. Market Structure Detection
Break of Structure (BOS): Price breaking recent swing highs/lows
Order Blocks (OB): Institutional demand/supply zones
Fair Value Gaps (FVG): Imbalance areas for potential fills
📈 Comprehensive DashboardReal-Time Metrics Display: {scrollbar-width:none;-ms-overflow-style:none;-webkit-overflow-scrolling:touch;} ::-webkit-scrollbar{display:none}MetricDescriptionPriceCurrent close priceTimeframeCurrent chart timeframeSHORT/MEDIUM/MAJORTrend classification (🟢BULL/🔴BEAR/⚪NEUT)HTF TrendsHigher timeframe alignment indicatorsMomentumSTR↑/MOD↑/WK↑/WK↓/MOD↓/STR↓VolatilityLOW/MOD/HIGH/EXTR (based on ATR%)RSI(14)Color-coded: >70 red, <30 greenATR%Volatility as % of priceAdvanced Dashboard Features (Optional):
Price Distance from Key MAs
vs MA21, MA50, MA200 (percentage)
Color-coded: green (above), red (below)
MA Alignment Score
Calculates % of MAs in proper order
🟢 for bullish alignment, 🔴 for bearish
Trend Strength
Based on separation between MA21 and MA200
NONE/WEAK/MODERATE/STRONG/EXTREME
Consolidation Detection
Identifies low-volatility ranges
Prevents signals during sideways markets
⚙️ Customization OptionsFilter Toggles:
☑️ Require Momentum
☑️ Require Volume
☑️ Require HTF Alignment
☑️ Use ATR post-cross confirmation
☑️ Whipsaw filter
Min bars between signals (default: 5)
Dashboard Styling:
9 position options
6 text sizes
Custom colors for header, rows, and text
Toggle individual metrics on/off
🎨 Visual Elements
Signal Labels:
ST▲/ST▼ (green/red) - Short-term
MT▲/MT▼ (blue/orange) - Medium-term
GOLDEN CROSS / DEATH CROSS - Major signals
Volume Spikes:
Small labels showing volume class + direction
Example: "HIGH🟢" or "EXPL🔴"
Market Structure:
Dashed lines for Break of Structure levels
Automatic detection of swing highs/lows
🔔 Alert Conditions
Pre-configured alerts for:
Short-term bullish/bearish crosses
Medium-term bullish/bearish crosses
Golden Cross / Death Cross
Volume spikes
💡 Key Strengths
Institutional-Grade Filtering: Multiple confirmation layers reduce false signals
Multi-Timeframe Analysis: Ensures alignment across timeframes
Adaptive to Market Conditions: ATR-based thresholds adjust to volatility
Comprehensive Dashboard: All critical metrics in one view
Highly Customizable: 100+ input parameters
Signal Quality Over Quantity: Strict filters prioritize high-probability setups
⚠️ Usage Recommendations
Best for: Swing trading and position trading
Timeframes: Works on all TFs, optimized for 15m-Daily
Markets: Stocks, Forex, Crypto, Indices
Signal Frequency: Conservative (quality over quantity)
Combine with: Support/resistance, price action, risk management
🔧 Technical Implementation Notes
Uses Pine Script v6 syntax
Efficient calculation with minimal repainting
Maximum 500 labels for performance
Security function for HTF data (no lookahead bias)
Array-based MA alignment calculation
State variables to track signal spacing
This is a professional-grade trading system that combines classical technical analysis (moving averages) with modern institutional concepts (market structure, order blocks, multi-timeframe alignment).
The extensive filtering system is designed to eliminate noise and focus on high-probability trade setups.

SMC-Math by Thomas v1📌 SMC-Math by Thomas v1 — Description
SMC-Math by Thomas v1 is a complete Smart Money Concepts toolkit designed for traders who want a clean, mathematical, and structured view of market mechanics.
Rather than relying on abstract concepts or subjective drawings, this indicator focuses on rules-based detection of:
✔ Order Blocks (OB)
✔ Fair Value Gaps (FVG)
✔ Market Structure shifts (BoS / CHoCH)
✔ HTF trend confirmation
✔ Premium / Discount arrays
✔ Equal High & Equal Low Liquidity Zones (no hinting — expiry only)
This version is engineered for stability, clarity, and performance — with fully optimized array management, timestamp-based cleanup, and a clean visual presentation suitable for both discretionary and systematic trading.
📌 Key Features
🔹 1. Order Blocks (Bullish & Bearish)
Auto-detected using fractal swing highs/lows
Optional displacement + high volume filters
Midline display option
HTF trend alignment filter
Smart expiry + broken OB cleanup
Custom opacity, buffer, and extension controls
🔹 2. Fair Value Gaps (FVG)
Bullish and bearish gap detection
HTF confirmation-based dimming
No border for a clean ICT-style visuals
Auto remove when filled
Fully rule-based
🔹 3. Market Structure (BoS / CHoCH)
Based on fractal highs/lows
Automatic labeling (small, unobtrusive)
Direction validated by HTF option
Each structure level plotted with a projected line
Smooth, clean BOS/CHOCH flow
🔹 4. Premium / Discount Zones
Auto-calculated from most recent swing high & swing low
Box shading dynamically updates each bar
Helps identify optimal trade areas (OB → FVG → PD array)
🔹 5. Liquidity Zones (Equal Highs & Equal Lows)
This tool highlights where liquidity is likely resting:
Detects Equal Highs and Equal Lows using your tolerance or max difference
Auto-creates borderless shaded boxes
Adjustable box height and extension
NO hinting logic — the box remains for exactly cleanupDelay bars, then expires
Clean and predictable behavior, ideal for rule-based setups
This is especially useful for:
identifying buy-side and sell-side liquidity pools
anticipating runs on liquidity
targeting sweeps
🔹 6. HTF Status Panel
Shows higher-timeframe trend status on the live bar:
Bullish
Bearish
Or “HTF Not Required”
Useful for aligning entries with larger market flow.
📌 How to Use SMC-Math by Thomas v1
1️⃣ Identifying Direction
Start by reading:
HTF Trend Label
BOS & CHOCH reactions
Bullish: look for HL → HH structure + bullish OBs + bullish FVGs
Bearish: look for LH → LL structure + bearish OBs + bearish FVGs
This creates your directional bias.
2️⃣ Using Order Blocks
An OB is valid when:
It appears in line with structure
HTF alignment supports it (optional toggle)
Price returns after a displacement
OB is not “broken” (indicator handles this visually)
Use OBs as:
Rebalance targets
Entry areas
Stop placement logic
3️⃣ Fair Value Gaps
FVGs appear when price dislocates and leaves inefficiency.
Use them to:
Refine entries inside OBs
Project premium/discount zones
Identify continuation zones
The indicator auto-removes FVGs when filled.
4️⃣ Liquidity Zones
Liquidity zones identify resting orders at equal highs/lows.
This version uses simple expiry logic:
Box is created when EQH/EQL forms
It remains visible for 20 bars (default)
It disappears automatically after expiry
No hint/confirmation triggers deletion
Usage tips:
Expect price to run toward these zones
Use them as targets or continuation markers
Combine with OB/FVG for confluence
5️⃣ Premium / Discount Zones
Use PD arrays to gauge:
Premium = optimal shorting zones
Discount = optimal long zones
Not trade “in the middle” unless a clear BOS or CHoCH happens
📌 Recommended Workflow
HTF Bias → Check the HTF panel
Market Structure → Identify trend continuation or reversal
Liquidity → Mark where price is likely to target
FVG → Identify imbalance zones
OB → Confirm institutional origin points
PD Arrays → Determine optimal trade location
Execute with confluence
📌 Who Is This Indicator For?
✔ Traders using ICT / SMC logic
✔ Traders wanting rule-based, non-subjective markups
✔ Traders who want automated detection without repainting
✔ Anyone who uses OB, FVG, liquidity sweeps, and structure shifts

TedAlpha – Structure / FVG / OB Sessions:
Only looks for trades when price is inside your defined London or NY time blocks.
CHOCH:
Uses pivots to track swing highs/lows, then flags a bullish CHOCH when structure flips from LL/LH to HH/HL, and vice versa for bearish.
FVG:
Detects 3-candle imbalance and keeps the zone “active” for fvgLookback bars, then checks if price trades back into it.
Order Blocks:
On a CHOCH, grabs the last opposite candle (bearish before bull CHOCH = bullish OB, bullish before bear CHOCH = bearish OB) and marks its body as the OB zone.
Signal:
A valid long = bull CHOCH + in session + (price inside bullish FVG and/or bullish OB, depending on toggles).
Short is the mirror image.
RR 1:3:
SL uses the last swing low (for longs) or last swing high (for shorts), TP is auto-set at 3× that distance and plotted as lines.

MBZ Model (Simplified Version) [NINE Θ]Overview
The MBZ Model Simplified is an advanced indicator designed to identify reversal zones through the detection of Median Body Zones (MBZs), Inversion Fair Value Gaps (IFVGs), and SMT Divergences. This indicator combines multiple trading concepts into a unified, streamlined tool for precision entries.
The core premise is simple: when price sweeps liquidity and immediately reverses with conviction, it creates a "Median Body Zone", an area where smart money has likely accumulated or distributed positions. These zones often act as powerful support/resistance levels for future price action.
Key Features
Liquidity Level MBZs — Detects reversal zones formed after liquidity sweeps at swing highs/lows
Type 4 (T4) MBZs — Identifies MBZs formed through Fair Value Gap inversions
Inversion Fair Value Gaps (IFVGs) — Tracks FVGs that flip polarity with directional alignment
Market Structure Levels — Displays minor and major buyside/sellside liquidity levels
SMT Divergences — Multi-symbol divergence detection tied to MBZ formations
HTF Open Levels — Power of Three (PO3) analysis with auto-timeframe pairing
Session Filters — Time-based filtering for precise setup validation
Smart Alerts — Forming and validated alerts for all MBZ types
Components Explained
1. Liquidity Level MBZs
Liquidity MBZs form when price:
Sweeps a swing high or swing low (taking liquidity)
Shows immediate rejection with a directional candle
Closes back through the body midpoint of the sweep candle
Bullish MBZ: Forms after a low sweep → Price reverses up aggressively
Bearish MBZ: Forms after a high sweep → Price reverses down aggressively
The zone is drawn from the sweep extreme to the close of the confirmation candle, creating a potential re-entry area if price returns.
Settings Include:
Direction filter (Both/Bullish/Bearish)
Display options (Box/Levels/Both/Close Level)
Zone transparency and colors
25/75% internal levels
Midline display
Historical display count (prioritizes zones closest to price)
PO3 Open alignment filter
2. Type 4 (T4) MBZs
T4 MBZs are a more refined entry model that combines Fair Value Gap analysis with reversal confirmation:
A Fair Value Gap forms in the market
Price returns to tap the FVG
A two-candle reversal pattern confirms the reaction
This creates a tighter, more precise zone compared to standard Liquidity MBZs.
Additional T4 Features:
Lookback period for FVG detection
Consolidation filter (prevents clustering of T4s within X bars)
Optional requirement for Liquidity MBZ directional alignment
Independent historical display settings
3. Inversion Fair Value Gaps (IFVGs)
IFVGs occur when a Fair Value Gap is violated (price closes through it), flipping its polarity:
A bullish FVG that gets closed below becomes a bearish IFVG
A bearish FVG that gets closed above becomes a bullish IFVG
Directional Alignment Feature:
When enabled (default), IFVGs only form when aligned with the current MBZ direction. This creates a cycle:
MBZ forms → Sets directional bias
IFVGs can now form in that direction
Reference MBZ invalidated - IFVG cycle stops
Waits for new MBZ to establish fresh direction
This prevents counter-trend IFVGs from cluttering your chart.
Settings Include:
Classic (box) or Line display style
Lookback filter for source FVGs
Cluster filter (cooldown between IFVGs)
Volume Imbalance inclusion option
Direction filter
MBZ directional alignment toggle
4. Market Structure Levels
Automatically detects and displays swing structure using a multi-timeframe swing detection algorithm:
Minor Levels: Intermediate-term swing highs and lows
Major Levels: Long-term swing highs and lows
Levels extend until filled (price trades through them) and can be customized with various label styles, colors, and display modes.
5. SMT Divergences
Smart Money Technique (SMT) Divergences detect when correlated instruments make divergent swing highs or lows — a potential sign of manipulation or reversal.
Auto-Detection Pairs:
Index Futures: NQ ↔ ES ↔ YM ↔ RTY
Metals: GC ↔ SI ↔ PL
Energy: CL ↔ RB ↔ NG
Key Feature: SMT lines only appear when there's a nearby MBZ in the corresponding direction, filtering out noise and highlighting only the most relevant divergences.
6. HTF Open Levels (PO3)
Displays higher timeframe open prices for Power of Three analysis:
Auto Timeframe Pairing: Automatically selects optimal HTF based on your chart
Vertical session markers: Shows HTF candle boundaries
Open level lines: Track where the HTF candle opened
Auto Pairing Logic:
Sub-1min → 5min
1-2min → 15min
3-4min → 1H
5-9min → 4H
10-59min → Daily
1-4H → Weekly
Daily → Monthly
7. Session Filters
Filter setups to only appear during specific trading sessions:
Two customizable session windows
Timezone selection (NY, Chicago, LA, London, Paris, Tokyo, Shanghai, Sydney)
Only applies on timeframes ≤ 1 hour
Perfect for traders who only trade specific killzones (London Open, NY AM, etc.)
8. PO3 Open Filters
Both Liquidity MBZs and T4 MBZs have optional PO3 alignment filters:
Aligned: Bullish MBZs below HTF open, Bearish above
Reversed: Bullish MBZs above HTF open, Bearish below
Both: No filtering
This helps align entries with the anticipated Power of Three expansion direction.
How to Use It
Basic Workflow:
Identify Bias: Look for a fresh MBZ (Liquidity or T4) to establish direction
Wait for Retest: Price often returns to test MBZ zones
Confirm with IFVGs: IFVGs forming in the same direction add confluence
Check SMT: SMT divergence near an MBZ increases probability
Enter at Zone: Look for lower timeframe confirmation at MBZ levels
Zone Levels:
Close Level: The confirmation candle's close — often the most reactive level
Midline (50%): Equilibrium of the zone
25%/75% Levels: Internal zone levels for precision entries
Invalidation:
Bullish MBZ invalidates on close below zone bottom
Bearish MBZ invalidates on close above zone top
Use "Delete Invalidated" setting to auto-remove or keep for reference
Alerts
The indicator includes comprehensive alerts:
MBZ Forming: Triggers when pattern is developing (before candle close)
MBZ Validated: Triggers when pattern confirms (after candle close)
Separate toggles for Liquidity MBZs and T4 MBZs
Alert messages include symbol and timeframe for easy identification.
Disclaimer
This indicator is a tool for analysis, not a trading system. Always:
Use proper risk management
Combine with your own analysis
Backtest before live trading
Understand that no indicator guarantees profits
Past performance does not indicate future results. Trade responsibly.

Fair Value Gap Signals [Kodexius]Fair Value Gap Signals is an advanced market structure tool that automatically detects and tracks Fair Value Gaps (FVGs), evaluates the quality of each gap, and highlights high value reaction zones with visual metrics and signal markers.
The script is designed for traders who focus on liquidity concepts, order flow and mean reversion. It goes beyond basic FVG plotting by continuously monitoring how price interacts with each gap and by quantifying three key aspects of each zone:
-Entry velocity inside the gap
-Volume absorption during tests
-Structural integrity and depth of penetration
The result is a dynamic, information rich visualization of which gaps are being respected, which are being absorbed, and where potential reversals or continuations are most likely to occur.
All visual elements are configurable, including the maximum number of visible gaps per direction, mitigation method (close or wick) and an ATR based filter to ignore insignificant gaps in low volatility environments.
🔹 Features
🔸 Automated Fair Value Gap Detection
The script detects both bullish and bearish FVGs based on classic three candle logic:
Bullish FVG: current low is strictly above the high from two bars ago
Bearish FVG: current high is strictly below the low from two bars ago
🔸 ATR Based Gap Filter
To avoid clutter and low quality signals, the script can ignore very small gaps using an ATR based filter.
🔸Per Gap State Machine and Lifecycle
Each gap is tracked with an internal status:
Fresh: gap has just formed and has not been tested
Testing: price is currently trading inside the gap
Tested: gap was tested and left, waiting for a potential new test
Rejected: price entered the gap and then rejected away from it
Filled: gap is considered fully mitigated and no longer active
This state machine allows the script to distinguish between simple touches, multiple tests and meaningful reversals, and to trigger different alerts accordingly.
🔸 Visual Ranking of Gaps by Metrics
For each active gap, three additional horizontal rank bars are drawn on top of the gap area:
Rank 1 (Vel): maximum entry velocity inside the gap
Rank 2 (Vol): relative test volume compared to average volume
Rank 3 (Dpt): remaining safety of the gap based on maximum penetration depth
These rank bars extend horizontally from the creation bar, and their length is a visual score between 0 and 1, scaled to the age of the gap. Longer bars represent stronger or more favorable conditions.
🔸Signals and Rejection Markers
When a gap shows signs of rejection (price enters the gap and then closes away from it with sufficient activity), the script can print a signal label at the reaction point. These markers summarize the internal metrics of the gap using a tooltip:
-Velocity percentage
-Volume percentage
-Safety score
-Number of tests
🔸 Flexible Mitigation Logic (Close or Wick)
You can choose how mitigation is defined via the Mitigation Method input:
Close: the gap is considered filled only when the closing price crosses the gap boundary
Wick: a full fill is detected as soon as any wick crosses the gap boundary
🔸 Alert Conditions
-New FVG formed
-Price entering a gap (testing)
-Gap fully filled and invalidated
-Rejection signal generated
🔹Calculations
This section summarizes the main calculations used under the hood. Only the core logic is covered.
1. ATR Filter and Gap Size
The script uses a configurable ATR length to filter out small gaps. First the ATR is computed:
float atrVal = ta.atr(atrLength)
Gap size for both directions is then measured:
float gapSizeBull = low - high
float gapSizeBear = low - high
If useAtrFilter is enabled, gaps smaller than atrVal are ignored. This ties the minimum gap size to the current volatility regime.
2. Fair Value Gap Detection
The basic FVG conditions use a three bar structure:
bool fvgBull = low > high
bool fvgBear = high < low
For bullish gaps the script stores:
-top as low of the current bar
-bottom as high
For bearish gaps:
-top as high of the current bar
-bottom as low
This defines the price range that is considered the imbalance area.
3. Depth and Safety Score
Depth measures how far price has penetrated into the gap since its creation. For each bar, the script computes a currentDepth and updates the maximum depth:
float currentDepth = 0.0
if g.isBullish
if l < g.top
currentDepth := g.top - l
else
if h > g.bottom
currentDepth := h - g.bottom
if currentDepth > g.maxDepth
g.maxDepth := currentDepth
The safety score expresses how much of the gap remains intact:
float depthRatio = g.maxDepth / gapSize
float safetyScore = math.max(0.0, 1.0 - depthRatio)
safetyScore near 1: gap is mostly untouched
safetyScore near 0: gap is mostly or fully filled
4. Velocity Metric
Velocity captures how aggressively price moves inside the gap. It is based on the body to range ratio of each bar that trades within the gap and rewards bars that move in the same direction as the gap:
float barRange = h - l
float bodyRatio = math.abs(close - open) / barRange
float directionBonus = 0.0
if g.isBullish and close > open
directionBonus := 0.2
else if not g.isBullish and close < open
directionBonus := 0.2
float currentVelocity = math.min(bodyRatio + directionBonus, 1.0)
The gap keeps track of the strongest observed value:
if currentVelocity > g.maxVelocity
g.maxVelocity := currentVelocity
This maximum is later used as velScore when building the velocity rank bar.
5. Volume Accumulation and Volume Score
While price is trading inside a gap, the script accumulates the traded volume:
if isInside
g.testVolume += volume
It also keeps track of the number of tests and the volume at the start of the first test:
if g.status == "Fresh"
g.status := "Testing"
g.testCount := 1
g.testStartVolume := volume
An average volume is computed using a 20 period SMA:
float volAvg = ta.sma(volume, 20)
The expected volume is approximated as:
float expectedVol = volAvg * math.max(1, (bar_index - g.index) / 2)
The volume score is then:
float volScore = math.min(g.testVolume / expectedVol, 1.0)
This produces a normalized 0 to 1 metric that shows whether the gap has attracted more or less volume than expected over its lifetime.
6. Rank Bar Scaling
All three scores are projected visually along the time axis as horizontal bars. The script uses the age of the gap in bars as the maximum width:
float maxWidth = math.max(bar_index - g.index, 1)
Then each metric is mapped to a bar length:
int len1 = int(math.max(1, maxWidth * velScore))
g.rankBox1.set_right(g.index + len1)
int len2 = int(math.max(1, maxWidth * volScore))
g.rankBox2.set_right(g.index + len2)
int len3 = int(math.max(1, maxWidth * safetyScore))
g.rankBox3.set_right(g.index + len3)
This creates an intuitive visual representation where stronger metrics produce longer rank bars, making it easy to quickly compare the relative quality of multiple FVGs on the chart.

DuoBlocks — ICT Order Block DetectorDuoBlocks — ICT Order Block Detector
⚪ Overview
DuoBlocks detects bullish and bearish Order Blocks that form immediately under/over a valid Fair Value Gap. Each zone inherits its height from ATR, so the OB reflects realistic volatility instead of fixed candlestick based values. This makes the zones more adaptive, cleaner, and more faithful to ICT(Inner Circle Trader)-style OB identification.
The indicator displays only the most relevant live block — the one that price is most likely to interact with next.
⚪ Core Logic
DuoBlocks evaluates a two-bar displacement to confirm a real gap (FVG behavior). When a valid upward or downward gap forms, it captures the origin candle as the potential OB and builds the zone using:
• ATR-based height → natural volatility-scaled zone width
• Gap validation above/below price → ensures it’s a true imbalance
• ICT-style logic → the OB sits directly behind the displacement/FVG
• Adaptive time-frame filter → different gap thresholds for <1h and ≥1h charts
• Lookback limit → prevents ancient blocks from cluttering the chart
• Automatic invalidation → block dies if price breaks its boundary
Only surviving blocks remain active, giving a clean and trustworthy supply/demand map.
⚪ Block Selection Engine
When multiple OBs exist, DuoBlocks automatically picks the most relevant:
Bearish OB (supply)
• Must sit above current price
• Chooses the nearest one overhead
• If equal → prefers the newest
• Optional fallback to the closest OB if none sit above price
Bullish OB (demand)
• Must sit below current price
• Chooses the nearest underfoot OB
• If equal → prefers the newest
• Optional fallback enabled in no-OB conditions
⚪ Midline System
Each active OB can show a “midline” at its exact center:
⚪ Inputs & Controls
• ATR length
• Right-side zone extension
• Lookback depth
• Max stored OBs per side
• Optional nearest-fallback
• Toggleable midline + width control
• Custom bull/bear colors
Disclaimer
This script is for educational purposes only and is not financial advice. Trading involves risk, and you are fully responsible for your decisions and results.

CRT Inside Hunter + FVG (Final Fusion)CRT Inside Hunter + FVG (Final Fusion)
This indicator automatically detects Inside Bar → CRT (Consolidation – Range – Trap) structures and generates LONG / SHORT BAM breakout signals whenever the mother bar is violated.
It also includes optional Fair Value Gap (FVG) confirmation.
🔍 1. Inside Bar → Mother Bar Detection
Automatically identifies inside bar sequences.
Creates the Mother Bar with High / Low boundaries.
Draws Q1 – Mid – Q3 levels as visual guidance.
Auto-removes CRT structure after a user-defined number of bars.
🚨 2. BAM Breakout Signals
Breakout events trigger automatic trade signals:
Upper violation → SHORT signal
Lower violation → LONG signal
Signals are displayed as labels and fully support alerts.
🟦 3. FVG (Fair Value Gap) Confirmation
Optional FVG detection mode:
Automatically marks Demand and Supply FVG zones.
If the price touches an FVG at the breakout moment, the signal becomes FVG-Confirmed.
🎨 4. Additional Features
Inside bars highlighted for clarity.
Clean, minimal drawing system.
All drawings reset daily for maximum chart hygiene.
This tool combines liquidity, imbalance, breakout logic and provides a powerful structure for scalping and intraday trading.

LiquidityPulse Higher Timeframe Consecutive Candle Run LevelsLiquidityPulse Higher Timeframe Consecutive Candle Run Levels
Research suggests that financial markets can alternate between trend-persistence and mean-reversion regimes, particularly at short (intraday) or very long timeframes. Extended directional moves, whether prolonged intraday rallies or sell-offs, also carry a statistically higher chance of retracing or reversing (Safari & Schmidhuber, 2025). In addition, studies examining support and resistance behaviour show that swing highs or lows formed after strong directional moves may act as structurally and psychologically important price levels, where subsequent price interactions have an increased likelihood of stalling or bouncing rather than passing through directly (Chung & Bellotti, 2021). By highlighting higher-timeframe candle runs and marking their extremal levels, this indicator aims to display areas where directional momentum previously stopped, providing contextual "watch levels" that traders may incorporate into their broader analysis.
How this information is used in the indicator:
When a sequence of consecutive higher-timeframe candles prints in the same direction, the indicator highlights the lower-timeframe chart with a green or red background, depending on whether the higher-timeframe run was bullish or bearish. The highest high (for a bull run) or lowest low (for a bear run) of that sequence forms a recent extremum, and this value is plotted as a swing-high or swing-low level. These levels appear only after the required number of consecutive higher-timeframe candles (set by the user) have closed, and they continue updating as long as the higher-timeframe streak remains intact. A level "freezes" and stops updating only when an opposite-colour higher-timeframe candle closes (e.g., a red candle ending a bull run, or a green candle ending a bear run). Once frozen, the level remains fixed to preserve that structural information for future analysis or retests. The number of past bull/bear levels displayed on the chart is also adjustable in the settings.
Why capture a level after a long directional run:
When price moves in one direction for several consecutive candles (e.g. 4, 5, or more), it reflects strong directional bias, often associated with momentum, liquidity imbalance, or liquidity grabs. Once that sequence breaks, the final level reached marks a point of exhaustion or structural resistance/support, where that bias failed to continue. These inflection points are often used by traders and trading algorithms to assess potential reversals, retests, or breakout setups. By freezing these levels once the run ends, the indicator creates a map of historically significant price zones, allowing traders to observe how price behaves around them over time.
Additional information displayed by the indicator:
Each detected run includes a label showing the run length (the number of consecutive higher-timeframe candles in the streak) along with the source timeframe used for detection. The indicator also displays an overstretch marker: this numerical value appears when the total size of the candle bodies within the run exceeds a user-defined multiple of the average higher-timeframe body size (default: 1.5x). This helps highlight runs that were unusually strong or extended relative to typical volatility. You can also enable alerts that trigger when this overstretch ratio exceeds a higher threshold.
Key Settings
Timeframe: Choose which HTF to analyse (e.g., 15m, 1h, 4h)
Minimum Candle Run Length: Define how many consecutive candles are needed to trigger a level (e.g., 4)
Overstretch Settings: Customize detection threshold and alert trigger (in multiples of average body size)
Background Tints: Enable/disable visual highlights for bull and bear runs
Display Capacity: Choose how many past bull/bear levels to show
How Traders Can Use This Indicator
Traders can:
-Watch levels for retests, reversals, breakouts, or consolidation
-Identify areas where price showed strong directional conviction
-Spot extended or aggressive moves based on overstretch detection
-Monitor how price reacts when retesting prior run levels
-Build confluence with your existing levels, zones, or indicators
Disclaimer
This tool does not reflect true order flow, liquidity, or institutional positioning. It is a visual aid that highlights specific candle behaviour patterns and does not produce predictive signals. All analysis is subject to interpretation, and past price behaviour does not imply future outcomes.
References:
Trends and Reversion in Financial Markets on Time Scales from Minutes to Decades (Sara A. Safari & Christof Schmidhuber, 2025)
Evidence and Behaviour of Support and Resistance Levels in Financial Time Series (Chung & Bellotti, 2021)

AR–Volumized Blocks & S&DAR–Volumized Blocks & S&D is a clean, price-action order-block tool that automatically detects Bullish & Bearish Order Blocks (OB), tracks their evolving state into Mitigation Blocks (MB) and Breaker Blocks (BB), and adds a volumetric overlay showing an estimated split between buyers vs sellers inside each zone. It also includes a lightweight Supply & Demand (S&D) module with the same buy/sell visualization.
This indicator is designed to keep the chart readable: zones are drawn with thin boundaries, optional breaker fill, short reference lines, centered labels, and shortened volumetric bars (instead of huge full-width blocks).
________________________________________
What it draws
1) Order Blocks with State Tracking
Each detected Order Block is shown with:
• Top/Bottom boundaries (thin lines)
• A zone container (mostly invisible for OB/MB, semi-filled for BB)
• A label that updates live with:
o Total zone volume
o Volumetric balance %
o Current state: OB / MB / BB
o Optional extra line: Buy vs Sell estimate
States
• OB (Order Block): Newly detected zone, still valid.
• MB (Mitigation Block): Zone has been touched by price (mitigated) but not broken.
• BB (Breaker Block): Zone has been invalidated (broken through) and becomes a breaker.
Optional BB cleanup
• “Hide invalidated BB” can auto-remove breaker blocks that become invalid again (to keep the chart clean and only show active breakers).
________________________________________
2) Supply & Demand Zones
Supply & Demand zones are detected using pivot logic:
• Supply: pivot highs → zone from pivot high down to pivot candle body area
• Demand: pivot lows → zone from pivot low up to pivot candle body area
They are drawn as:
• A zone holder + thin lines
• A label (“Supply” / “Demand”), with optional volumetric text
• Optional buy/sell volumetric bars, same style as OB/BB/MB
S&D zones are removed completely once broken (clean and decisive behavior).
________________________________________
Volumetric Buy/Sell (the mini bars + text)
This script adds an extra layer called Volumetric (Buy/Sell):
-Volumetric Bars (short + clean)
Inside each zone, it can draw two small stacked bars:
• Top half: Buy volume (green)
• Bottom half: Sell volume (red)
You can choose:
• Display side (Left or Right of the zone)
• Bar length in bars (shortened by design)
• Transparency
-Volumetric Text (buyers vs sellers)
The label can optionally show:
• B 123K | S 98K
So you instantly see who dominated in that block.
Important Note (Very Honest)
These buy/sell numbers are NOT real bid/ask delta.
They are an estimate based on candle direction:
• If a candle closes green (close ≥ open) → its volume is counted as “buy”
• If it closes red (close < open) → its volume is counted as “sell”
This is still extremely useful for visual confirmation, but it is not a broker-level footprint.
________________________________________
Detection Logic Summary (simple + effective)
Order Block detection (swing-based)
• Uses a swing finder to identify relevant turning points.
• Confirms OB creation on a breakout beyond the swing level.
• Builds the OB range by walking backward to capture the strongest base candle area.
• Filters out oversized zones using ATR × Max OB height filter.
Zone lifetime handling
• Zones extend forward automatically.
• OB becomes MB on first meaningful touch.
• OB becomes BB if violated in the opposite direction.
• BB can optionally be hidden if it becomes invalid (depending on your settings).
________________________________________
Inputs & Customization
Detection
• Swing length (OB): controls sensitivity. Lower = more zones, higher = fewer stronger zones.
• Use candle body for extremes: reduces wick noise by using candle bodies for boundaries.
• ATR filter: avoids huge messy blocks (keeps zones tradable).
• Max zones to keep: keeps chart lightweight.
Visual
• Bull/Bear colors
• Label size
• Forward extension
• Short line length
• Label offset
Supply & Demand
• Enable/disable S&D
• Pivot swing length
• Forward extension, line length
• Label offset X and Y (ticks)
• Max S&D zones
Volumetric Buy/Sell
• Turn bars on/off
• Turn text on/off
• Bars side (left/right)
• Bar length (short, by bars)
• Bar transparency
________________________________________
How to use (practical workflow)
For Entries
• Use Bullish OB / Demand as a potential buy zone after a displacement up.
• Use Bearish OB / Supply as a potential sell zone after a displacement down.
• Look for confluence:
o market structure shift / BOS + displacement candle + return to OB/MB
For Bias Filtering
• The buy/sell split helps you quickly sanity-check:
o A “bullish OB” that shows heavy sell dominance might be weaker (and vice versa)
o Strong imbalance zones often show a clear dominance split
For Risk Management
• BB zones are great “line in the sand” areas.
• Use zone boundaries for invalidation, with your own model rules.
________________________________________
Performance Notes
This script is built with object limits in mind and includes:
• max_boxes_count, max_lines_count, max_labels_count
• Cleanup logic when max zones are exceeded
• Optional hiding of invalid breakers to reduce clutter
________________________________________
Disclaimer
This tool provides technical visualization and estimated volumetric info based on candle direction. It does not represent true order flow, bid/ask delta, or broker tape. Always risk-manage properly and confirm with your trading plan.
Institutional Trend & Liquidity Nexus [Pro]Concept & Methodology
The core philosophy of this script is "Confluence Filtering." It does not simply overlay indicators; it forces them to work together. A signal is only valid if it aligns with the macro trend and liquidity structure.
Key Components:
Trend Engine: Uses a combination of EMA (7/21) for fast entries and SMA (200) for macro trend direction. The script includes a logical filter that invalidates Buy signals below the SMA 200 to prevent counter-trend trading.
Liquidity Imbalance (FVG): Automatically detects Fair Value Gaps to identify areas where price is likely to react. Unlike standalone FVG scripts, this module is visually optimized to show support/resistance zones without obscuring price action.
Smart Confluence Zones (Originality):
The script calculates a background "State" based on multiple factors.
Bullish Zone (Green Background): Triggers ONLY when Price > SMA 200 AND RSI > 50 AND Price > Baseline EMA.
Bearish Zone (Red Background): Triggers ONLY when Price < SMA 200 AND RSI < 50 AND Price < Baseline EMA.
This visual aid helps traders stay out of choppy markets and only focus when momentum and trend are aligned.
█ How to Use
Entry: Wait for a "Triangle" signal (Buy/Sell).
Validation: Check the Background Color. Is it highlighting a Confluence Zone?
Example: A Buy Signal inside a Green Confluence Zone is a high-probability setup.
Example: A Buy Signal with no background color suggests weak momentum and should be taken with caution.
Targets: Use the plotted FVG boxes as potential take-profit targets or re-entry zones.

HTF Frequency Zone [BigBeluga]🔵 OVERVIEW
HTF Frequency Zone highlights the dominant price level (Point of Control) and the full high–low expansion of any higher timeframe — Daily, Weekly, or Monthly. It captures the frequency of closes inside each HTF candle and plots the most traded “frequency zone”, allowing traders to easily see where price spent the most time and where buy/sell pressure accumulated.
This tool transforms each higher-timeframe bar into a fully visualized structure:
• Top = HTF high
• Bottom = HTF low
• Midline = HTF Frequency POC
• Color-coded zones = bullish or bearish bias
• Labels = counts of bullish and bearish candles inside the HTF range
It is designed to give traders an immediate understanding of high-timeframe balance, imbalance, and price attraction zones.
🔵 CONCEPTS
HTF Partitioning — Each Weekly/Daily/Monthly candle is converted into a dedicated zone with its own High, Low, and Frequency Point of Control.
Frequency POC (Most Touched Price) — The indicator divides the HTF range into 100 bins and counts how many times price closed near each level.
Dominant Zone — The level with the highest frequency becomes the HTF “Value Zone,” plotted as a bold central line.
Directional Bias —
• Bullish HTF zone
• Bearish HTF zone
Internal Candle Counting — Within each HTF period the indicator counts:
• Buy candles (close > open)
• Sell candles (close < open)
This reveals whether intraperiod flow was bullish or bearish.
HTF Structure Blocks — High, Low, and POC are connected across the entire higher-timeframe duration, showing the real shape of HTF balance.
🔵 FEATURES
Automatic HTF Zone Construction — Generates a complete price zone every time the selected timeframe flips (Daily / Weekly / Monthly).
Dynamic High & Low Extraction — The indicator scans every bar inside the HTF window to find true extremes of the range.
100-Level Frequency Scan — Each close within the period is assigned to a bin, creating a detailed distribution of price interaction.
HTF POC Highlighting — The most frequent price level is plotted with a bold red line for immediate visual clarity.
Bull/Bear Coloring —
• Green → Bullish HTF zone.
• Orange → Bearish HTF zone.
Zone Shading — High–Low range is filled with a semi-transparent color matching trend direction.
Buy/Sell Candle Counters — Printed at the top and bottom of each HTF block, showing how many internal candles were bullish or bearish.
POC Label — Displays frequency count (how many touches) at the POC level.
Adaptive Threshold Warning — If bars inside the HTF window are too few (<10), the indicator warns the trader to switch timeframe.
🔵 HOW TO USE
Higher-Timeframe Biasing — Read the zone color to determine if the HTF candle leaned bullish or bearish.
Value Zone Reactions — Price often reacts to the Frequency POC; use it as support/resistance or liquidity magnet.
Range Context — Identify when price is trading near HTF highs (breakout potential) or lows (reversal potential).
Momentum Evaluation — More bullish internal candles = internal buying pressure; more bearish = internal selling pressure.
Swing Trading — Use HTF zones as the “macro map,” then execute trades on lower timeframes aligned with the zone structure.
Liquidity Awareness — The HTF POC often aligns with algorithmic liquidity levels, making it a strong reaction point.
🔵 CONCLUSION
HTF Frequency Zone transforms raw higher-timeframe candles into detailed distribution zones that reveal true market behavior inside the HTF structure. By showing highs, lows, buying/selling activity, and the most interacted price level (Frequency POC), this tool becomes invaluable for traders who want to align executions with powerful HTF levels, liquidity magnets, and structural zones.

T-DOW-FLOW: Final Edition
T-DOW-FLOW: Market Structure & Smart Pivot Zones
This indicator is a comprehensive technical analysis tool designed to visualize "Market Structure" based on Dow Theory and precise Supply/Demand Zones. It helps traders identify the true market trend and high-probability reaction levels by analyzing raw price action (ZigZag Pivots) rather than lagging indicators.
The script integrates three core systems:
ZigZag Trend Cloud: Visualizes the market bias (Uptrend/Downtrend).
Smart Pivot Zones (Type 1): Highlights the specific "Wick-to-Body" area of recent pivots.
Auto Density Channels (Type 2): Detects historical support/resistance clusters.
1. ZigZag Trend Identification
Logic: The script utilizes ta.highestbars and ta.lowestbars to detect Swing Highs and Swing Lows.
Trend Cloud:
If the structure creates a Higher High, the background cloud turns Green (Uptrend).
If the structure creates a Lower Low, the background cloud turns Red (Downtrend).
This provides an instant visual filter for "Trend Flow," encouraging traders to trade only in the direction of the dominant market structure.
2. SR Type 1: Smart Pivot Zones (Wick-to-Body)
Unlike standard indicators that draw thin lines at the absolute High/Low, this script focuses on the "Imbalance Zone".
It calculates the price range between the Pivot's Wick and the Pivot's Body (Open/Close) and fills this area with a colored zone.
Why? The area between the wick and body often represents the precise zone where institutional orders were filled, acting as a more reliable support/resistance level than a single price point.
3. SR Type 2: Auto Density Channels
This module scans a significant amount of historical data (default: 300 bars) to find clusters of pivot points.
Areas where multiple pivots align within a specific width are drawn as Channels. These represent strong, long-term psychological levels.
Trend Filter: Check the Trend Cloud color.
Green: Look for Long opportunities.
Red: Look for Short opportunities.
Entry Trigger: Wait for the price to retrace into a Smart Pivot Zone (Type 1) or an Auto Channel (Type 2).
Look for price rejection (wicks) at these zones in the direction of the Trend Cloud.
Structure Confirmation: Use the ZigZag lines and labels (HH, HL, etc.) to confirm that the market structure is still intact before entering.
ZigZag Settings: Adjust the sensitivity of the trend detection.
SR Type 1: Toggle the "Wick-to-Body" fill and choose between Wicks or Bodies as the primary source.
SR Type 2: Adjust the historical loopback period and channel width sensitivity.
This script is for educational and technical analysis purposes only. Past performance does not guarantee future results.
(以下、日本語説明 / Japanese Description)
このインジケーターは、「ダウ理論」に基づくトレンド判定と、精密な「需給ゾーン(Supply/Demand)」を可視化するための市場構造分析ツールです。 遅行指標を使わず、純粋なプライスアクション(ZigZagピボット)に基づいて、機関投資家の意識する価格帯を特定します。
1. ZigZagトレンドクラウド
ロジック: 一定期間の高値・安値を検出し、ダウ理論に基づいてトレンドを判定します。
視覚化: 高値切り上げ(上昇トレンド)なら「緑」、安値切り下げ(下落トレンド)なら「赤」の背景色を表示します。これにより、トレードすべき方向(順張り)を一目で判断できます。
2. SR Type 1: スマートピボットゾーン (Wick-to-Body)
単なる水平線ではなく、ローソク足の**「ヒゲ先」から「実体」までの価格差**をゾーンとして塗りつぶして表示します。
理由: ヒゲと実体の間の領域は、大口の注文が執行された(需給の不均衡が発生した)重要なエリアであることが多く、ピンポイントのラインよりも信頼性の高い反発ゾーンとして機能します。
3. SR Type 2: オート・デンシティ・チャネル
過去の長期間(デフォルト300本)のデータをスキャンし、ピボットが密集している価格帯を自動で「チャネル」として描画します。長期的に意識される強力なレジサポ帯です。
環境認識: 背景のトレンドクラウドの色に従い、目線を固定します。
エントリー: 価格がSRゾーン(Type 1)やチャネル(Type 2)に引きつけて、反発する動きを確認してエントリーします。
構造確認: ZigZagラインとラベル(HH/HLなど)を見て、トレンドが崩れていないことを確認します。

Alt Trading: Asia Fibonacci Strategy
The Alt Trading: Asia Fibonacci Strategy is a session-anchored liquidity and Fibonacci engine designed for traders who want to systematically exploit the overnight Asia range instead of just marking it and guessing. It automatically profiles the Asia session to build a precise high–low liquidity band, then waits for clean sweeps of that range before it will even consider a setup forcing every idea to start from an objective liquidity event. Behind the scenes, a swing-based structure model defines the dominant leg and projects a true, directionally-aligned Fibonacci map, extending down for long scenarios and up for shorts so the premium/discount zones are never “mirrored” or visually inverted. Key extension bands are converted into forward-projected price zones, with dedicated entry corridors that only activate once price has both raided the Asia high/low and traded back into the correct Fibonacci pocket. A lightweight FVG engine tracks the most recent opposing Fair Value Gap and uses its invalidation as a final confirmation step, so your long setups only trigger when a bearish imbalance has been meaningfully reclaimed and vice versa for shorts. The result is a minimal but strict playbook: sweep the Asia range, respect the leg, touch the fib zone, invalidate the opposing FVG, then and only then print a clean visual marker on the chart. Transparent fib blocks, trigger FVG highlights, and compact “double-circle” text markers keep the chart readable even on lower timeframes, while still giving you a clear sense of where the setup originated and which liquidity it’s built around. All colors and visual layers are customizable, making it easy to blend the tool into your existing layout while preserving the core logic. Rather than trying to predict the entire session, Asia Fibonacci Strategy turns one of the most consistent structures in the market overnight range and its sweep into a repeatable, rule-driven framework for high-quality intraday entries.

FVG Supply and DemandThis indicator combines powerful tools into one:
• Supply & Demand Zones built from swing highs/lows with ATR-based zone width, POI markers, and Break-of-Structure (BOS) detection.
• Volumized Fair Value Gaps (FVGs) showing bullish/bearish gaps, total volume inside the gap, volume distribution, optional zone-combining, and auto-cleanup.
• Swing TSL Line and manage bar color.
It helps visualize key imbalance areas, institutional zones, and price reaction points.
Credits to the Author.
⚠️ Disclaimer
This indicator is provided for educational and analytical purposes only.
It does not provide trading advice.
Past results do not guarantee future outcomes.
Use responsibly and in conjunction with your market analysis.

BuLLzEyE_MNQ FVG/IFVG SystemFVG Boxes
These are the main trading zones. The indicator automatically detects Fair Value Gaps and draws boxes on your chart:
• GREEN boxes = Bullish FVG (potential buy zone)
• RED boxes = Bearish FVG (potential sell zone)
• YELLOW boxes = IFVG (Inverse FVG - filled gaps that now act as support/resistance)
• GRAY boxes = Mitigated FVG (gap has been filled)
• WHITE dashed line = 50% level (optimal entry point within the FVG)
Session Boxes
Session boxes show you the high/low range of each major trading session. This helps identify where liquidity sits:
• PURPLE = Asia Session (6:00 PM - 3:00 AM ET)
• BLUE = London Session (3:00 AM - 12:00 PM ET)
• ORANGE = New York Session (9:30 AM - 4:00 PM ET)
• TEAL = Sydney Session (5:00 PM - 2:00 AM ET)
• LIME GREEN = Kill Zone / London-NY Overlap (8:00 AM - 11:00 AM ET) - BEST TRADING TIME
Entry Signals
• GREEN triangle pointing UP = Long entry signal at a Bullish FVG (not 100% reliable)
• RED triangle pointing DOWN = Short entry signal at a Bearish FVG (not 100% reliable)
Liquidity Sweeps
• RED X with 'SWEEP' = Previous Day High (PDH) was swept
• GREEN X with 'SWEEP' = Previous Day Low (PDL) was swept
• Dotted lines = PDH (red) and PDL (green) levels
Information Tables
HTF Bias Table (Top Right): Shows whether the higher timeframe (default 15m) is bullish or bearish, the number of active FVGs, and whether you're in the trading session.
Risk Calculator Table (Bottom Right): Shows your risk amount and calculates how many contracts you can trade for different stop loss sizes (5pt, 10pt, 15pt).
How It Works
What is a Fair Value Gap?
A Fair Value Gap (FVG) is a 3-candle pattern where aggressive buying or selling creates a price void. Specifically, it's when the wick of the first candle doesn't overlap with the wick of the third candle, leaving a gap in between. Price tends to return to these gaps to 'rebalance' before continuing in the original direction.
What is an Inverse FVG?
When an FVG gets filled (price returns and closes through the gap), it becomes an Inverse FVG (IFVG). These zones flip their polarity - a filled Bullish FVG becomes resistance, and a filled Bearish FVG becomes support. The indicator automatically converts mitigated FVGs to yellow IFVG boxes.
The 50% Entry Level
The dashed white line in each FVG represents the 50% level (also called Consequent Encroachment). This is considered the optimal entry point - it's the middle of the imbalance where price is most likely to react.
Suggested Trading Strategy
1. Check HTF Bias (top right table) - only trade in that direction
2. Wait for a liquidity sweep (SWEEP label appears)
3. Look for an FVG to form AFTER the sweep
4. Enter when price returns to the 50% level (dashed line)
5. Place stop loss below/above the FVG (add 2 ticks buffer)
6. Take profit at 1:2 or 1:3 risk-to-reward ratio
Settings Explained
FVG Settings
• Min FVG Size: Minimum gap size in points to be considered valid (default: 2.0)
• Max FVG Age: How many bars until an FVG is removed from chart (default: 50)
• Show 50% Entry Level: Toggle the dashed entry line on/off
Session Settings
• Show Session Boxes: Toggle all session boxes on/off
• Max Sessions to Show: How many historical sessions to display (default: 5)
• Individual Session Toggles: Turn each session (Asia/London/NY/Sydney/Kill Zone) on or off
Risk Calculator Settings
• Account Size: Your trading account balance
• Risk Per Trade: Percentage of account to risk per trade (default: 0.5%)
• Tick Value/Size: Contract specifications for MNQ ($0.50 per tick, 0.25 point tick size)
Tips for Best Results
1. Trade during the Kill Zone (8:00-11:00 AM ET) for best volatility and liquidity
2. Always align trades with HTF bias - don't fight the trend
3. Wait for liquidity sweeps before entering - this confirms smart money activity
4. Use the 50% level for entries - it offers the best risk-to-reward
5. Watch for IFVG zones as additional confluence for entries
6. Use the risk calculator to size positions properly - never risk more than you can afford
7. Session boxes help identify where stops are clustered - sweeps of these levels often precede reversals
Available Alerts
• New FVG Formed (Bullish or Bearish)
• Price Touching 50% Entry Level
• FVG Mitigated (gap filled)
• Long Entry Signal
• Short Entry Signal
• PDH/PDL Liquidity Sweep
─────────────────────────────────────
Created by BullyTrading
Designed for MNQ Prop Firm Trading

Tesseract X-RayTesseract X-Ray — Smart Money Concept indicator that reveals hidden market structure.
Features:
• Fair Value Gaps (FVG) — imbalance zones where price tends to return
• Order Blocks (OB) — institutional supply/demand zones
• Volume Profile — POC, VAH, VAL levels
• High Volume Nodes (HVN) — liquidity clusters
Clean visualization with automatic zone detection and mitigation tracking.
Built-in alerts for key level touches.
by @TesseractCrypto

Forex Knack — Premium Smart Money Indicator📈 Forex Knack — Premium Smart Money Indicator
Developed by Vineesh Rohini
Forex Knack is an invite-only, institutional-grade Smart Money Concepts toolkit built for traders who want clarity, precision and high-quality confluence — without leaking the internal logic.
This indicator combines market structure mapping, dynamic trend shifts, valuation zones and multi-layer confirmation into a clean, professional interface suitable for Forex, XAUUSD (Gold), Crypto and major Indices.
★ Core Benefits
- ✅ Cleaner Market Structure: Live BOS / CHoCH mapping for internal + swing structure.
- ✅ Directional Clarity: Proprietary “Shift” model to identify buy/sell phases.
- ✅ Confluence Signals: Combo confirmations when structure + momentum align.
- ✅ Premium / Discount Zones: Automatic institutional zones for better entries.
- ✅ Order Block Visuals: Internal & swing order block identification.
- ✅ Fair Value Gaps (optional): Imbalance highlighting for tactical entries.
- ✅ Momentum Confirmation: Oscillator-based trend confirmation.
- ✅ Strong / Weak Highs & Lows: Quick strength/weakness view for swing decisions.
🚫 What’s NOT included
- No full strategy code or secret formulas are revealed.
- Not a turnkey “auto-trade” bot — it is a professional decision-support tool.
🔒 Invite-only Access
This script is invite-only: the source code is fully protected and hidden.
You may apply for access; approved users can add the indicator to their charts but **will never** see the source code.
📬 How to request access
1. Follow the author profile on TradingView.
2. Send a message with your TradingView username and the note:
“Requesting access to Forex Knack indicator.”
(Access is granted manually after verification.)
⚠ Disclaimer
For educational purposes only. Not financial advice. Use with proper risk management.
© Vineesh Rohini — Forex Knack
