Indicator: Custom COG channelThis is my custom channel (Bear Channel!? :)) derived from BB/STARC. It uses both ATR/STDEV for plotting the bounds.
I use COG (Center of Gravity) for deriving the baseline. This enables it to track the price action better than many other channels that make use of MAs or simply "close". Indicator also marks "squeezes" (stdev bands come inside ATR bands). Pay attention to these, as these usually indicate a move.
I am still exploring this indicator on different BTCUSD time frames, would love to hear your feedback / setups for other instruments.
Code for this indicator: pastebin.com
Code for COG fibs I mentioned in the comments: pastebin.com
Search in scripts for "indicator"

3 new Indicators - PGO / RAVI / TIIMy "to-publish" list is getting too big, so decided to push out 3 indicators in the same chart
Feel free to "make mine" and use :) Leave a comment on what you think.
Pretty Good Oscillator
----------------------------------------
This indicator, by Mark Johnson, measures the distance of the current close from its N-day simple moving average, expressed in terms of an average true range (see Average True Range) over a similar period. So for instance a PGO value of +2.5 would mean the current close is 2.5 average days' range above the SMA.
Johnson's approach was to use it as a breakout system for longer term trades. If the PGO rises above 3.0 then go long, or below -3.0 then go short, and in both cases exit on returning to zero (which is a close back at the SMA). Indicator marks all these areas (3/-3/0)
Rapid Adaptive Variance Indicator
---------------------------------------------------------
RAVI is a simple indicator, by Tushar Chande, to show whether a stock is trending or not. Unlike ADX, RAVI measures only the trend intensity, it doesn't distinguish which way the trend is going. Rising RAVI shows the beginning of a trend or an increase in trend intensity, a decreasing slope signifies decreasing intensity. Also, RAVI often reacts more quickly and exhibits a more pronounced curve than ADX.
The standard values for daily charts are 7 and 65. For hourly charts, the most common averaging periods are 12 and 72 or 24 and 120.
The signal lines suggested are from +/- 0.3% to +/-1%. I haven't added any markings as these signals are instrument-specific. I suggest doing some back testing and adding these accordingly.
Trend Intensity Index
--------------------------------------
TII, by M. H. Pee, measures the strength of a trend, by looking at what proportion of the past "n" days prices have been above or below the level of today's "x"-day simple moving average. You can configure "n" via options page. "x" is calculated as "2 times n".
TII moves between 0 and 100. A strong uptrend is indicated when TII is above 80. A strong downtrend is indicated when TII is below 20.
Pee recommended entering trades when levels of 80 on the upside or 20 on the downside are reached. Indicator marks these lines for easy reference.

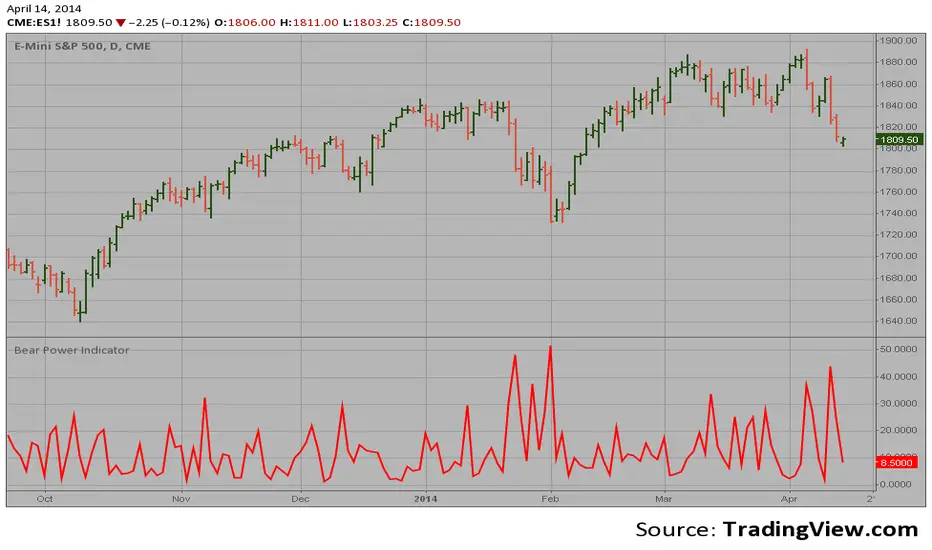
Bear Power Indicator Hi
Let me introduce my Bear Power Indicator script.
To get more information please see "Bull And Bear Balance Indicator"
by Vadim Gimelfarb.
Advance-Decline Indicator The Advance-Decline Indicator is a market breadth indicator
based on the smoothed difference between advancing and declining issues.
The indicator shows when the stock market is overbought (and a correction
is due) and when it is oversold (and a rally is due).
The Advance-Decline Indicator is a 10-period exponential moving average of
the difference between the number of advancing and declining issues.

Ehlers Adaptive Cyber Cycle Indicator [LazyBear]Another famous Ehlers indicator.
This is the adaptive version of Ehlers' Cyber Cycle (CC) (already published, check "More info" below). Idea behind making something "adaptive" is to calculate it using dynamic cycle period inputs instead of static setting. In adaptive cyber cycle, Ehlers uses the dominant cycle period as the length in computation of alpha.
According to Ehlers this should be more responsive than the non-adaptive version. Buy and sell signals should often occur one bar earlier than for the non-adaptive version.
I have the usual options in place. Check out plain CC for comparison.
More info:
- Cyber Cycle Indicator:
- Cybernetic Analysis for Stocks and Futures (Ehlers)
List of my public indicators: bit.ly
List of my app-store indicators: blog.tradingview.com

Breakout/Breakdown Indicator (30 Min Range) by InvestYourAsset👉The indicator provided here is a technical analysis indicator for TradingView users that identifies potential breakout and breakdown opportunities on the initial 30-minute range in every trading session.
👉The indicator high and low of the initial 30-minute period and plotting them as horizontal lines on the chart. The high is marked in green line and the low is marked in red line.
📈The indicator then generates buy and sell signals based on whether the current close price crosses above or below the previous 30-minute high and low, respectively.
📢The indicator also has two inputs:
👉 sessionStartHour : The hour at which the trading session begins. The default value is 9, However users can change the time according to their own trading style.
👉 sessionStartMinute : The minute at which the trading session begins. The default value is 0.
These inputs can be used to adjust the indicator to the specific trading session that you are interested in.
✅How to use the Indicator:
👉To use the 30 Minute Breakout/Breakdown Indicator, simply add it to your chart and configure the inputs to your liking. Once the indicator is added to the chart, it will plot the 30-minute high and low as horizontal lines, as well as generate buy and sell signals based on the current close price.
✅Here is a step-by-step guide:
📈Open TradingView and select the chart that you want to add the indicator to.
📈Click on the "Indicators" tab and search for "30 Minute Breakout/Breakdown Indicator by InvestYourAsset".
📈Click on the indicator to add it to your chart.
📈Configure the inputs to your liking. The default values are typically fine, but you can experiment with different values to see what works best for you.
📈Once you are satisfied with the settings, click on the "Apply" button.
📈The indicator will now be displayed on your chart. You will see two horizontal lines representing the previous 30-minute high and low, as well as triangles representing buy and sell signals.
✅How to interpret the signals:
📈Buy signal : A buy signal is generated when the current close price crosses above the previous 30-minute high. This suggests that the price is likely to continue moving higher in the short term.
📈Sell signal : A sell signal is generated when the current close price crosses below the previous 30-minute low. This suggests that the price is likely to continue moving lower in the short term.
👉Traders should remember that the present indicator is just one tool that can be used to identify potential trading opportunities. It is important to use other technical analysis tools and risk management techniques to confirm your trading signals before entering any trades.
✅Things to consider while using the indicator:
📈Look for buy signals in an uptrend and sell signals in a downtrend. This will increase the likelihood of your trades being successful.
📈Place your stop losses below the previous 30-minute low for buy signals and above the previous 30-minute high for sell signals. This will help to limit your losses if the trade goes against you.
📈Consider taking profits at key resistance and support levels. This will help you to lock in your profits and avoid giving them back to the market.
Follow us for timely updates regarding indicators that we may publish in future and give it a like if you appreciate the indicator.

Ehlers Simple Cycle Indicator [LazyBear]One of the early cycle indicators from John Ehlers.
Ehlers suggests using this with ITrend (see linked PDF below). Osc/signal crosses identify entry/exit points.
Options page has the usual set of configurable params.
More info:
- Simple Cycle Indicator: www.mesasoftware.com
List of my public indicators: bit.ly
List of my app-store indicators: blog.tradingview.com

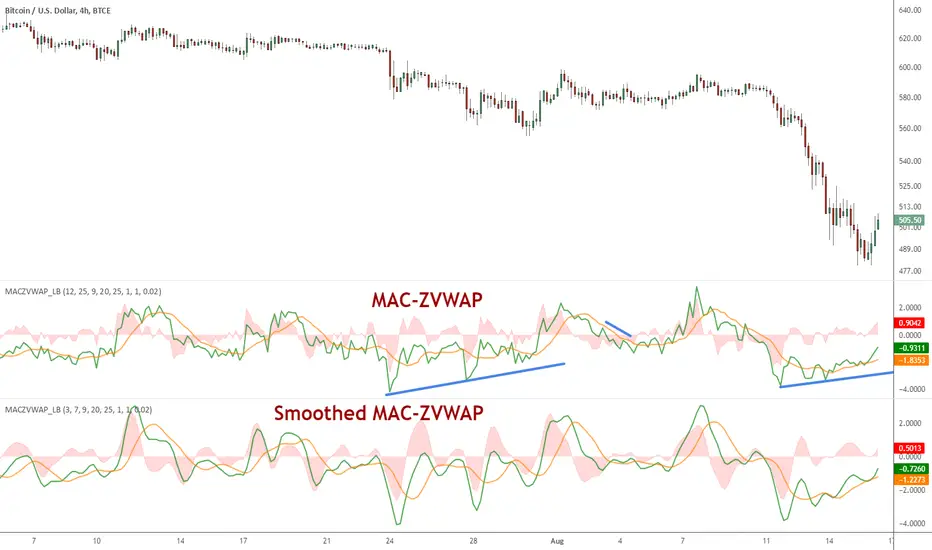
MAC-Z VWAP Indicator [LazyBear]This a modified MAC-Z using Z-VWAP. Since this uses VWAP, the signals are derived indirectly from both volume and price action.
I have also included a way to smooth MACZ-VWAP, you can enable it via options page.
Note that this will not work on any FX pair, as volume is not available.
Referenced indicators:
Z-distance from VWAP:
MAC-Z Indicator:
Z-Score:
Complete list of my indicators:
GDoc: docs.google.com
Chart:
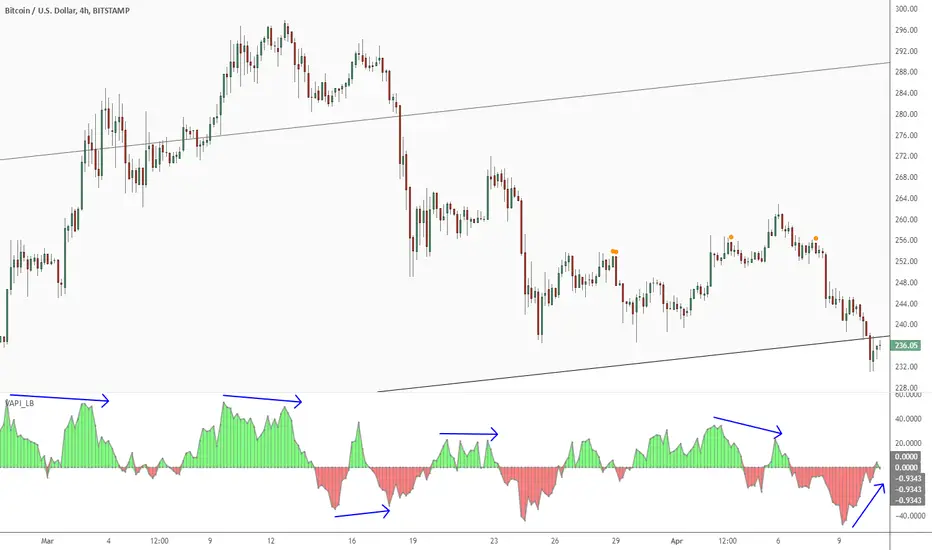
Volume Accumulation Percentage Indicator [LazyBear]Volume Accumulation Percentage Indicator (VAPI) is a variation of the classic volume-accumulation indicators. It uses volume the same way as OBV except that it assigns volume weights based on intraday volatility.
In a positive trend, if the stock price is close to a (local) new high, the VAPI should be at its maximum as well (and vice versa for a negative trend). If the market is looking for a direction, if the price is in the bottom side of his current trading range and if, at the same moment the VAPI osc slopes up, there is accumulation on the stock and that the prices should start to climb. The SELL signal is given when the VAPI decreases (distribution). Divergences are usually very effective too.
Tuning the "length" parameter may be needed for your instrument (default is 10), do let me know if you find a different value to be optimal for majority of instruments.
List of my public indicators: bit.ly
List of my app-store indicators: blog.tradingview.com
Correlated Movement Indicator V2Hello!
This script was briefly known as as Bing Chilling. I converted this to Pine Script V5 to ensure compliance with publishing requirements.
This script tracks RSI and inserts an indicator when correlated movement is detected. Proximity of current tick to indicator origin tick determines freshness of the indicator.
DO NOT sit on the indicator for a long time. This is not a magic solution. It is very accurate but, not always precise. Ensure that you use other factors to determine the relevance of the indicator on current tick. This script can technically be used on any security/commodity/currency. Your Mileage May Vary! Proceed with caution as always.
General Workflow:
Look at proximity to where the flag is placed, general volatility, and other indicators and you can potentially determine the direction/strength. Not always the duration. The indicator could be for 30s, 1hr, 1 day, or whatever the market feels like. It depends on precision/quantity of pricing data. ex. 30min tick rate pricing vs. 1 day tick rate pricing will change the scope.
So if the time scope shows all sell from 1 week -> 3 months except for a couple recent buy indicators on the day, then it may be a bad call long term but, might be good for a short term play. Very volatile. Careful.
If it was all green with long term indicators such as 1 month -> 1 year, then it looks more like a buy and forget type strategy.
If it's all green with a recent red then you can try and figure out what the relative the bottom is so you can buy for long term at a slightly more favorable price.
Flip all that for shorting. I highly recommend AGAINST shorting since the stakes are very different and usually involves taking out what is essentially a loan to bet against the market.
This script pairs nicely with the top pick indicator when you search "Heiken Ashi". I use that to determine peaks and pits to better guess a good time to open a position.
This should be used alongside other indicators. Good for short term day trading and long term hold and forget. (Don't actually forget. Set some alerts periodically.)
Please use caution. Please do not take what I've said here as fact and diamond pepe hands bet all on green to the moon. This, like all the other strategies and indicators on this site, are used as tools to inform you about potential and to categorize/depict data in a more human recognizable way. If you have access to a paper account try there first.
Happy trading!
- Zetsu

Multi indicators tableThis is a comprehensive trading tool that presents an overview of the market in a tabular format. It consists of five distinct categories of trading indicators : Volatility, Trend, Momentum, Reversal, and Volume. Each category includes a series of indicators that are widely used in the trading communauty.
The Volatility category includes the Average True Range (ATR) and Bollinger Bands indicators. The Trend category comprises the Average Directional Index (ADX), four Exponential Moving Averages (EMAs), Aroon, Parabolic SAR, and the Supertrend. The Momentum category includes the Stochastic Relative Strength Index (StochRSI), Money Flow Index (MFI), Williams %R, Relative Strength Index (RSI), and Commodity Channel Index (CCI). The Reversal category includes Parabolic SAR, Moving Average Convergence Divergence (MACD), and PP Supertrend. Finally, the Volume category includes the Volume Exponential Moving Average (EMA) indicator.
The indicators states are easily readable, the indicator case is colored based on his actual state. A bullish color (green by default), a bearish color (red by default),
a very bullish color (dark green by default), a very bearish color (dark red by default) and a neutral color (gray by default) displayed when the indicator doesn't give us a clear signal. Some indicators do not have a very bullish or very bearish state. Concerning volatility indicators, the bullish color indicates high volatility, the bearish color indicates low volatility, and the neutral color indicates normal volatility.
Most of the indicators displayed in the table are customizable, and traders can choose to hide the categories they don't want to use. The Indicator provides a quick and easily readable view on the market and allows traders to reduce the number of indicators on their chart making it lighter and more readable.

indicator CalibrationIndicator Calibration - Multi-Indicator Consensus System
Overview
Indicator Calibration is a powerful consensus-based trading indicator that leverages the MyIndicatorLibrary (NormalizedIndicators) to combine multiple trend-following indicators into a single, actionable signal. By averaging the normalized outputs of up to 8 different trend indicators, this tool provides traders with a clear consensus view of market direction, reducing noise and false signals inherent in single-indicator approaches.
The indicator outputs a value between -1 (strong bearish) and +1 (strong bullish), with 0 representing a neutral market state. This creates an intuitive, easy-to-read oscillator that synthesizes multiple analytical perspectives into one coherent signal.
🎯 Core Concept
Consensus Trading Philosophy
Rather than relying on a single indicator that may give conflicting or premature signals, Indicator Calibration employs a democratic voting system where multiple indicators contribute their normalized opinion:
Each enabled indicator votes: +1 (bullish), -1 (bearish), or 0 (neutral)
The votes are averaged to create a consensus signal
Strong consensus (closer to ±1) indicates high agreement among indicators
Weak consensus (closer to 0) indicates market indecision or transition
Key Benefits
Reduced False Signals: Multiple indicators must agree before strong signals appear
Noise Filtering: Individual indicator quirks are smoothed out by averaging
Customizable: Enable/disable indicators and adjust parameters to suit your trading style
Universal Application: Works across all timeframes and asset classes
Clear Visualization: Simple line oscillator with clear bull/bear zones
📊 Included Indicators
The system can utilize up to 8 normalized trend-following indicators from the library:
1. BBPct - Bollinger Bands Percent
Parameters: Length (default: 20), Factor (default: 2)
Type: Stationary oscillator
Strength: Mean reversion and volatility detection
2. NorosTrendRibbonEMA
Parameters: Length (default: 20)
Type: Non-stationary trend follower
Strength: Breakout detection with momentum confirmation
3. RSI - Relative Strength Index
Parameters: Length (default: 9), SMA Length (default: 4)
Type: Stationary momentum oscillator
Strength: Overbought/oversold with smoothing
4. Vidya - Variable Index Dynamic Average
Parameters: Length (default: 30), History Length (default: 9)
Type: Adaptive moving average
Strength: Volatility-adjusted trend following
5. HullSuite
Parameters: Length (default: 55), Multiplier (default: 1)
Type: Fast-response moving average
Strength: Low-lag trend identification
6. TrendContinuation
Parameters: MA Length 1 (default: 50), MA Length 2 (default: 25)
Type: Dual HMA system
Strength: Trend quality assessment with neutral states
7. LeonidasTrendFollowingSystem
Parameters: Short Length (default: 21), Key Length (default: 10)
Type: Dual EMA crossover
Strength: Simple, reliable trend tracking
8. TRAMA - Trend Regularity Adaptive Moving Average
Parameters: Length (default: 50)
Type: Adaptive trend follower
Strength: Adjusts to trend stability
⚙️ Input Parameters
Source Settings
Source: Choose your price input (default: close)
Can be modified to: open, high, low, close, hl2, hlc3, ohlc4, hlcc4
Indicator Selection
Each indicator can be enabled or disabled via checkboxes:
use_bbpct: Enable/disable Bollinger Bands Percent
use_noros: Enable/disable Noro's Trend Ribbon
use_rsi: Enable/disable RSI
use_vidya: Enable/disable VIDYA
use_hull: Enable/disable Hull Suite
use_trendcon: Enable/disable Trend Continuation
use_leonidas: Enable/disable Leonidas System
use_trama: Enable/disable TRAMA
Parameter Customization
Each indicator has its own parameter group where you can fine-tune:
val 1: Primary period/length parameter
val 2: Secondary parameter (multiplier, smoothing, etc.)
📈 Signal Interpretation
Output Line (Orange)
The main output oscillates between -1 and +1:
+1.0 to +0.5: Strong bullish consensus (all or most indicators agree on uptrend)
+0.5 to +0.2: Moderate bullish bias (bullish indicators outnumber bearish)
+0.2 to -0.2: Neutral zone (mixed signals or transition phase)
-0.2 to -0.5: Moderate bearish bias (bearish indicators outnumber bullish)
-0.5 to -1.0: Strong bearish consensus (all or most indicators agree on downtrend)
Reference Lines
Green line (+1): Maximum bullish consensus
Red line (-1): Maximum bearish consensus
Gray line (0): Neutral midpoint
💡 Trading Strategies
Strategy 1: Consensus Threshold Trading
Entry Rules:
- Long: Output crosses above +0.5 (strong bullish consensus)
- Short: Output crosses below -0.5 (strong bearish consensus)
Exit Rules:
- Exit Long: Output crosses below 0 (consensus lost)
- Exit Short: Output crosses above 0 (consensus lost)
Strategy 2: Zero-Line Crossover
Entry Rules:
- Long: Output crosses above 0 (bullish shift in consensus)
- Short: Output crosses below 0 (bearish shift in consensus)
Exit Rules:
- Exit on opposite crossover
Strategy 3: Divergence Trading
Look for divergences between:
- Price making higher highs while indicator makes lower highs (bearish divergence)
- Price making lower lows while indicator makes higher lows (bullish divergence)
Strategy 4: Extreme Reading Reversal
Entry Rules:
- Long: Output reaches -0.8 or below (extreme bearish consensus = potential reversal)
- Short: Output reaches +0.8 or above (extreme bullish consensus = potential reversal)
Use with caution - best combined with other reversal signals
🔧 Optimization Tips
For Trending Markets
Enable trend-following indicators: Noro's, VIDYA, Hull Suite, Leonidas
Use higher threshold levels (±0.6) to filter out minor retracements
Increase indicator periods for smoother signals
For Range-Bound Markets
Enable oscillators: BBPct, RSI
Use zero-line crossovers for entries
Decrease indicator periods for faster response
For Volatile Markets
Enable adaptive indicators: VIDYA, TRAMA
Use wider threshold levels to avoid whipsaws
Consider disabling fast indicators that may overreact
Custom Calibration Process
Start with all indicators enabled using default parameters
Backtest on your chosen timeframe and asset
Identify which indicators produce the most false signals
Disable or adjust parameters for problematic indicators
Test different threshold levels for entry/exit
Validate on out-of-sample data
📊 Visual Guide
Color Scheme
Orange Line: Main consensus output
Green Horizontal: Bullish extreme (+1)
Red Horizontal: Bearish extreme (-1)
Gray Horizontal: Neutral zone (0)
Reading the Chart
Line above 0: Net bullish sentiment
Line below 0: Net bearish sentiment
Line near extremes: Strong consensus
Line fluctuating near 0: Indecision or transition
Smooth line movement: Stable consensus
Erratic line movement: Conflicting signals
⚠️ Important Considerations
Lag Characteristics
This is a lagging indicator by design (consensus takes time to form)
Best used for trend confirmation rather than early entry
May miss the first portion of strong moves
Reduces false entries at the cost of delayed entries
Number of Active Indicators
More indicators = smoother but slower signals
Fewer indicators = faster but potentially noisier signals
Minimum recommended: 4 indicators for reliable consensus
Optimal: 6-8 indicators for balanced performance
Market Conditions
Best: Strong trending markets (up or down)
Good: Volatile markets with clear directional moves
Poor: Choppy, sideways markets with no clear trend
Worst: Low-volume, range-bound conditions
Complementary Tools
Consider combining with:
Volume analysis for confirmation
Support/resistance levels for entry/exit points
Market structure analysis (higher timeframe trends)
Risk management tools (ATR-based stops)
🎓 Example Use Cases
Swing Trading
Timeframe: Daily or 4H
Enable: All 8 indicators with default parameters
Entry: Consensus > +0.5 or < -0.5
Hold: Until consensus reverses to opposite extreme
Day Trading
Timeframe: 15m or 1H
Enable: Faster indicators (RSI, BBPct, Noro's, Hull Suite)
Entry: Zero-line crossover with volume confirmation
Exit: Opposite crossover or profit target
Position Trading
Timeframe: Weekly or Daily
Enable: Slower indicators (TRAMA, VIDYA, Trend Continuation)
Entry: Strong consensus (±0.7) with higher timeframe confirmation
Hold: Months until consensus weakens significantly
🔬 Technical Details
Calculation Method
1. Each enabled indicator calculates its normalized signal (-1, 0, or +1)
2. All active signals are stored in an array
3. Array.avg() computes the arithmetic mean
4. Result is plotted as a continuous line
Output Range
Theoretical: -1.0 to +1.0
Practical: Typically ranges between -0.8 to +0.8
Rare: All indicators perfectly aligned at ±1.0
Performance
Lightweight calculation (simple averaging)
No repainting (all indicators are non-repainting)
Compatible with all Pine Script features
Works on all TradingView plans
📋 License
This code is subject to the Mozilla Public License 2.0 at mozilla.org
🚀 Quick Start Guide
Add to Chart: Apply indicator to your chart
Choose Timeframe: Select appropriate timeframe for your trading style
Enable Indicators: Start with all 8 enabled
Observe Behavior: Watch how consensus forms during different market conditions
Calibrate: Adjust parameters and indicator selection based on observations
Backtest: Validate your settings on historical data
Trade: Apply with proper risk management
🎯 Key Takeaways
✅ Consensus beats individual indicators - Multiple perspectives reduce errors
✅ Customizable to your style - Enable/disable and tune to preference
✅ Simple interpretation - One line tells the story
✅ Works across markets - Stocks, crypto, forex, commodities
✅ Reduces emotional trading - Clear, objective signal generation
✅ Professional-grade - Built on proven technical analysis principles
Indicator Calibration transforms complex multi-indicator analysis into a single, actionable signal. By harnessing the collective wisdom of multiple proven trend-following systems, traders gain a powerful edge in identifying high-probability trade setups while filtering out market noise.

Linear Momentum and Performance Indicators (IFTA Jan 2019)This a porting to Trading View of the 12 new indicators introduced in IFTA Journal (January Edition) by Akram El Sherbini, MFTA, CFTe, CETA.
Indicators are available in "Linear Momentum and Performance Indicators" at page four.
IFTA Journal is available below:
ifta.org
Indicators implemented herein:
Linear Force Index: The linear force index LFI measures the force of buyers and sellers during rallies and declines, respectively. It combines two important pieces of market information—the price acceleration
and volumes.
Pressure Index: The pressure index PRI measures the buying and selling pressure over a certain range within a time interval by moving around its zero line. The index indicates a rise in buying pressure when it crosses above the zero line and a rise in selling pressure
when it crosses below the zero line level. The buying and selling force moves the last price during the session to form a range with low and high boundaries.
Strength Index Index : The strength index SI is a leading indicator to the pressure index. It measures the ability of buyers to resist sellers and vice versa. SI of today is the ratio of the latest pressure index value to the strain of today.
Power Index : It measures the buying and selling power within a time interval by moving around its zero line.
Intensity Index : The intensity index II measures the buying and selling intensity within a time interval by moving around its zero line.
Dynamic Strength Index : The sole purpose of the dynamic strength index DSI and the integral dynamic strength index IDSI is to lead their intensity indicator peers.
Integral Force Index
Integral Pressure Index
Integral Strength Index
Integral Power Index
Integral Intensity Index
Integral Dynamic Strength Index
The following example shows a trade following the signal while several indicators are crossing the zero line:
Integral performance indicators have a fewer number of trades than the performance indicators. This result is normal, as the integral indicators are less sensitive than their peers. Moreover, the power, intensity, and dynamic strength are less sensitive than the force, pressure, and strength indicators. The same applies for their integrals. Therefore, the integrals of power, intensity, and dynamic strength indicators are more inclined to be medium-term indicators.
As the paper is suggesting "the linear momentum and the new performance indicators should make a significant change in categorizing several indicators in technical analysis."
Technical indicators are using biased mathematical implementations. For example Momentum Index is in reality a velocity indicator, Force index a Momentum indicator and so on. From a Physical perspective correct momentum, force, velocity etc. needs to be corrected and re-categorized.
The author also gives important insights in how these indicators can be used "simultaneously to identify price turning points and filter irrelevant divergences."
"This paper will attempt to adjust the price momentum and force concepts introduced by Welles Wilder and Alexander Elder, respectively. By introducing the concept of linear momentum, new indicators will emerge to dissect the market performance into six main elements: market’s force, pressure, strength, power, intensity, and dynamic strength. This will lead to a deeper insight about market action. The leading performance indicators can be used simultaneously to identify price turning points and filter irrelevant divergences. The linear momentum and the new performance indicators should make a significant change in categorizing several indicators in technical analysis."
Suggestions and feedback are welcome
Hope you enjoy this,
CryptoStatistical
Multi-indicator Signal Builder [Skyrexio]Overview
Multi-Indicator Signal Builder is a versatile, all-in-one script designed to streamline your trading workflow by combining multiple popular technical indicators under a single roof. It features a single-entry, single-exit logic, intrabar stop-loss/take-profit handling, an optional time filter, a visually accessible condition table, and a built-in statistics label. Traders can choose any combination of 12+ indicators (RSI, Ultimate Oscillator, Bollinger %B, Moving Averages, ADX, Stochastic, MACD, PSAR, MFI, CCI, Heikin Ashi, and a “TV Screener” placeholder) to form entry or exit conditions. This script aims to simplify strategy creation and analysis, making it a powerful toolkit for technical traders.
Indicators Overview
1. RSI (Relative Strength Index)
Measures recent price changes to evaluate overbought or oversold conditions on a 0–100 scale.
2. Ultimate Oscillator (UO)
Uses weighted averages of three different timeframes, aiming to confirm price momentum while avoiding false divergences.
3. Bollinger %B
Expresses price relative to Bollinger Bands, indicating whether price is near the upper band (overbought) or lower band (oversold).
4. Moving Average (MA)
Smooths price data over a specified period. The script supports both SMA and EMA to help identify trend direction and potential crossovers.
5. ADX (Average Directional Index)
Gauges the strength of a trend (0–100). Higher ADX signals stronger momentum, while lower ADX indicates a weaker trend.
6. Stochastic
Compares a closing price to a price range over a given period to identify momentum shifts and potential reversals.
7. MACD (Moving Average Convergence/Divergence)
Tracks the difference between two EMAs plus a signal line, commonly used to spot momentum flips through crossovers.
8. PSAR (Parabolic SAR)
Plots a trailing stop-and-reverse dot that moves with the trend. Often used to signal potential reversals when price crosses PSAR.
9. MFI (Money Flow Index)
Similar to RSI but incorporates volume data. A reading above 80 can suggest overbought conditions, while below 20 may indicate oversold.
10. CCI (Commodity Channel Index)
Identifies cyclical trends or overbought/oversold levels by comparing current price to an average price over a set timeframe.
11. Heikin Ashi
A type of candlestick charting that filters out market noise. The script uses a streak-based approach (multiple consecutive bullish or bearish bars) to gauge mini-trends.
12. TV Screener
A placeholder condition designed to integrate external buy/sell logic (like a TradingView “Buy” or “Sell” rating). Users can override or reference external signals if desired.
Unique Features
1. Multi-Indicator Entry and Exit
You can selectively enable any subset of 12+ classic indicators, each with customizable parameters and conditions. A position opens only if all enabled entry conditions are met, and it closes only when all enabled exit conditions are satisfied, helping reduce false triggers.
2. Single-Entry / Single-Exit with Intrabar SL/TP
The script supports a single position at a time. Once a position is open, it monitors intrabar to see if the price hits your stop-loss or take-profit levels before the bar closes, making results more realistic for fast-moving markets.
3. Time Window Filter
Users may specify a start/end date range during which trades are allowed, making it convenient to focus on specific market cycles for backtesting or live trading.
4. Condition Table and Statistics
A table at the bottom of the chart lists all active entry/exit indicators. Upon each closed trade, an integrated statistics label displays net profit, total trades, win/loss count, average and median PnL, etc.
5. Seamless Alerts and Automation
Configure alerts in TradingView using “Any alert() function call.”
The script sends JSON alert messages you can route to your own webhook.
The indicator can be integrated with Skyrexio alert bots to automate execution on major cryptocurrency exchanges
6. Optional MA/PSAR Plots
For added visual clarity, optionally plot the chosen moving averages or PSAR on the chart to confirm signals without stacking multiple indicators.
Methodology
1. Multi-Indicator Entry Logic
When multiple entry indicators are enabled (e.g., RSI + Stochastic + MACD), the script requires all signals to align before generating an entry. Each indicator can be set for crossovers, crossunders, thresholds (above/below), etc. This “AND” logic aims to filter out low-confidence triggers.
2. Single-Entry Intrabar SL/TP
One Position At a Time: Once an entry signal triggers, a trade opens at the bar’s close.
Intrabar Checks: Stop-loss and take-profit levels (if enabled) are monitored on every tick. If either is reached, the position closes immediately, without waiting for the bar to end.
3. Exit Logic
All Conditions Must Agree: If the trade is still open (SL/TP not triggered), then all enabled exit indicators must confirm a closure before the script exits on the bar’s close.
4. Time Filter
Optional Trading Window: You can activate a date/time range to constrain entries and exits strictly to that interval.
Justification of Methodology
Indicator Confluence: Combining multiple tools (RSI, MACD, etc.) can reduce noise and false signals.
Intrabar SL/TP: Capturing real-time spikes or dips provides a more precise reflection of typical live trading scenarios.
Single-Entry Model: Straightforward for both manual and automated tracking (especially important in bridging to bots).
Custom Date Range: Helps refine backtesting for specific market conditions or to avoid known irregular data periods.
How to Use
1. Add the Script to Your Chart
In TradingView, open Indicators , search for “Multi-indicator Signal Builder”.
Click to add it to your chart.
2. Configure Inputs
Time Filter: Set a start and end date for trades.
Alerts Messages: Input any JSON or text payload needed by your external service or bot.
Entry Conditions: Enable and configure any indicators (e.g., RSI, MACD) for a confluence-based entry.
Close Conditions: Enable exit indicators, along with optional SL (negative %) and TP (positive %) levels.
3. Set Up Alerts
In TradingView, select “Create Alert” → Condition = “Any alert() function call” → choose this script.
Entry Alert: Triggers on the script’s entry signal.
Close Alert: Triggers on the script’s close signal (or if SL/TP is hit).
Skyrexio Alert Bots: You can route these alerts via webhook to Skyrexio alert bots to automate order execution on major crypto exchanges (or any other supported broker).
4. Visual Reference
A condition table at the bottom summarizes active signals.
Statistics Label updates automatically as trades are closed, showing PnL stats and distribution metrics.
Backtesting Guidelines
Symbol/Timeframe: Works on multiple assets and timeframes; always do thorough testing.
Realistic Costs: Adjust commissions and potential slippage to match typical exchange conditions.
Risk Management: If using the built-in stop-loss/take-profit, set percentages that reflect your personal risk tolerance.
Longer Test Horizons: Verify performance across diverse market cycles to gauge reliability.
Example of statistic calculation
Test Period: 2023-01-01 to 2025-12-31
Initial Capital: $1,000
Commission: 0.1%, Slippage ~5 ticks
Trade Count: 468 (varies by strategy conditions)
Win rate: 76% (varies by strategy conditions)
Net Profit: +96.17% (varies by strategy conditions)
Disclaimer
This indicator is provided strictly for informational and educational purposes .
It does not constitute financial or trading advice.
Past performance never guarantees future results.
Always test thoroughly in demo environments before using real capital.
Enjoy exploring the Multi-Indicator Signal Builder! Experiment with different indicator combinations and adjust parameters to align with your trading preferences, whether you trade manually or link your alerts to external automation services. Happy trading and stay safe!

Multiple EMA Indicator [Pineify]TradingView Multiple EMA Indicator: A Comprehensive Trend Analysis Tool
The TradingView Multiple EMA Indicator is a powerful and versatile tool designed to provide traders with a comprehensive view of market trends across multiple timeframes. By incorporating five Exponential Moving Averages (EMAs) with customizable lengths and sources, this indicator offers a nuanced approach to trend analysis, suitable for both novice and experienced traders.
Key Features:
Five customizable EMAs for multi-timeframe analysis
Flexible source inputs for each EMA
Color-coded plots for easy visual interpretation
Overlay functionality for direct price action comparison
How It Works:
This indicator calculates and displays five separate EMAs on your chart, each with its own customizable length and source. The EMAs are color-coded for easy identification:
EMA-1: Red
EMA-2: Light Green
EMA-3: Light Blue
EMA-4: Purple
EMA-5: Yellow
By default, the indicator uses the following settings:
EMA-1: 10-period EMA of close price
EMA-2: 20-period EMA of close price
EMA-3: 50-period EMA of close price
EMA-4: 100-period EMA of close price
EMA-5: 200-period EMA of close price
However, users can easily adjust these settings to suit their specific trading strategies and preferences.
Trading Ideas and Insights:
The Multiple EMA Indicator offers several ways to analyze market trends and generate trading signals:
Trend Identification: The alignment of the EMAs can help identify the overall trend. When shorter-term EMAs are above longer-term EMAs, it suggests an uptrend, and vice versa for a downtrend.
Dynamic Support and Resistance: Each EMA can act as a dynamic support or resistance level. Price bouncing off these levels can indicate potential entry or exit points.
Crossovers: When a shorter-term EMA crosses above a longer-term EMA, it may signal a bullish trend change. Conversely, a bearish signal may occur when a shorter-term EMA crosses below a longer-term EMA.
Trend Strength: The spacing between the EMAs can indicate trend strength. Wide spacing suggests a strong trend, while narrow spacing or intertwining EMAs may indicate consolidation or a weakening trend.
Multi-Timeframe Analysis: By using different EMA lengths, traders can gain insights into short-term, medium-term, and long-term trends simultaneously.
How to Use the Indicator:
Add the indicator to your chart and adjust the input parameters as needed.
Observe the relative positions of the EMAs to identify the overall trend direction.
Look for potential entry signals when price or shorter-term EMAs cross above or below longer-term EMAs.
Use the EMAs as dynamic support and resistance levels for setting stop-loss and take-profit orders.
Combine the Multiple EMA Indicator with other technical analysis tools, such as oscillators or volume indicators, for more comprehensive trading decisions.
Customization Options:
The indicator offers extensive customization options, allowing traders to tailor it to their specific needs:
Adjust the length of each EMA to focus on different timeframes
Change the source of each EMA (e.g., close, open, high, low, HL2, HLC3, OHLC4)
Modify the color and line thickness of each EMA for better visibility
Conclusion:
The TradingView Multiple EMA Indicator is a versatile and powerful tool for trend analysis and trade decision-making. By providing a multi-faceted view of market trends, it enables traders to make more informed decisions based on a comprehensive understanding of price action across various timeframes.
Remember that while this indicator can be a valuable tool in your trading arsenal, it should not be used in isolation. Always combine it with other forms of analysis and proper risk management techniques for the best results.
We hope this indicator enhances your trading experience and contributes to your success in the markets. Happy trading!

Targets For Overlay Indicators [LuxAlgo]The Targets For Overlay Indicators is a useful utility tool able to display targets during crossings made between the price and external indicators on the user chart. Users can display a series of two targets, one for crossover events and another one for crossunder event.
Alerts are included for the occurrence of a new target as well as for reached targets.
🔶 USAGE
In order for targets to be displayed users need to select an appropriate input source from the "Source" drop-down input setting. In the example above we apply the indicator to a volatility stop.
This can also easily be done by adding the "Targets For Overlay Indicators" script on the VStop indicator directly.
Targets can help users determine the price limit where the price might start deviating from an indication given by one or multiple indicators. In the context of trading, targets can help secure profits/reduce losses of a trade, as such this tool can be useful to evaluate/determine user take profits/stop losses.
Due to these essentially being horizontal levels, they can also serve as potential support/resistances, with breakouts potentially confirming new trends.
Users might be interested in obtaining new targets once one is reached, this can be done by enabling "New Target When Reached" in the target logic setting section, resulting in more frequent targets.
Lastly, users can restrict new target creation until current ones are reached. This can result in fewer and longer-term targets, with a higher reach rate.
🔹 Examples
The indicator can be applied to many overlay indicators that naturally produce crosses with the price, such as moving average, trailing stops, bands...etc.
Users can use trailing stops such as the SuperTrend or VStop to more easily create clean targets. Do note that certain SuperTrend scripts separate the upper and lower extremities of the SuperTrend into two different plot, which cannot be used with this tool, you may use the provided SuperTrend script below to have a compatible version with our tool:
//@version=5
indicator("SuperTrend", overlay = true)
factor = input.float(3, 'Factor', minval = 0)
atrLen = input.int(10, 'ATR Length', minval = 1)
= ta.supertrend(factor, atrLen)
plot(spt, 'SuperTrend', dir != dir ? na : dir < 0 ? #089981 : #f23645, 2)
plot(spt, 'Circles', dir > dir ? #f23645 : dir < dir ? #089981 : na, 3, plot.style_circles)
Using moving averages can produce more targets than other overlay indicators.
Users can apply the tool twice when using bands or any overlay indicator returning two outputs, using crossover targets for obtaining targets using the upper band as source and crossunder targets for targets using the lower band. We can also use the Trendlines with breaks indicator as example:
🔹 Dashboard
A dashboard is displayed on the top right of the chart, displaying the amount, reach rate of targets 1/2, and total amount.
This dashboard can be useful to evaluate the selected target distances relative to the selected conditions, with a higher reach rate suggesting the distance of the targets from the price allows them to be reached.
🔶 SETTINGS
Source: Indicator source used to create targets. Targets are created when the closing price crosses the specified source.
Show Target Labels: Display target labels on the chart.
Candle Coloring: Apply candle coloring based on the most recent active target.
🔹 Target
Crossover and Crossunder targets use the same settings below:
Show Target: Determines if the target is displayed or not.
Above Price Target: If selected, will create targets above the closing price.
Wait Until Reached: When enabled will not create a new target until an existing one is reached.
New Target When Reached: Will create a new target when an existing one is reached.
Evaluate Wicks: Will use high/low prices to determine if a target is reached. Unselecting this setting will use the closing price.
Target Distance From Price: Controls the distance of a target from the price. Can be determined in currencies/points, percentages, ATR multiples, or ticks.

Ehlers Cyber Cycle Indicator [LazyBear]The Cyber Cycle Indicator, developed by John Ehlers, is used for isolating the cycle component of the market from its trend counterpart. Unlike other oscillators like RSI, Cyber Cycle Indicator's wave has a variable amplitude.
Use the osc/signal crossover for entry/exit points. You can enable highlighting the crossovers by using region fills (via options page). I have also added an option to color the bars based on this.
Actually I have lot of Ehlers indicators in my to-publish backlog, will try to prioritize them over the others in the pipeline. Lets have an Ehlers week for indicators :)
More info:
Cybernetic Analysis for Stocks and Futures
List of my public indicators: bit.ly
List of my app-store indicators: blog.tradingview.com

Strategy Builder With IndicatorsThis strategy script is designed for traders who enjoy building systems using multiple indicators.
Please note: This script does not include any built-in indicators. Instead, it works by referencing the plot outputs of the indicators you’ve already added to your chart.
For example, if you add a MACD and an ATR indicator to your chart, you can assign their plot values as inputs in the settings panel of this strategy.
• MACD as a trigger
• ATR as a filter
How Filters Work
Filters check whether certain conditions are met before a trade can be opened. For instance, if you set a filter like ATR > 30, then no trade will be executed unless that condition is true — even if the trigger fires.
All filters are linked, meaning every active filter must be satisfied for a trade to occur.
How Triggers Work
Triggers are what actually fire a trade signal — such as a moving average crossover or RSI breaking above a specific level. Unlike filters, triggers are independent. Only one active trigger needs to be true for the trade to execute.
Thanks to its modular structure, this strategy can be used with any indicator of your choice.
⸻
Risk Management Features
In the settings, you’ll find flexible options for:
• Stop Loss (SL)
• Trailing Stop Loss (TSL)
• Multi Take-Profit (TP)
These features enhance trade safety and let you tailor your risk management.
SL types available:
• Tick-based SL
• Percent-based SL
• ATR-based SL
Once you select your preferred SL type, you can fine-tune its distance using the offset field.
Trailing SL allows your stop to follow price as it moves in your favor — helping to lock in profits.
Multi-TP lets you take profits at two different levels, helping you secure gains while leaving room for extended moves.
Breakeven option is also available to automatically move your SL to entry after reaching a profit threshold.
⸻
How to Build a Solid Strategy
Let’s break down a good setup into three key components:
1. Trend Filter
Avoid trading against the trend — that’s like swimming against the current.
Use a filter like:
• Supertrend
• Momentum indicators
• Candlestick bias, etc.
Example: In this case, I used Supertrend and filtered for trades only if the price is above the uptrend line.
2. Trigger Condition
Once we confirm the trend is on our side, we need a trigger to execute at the right moment. This can be:
• RSI cross
• Candlestick patterns
• Trendline breaks
• Moving average crossovers, etc.
Example: I used RSI crossing above 50 as the entry trigger.
3. Risk Management
Even in the right trend at the right time — anything can happen. That’s why you should always define Stop Loss and Take Profit levels.
⸻
And there you have it! Your strategy is ready to backtest, refine, and deploy with alerts for live trading.
Questions or suggestions? Feel free to reach out

Zweig Market Breadth Thrust Indicator [LazyBear]The Breadth Thrust (BT) indicator is a market momentum indicator developed by Dr. Martin Zweig. According to Dr. Zweig a Breadth Thrust occurs when, during a 10-day period, the Breadth Thrust indicator rises from below 40 percent to above 61.5 percent.
A "Thrust" indicates that the stock market has rapidly changed from an oversold condition to one of strength, but has not yet become overbought. This is very rare and has happened only a few times. Dr. Zweig also points out that most bull markets begin with a Breadth Thrust.
All parameters are configurable. You can draw BT for NYSE, NASDAQ, AMEX or based on combined data (i.e., AMEX+NYSE+NASD). There is also a "CUSTOM" mode supported, so you can enter your own ADV/DEC symbols.
More info:
Definition: www.investopedia.com
A Breadth Thrust Signal: www.mcoscillator.com
A Rare "Zweig" Buy Signal: www.moneyshow.com
Zweig Breadth Thrust: recessionalert.com
List of my public indicators: bit.ly
List of my app-store indicators: blog.tradingview.com

Ehlers Adaptive CG Indicator [LazyBear]Lets go with another adaptive indicator today. BTW, this is my 199th script (1 more and I am planning to work on my other backlogs).
This is the adaptive version of Ehlers' Center Of Gravity (CG) (already published, check "More info" below). Idea behind making something "adaptive" is to calculate it using dynamic cycle period inputs instead of static setting. In adaptive CG, Ehlers uses the dominant cycle period as the length in computation of alpha.
According to Ehlers this should be more responsive than the non-adaptive version. Buy and sell signals should often occur one bar earlier than for the non-adaptive version.
I have the usual options in place. Check out plain CC for comparison.
Here's a quick comparison between CG and Adaptive CG:
More info:
- Ehlers CG Oscillator:
- Cybernetic Analysis for Stocks and Futures (Ehlers)
List of my public indicators: bit.ly
List of my app-store indicators: blog.tradingview.com

Indicator Direction Table With Bullish & Bearish LabelsINDICATOR DIRECTION TABLE WITH BULLISH AND BEARISH LABELS
This is a table that shows the bullish, bearish or neutral trend for nine different popular indicators. Each indicator label will change color in real time to make you aware of each change in direction. This way you don’t have to read and analyze a bunch of different indicators constantly and you can focus on price action instead.
Look for the entire table to turn green or red before taking positions.
You can also set alerts for when the entire table of indicators is bullish or bearish.
The indicator settings allow customization of indicator lengths & values, table position and turning the indicator table on or off.
The length and other values for each indicator can be customized to suit your preferences, but by default all of them are set to the normal default settings that Tradingview supplies the indicators with. Typically 14 as the length.
The indicators used in this table are as follows:
MACD - Moving Average Convergence Divergence
Stochastic RSI - Stochastic Relative Strength Index
Vortex - Vortex Indicator
Momentum - Momentum Indicator
RSI - Relative Strength Index
PSAR - Parabolic Stop & Reverse
DMI - Directional Movement Index
MFI - Money Flow Index
Fisher - Fisher Transform Price Action
***MARKETS***
This indicator can be used as a signal on all markets, including stocks, crypto, futures and forex.
***TIMEFRAMES***
This indicator table can be used on all timeframes.
***TIPS***
Try using numerous indicators of ours on your chart so you can instantly see the bullish or bearish trend of multiple indicators in real time without having to analyze the data. Some of our favorites are our Auto Fibonacci, Directional Movement Index + Fisher Price Action, Volume Profile With Buy & Sell Pressure, Auto Support And Resistance and Money Flow Index in combination with this indicator direction table. They all have unique features to help you make better and faster trading decisions.

TVMC - Composite Indicator with Technical RatingsDescription:
The TVMC (Trend, Volume, Momentum, Composite) indicator is a powerful multi-component tool designed to provide traders with a comprehensive understanding of market conditions. By combining four essential technical analysis components—trend, momentum, volume, and volatility—this indicator offers clear and actionable insights to assist in decision-making.
Key Features:
1. Trend Component (TC):
* Based on MACD (Moving Average Convergence Divergence), this component analyzes the relationship between two exponential moving averages (fast and slow) to determine the prevailing market trend.
* The MACD signal is normalized to a range of -1 to +1 for consistency and clarity.
2. Momentum Component (MC):
* Utilizes RSI (Relative Strength Index) to measure the strength and speed of price movements.
* This component highlights overbought or oversold conditions, which may indicate potential market reversals.
3. Volume Confirmation (VC):
* Compares the current trading volume to its moving average over a specified period.
* High volume relative to the average confirms the validity of the current trend.
4. Volatility Filter (VF):
* Uses ATR (Average True Range) to gauge market volatility.
* Adjusts and smooths signals to reduce noise during periods of high volatility.
5. Technical Ratings Integration:
* Incorporates TradingView’s Technical Ratings, allowing users to validate signals using moving averages, oscillators, or a combination of both.
* Users can choose their preferred source of ratings for enhanced signal confirmation.
How It Works:
The TVMC indicator combines the weighted contributions of the Trend, Momentum, and Volume components, further refined by the Volatility Filter. Each component plays a specific role:
* Trend: Identifies whether the market is bullish, bearish, or neutral.
* Momentum: Highlights the strength of price action.
* Volume: Confirms whether the current price action is supported by sufficient trading activity.
* Volatility: Filters out excessive noise in volatile market conditions, providing a smoother and more reliable output.
Visualization:
1. Bullish Signals:
* The indicator line turns green and remains above the zero line, indicating upward momentum.
2. Bearish Signals:
* The indicator line turns red and falls below the zero line, signaling downward momentum.
3. Neutral Signals:
* The line is orange and stays near zero, indicating a lack of strong trend or momentum.
4. Zones:
* Horizontal lines at +30 and -30 mark strong bullish and bearish zones, respectively.
* A zero line is included for clear separation between bullish and bearish signals.
Recommended Usage:
* Best Timeframes: The indicator is optimized for higher timeframes such as 4-hour (H4) and daily (D1) charts.
* Trading Style: Suitable for swing and positional trading.
* Customization: The indicator allows users to adjust all major parameters (e.g., MACD, RSI, volume, and ATR settings) to fit their trading preferences.
Customization Options:
* Adjustable weights for Trend, Momentum, and Volume components.
* Fully configurable settings for MACD, RSI, Volume SMA, and ATR periods.
* Timeframe selection for multi-timeframe analysis.
Important Notes:
1. Originality: The TVMC indicator combines multiple analysis methods into a unique framework. It does not replicate or minimally modify existing indicators.
2. Transparency: The description is detailed enough for users to understand the methodology without requiring access to the code.
3. Clarity: The indicator is explained in a way that is accessible even to users unfamiliar with complex technical analysis tools.
Compliance with TradingView Rules:
* The indicator is written in Pine Script version 5, adhering to TradingView’s language standards.
* The description is written in English to ensure accessibility to the global community, with a clear explanation of all components and functionality.
* No promotional content, links, or unrelated references are included.
* The chart accompanying the indicator is clean and demonstrates its intended use clearly, with no additional indicators unless explicitly explained.

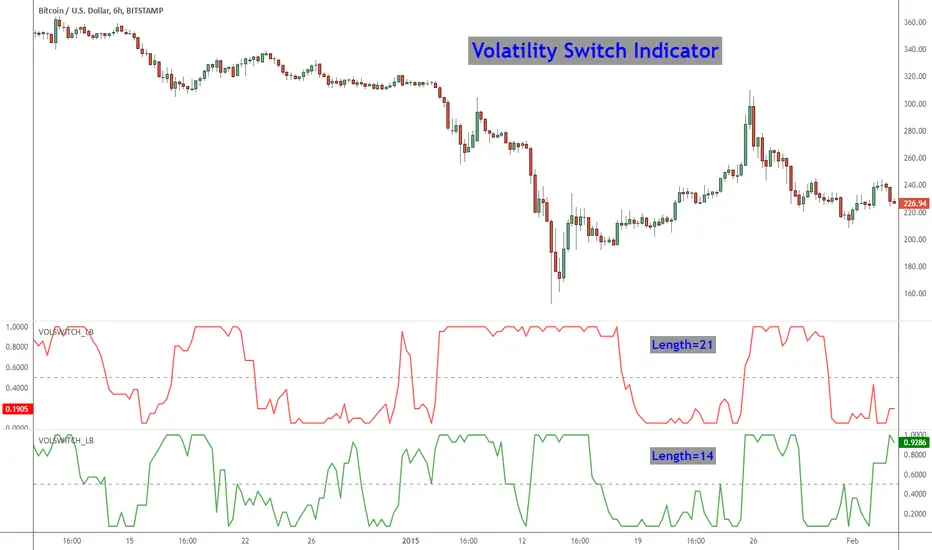
Volatility Switch Indicator [LazyBear]The Volatility Switch (VOLSWITCH) indicator, by Ron McEwan, estimates current volatility in respect to historical data, thus indicating whether the market is trending or in mean reversion mode. Range is normalized to 0 - 1.
When Volatility Switch rises above the 0.5 level, volatility in the market is increasing, thus the price action can be expected to become choppier with abrupt moves. When the indicator falls below the 0.5 level from recent high readings, volatility decreases, which may be considered a sign of trend formation.
Trading strategy as suggested by Ron McEwan is:
- If VOLSWITCH is less than 0.5, volatility decreases, which may be considered a sign of trend formation
- If VOLSWITCH is greater than 0.5, market is in high volatility mode. Can be choppy. Use RSI to look for OB/OS levels.
I have implemented support for 2 lengths (14 and 21) Note that, Pine doesn't support loops. Once it is introduced, I will publish an updated version.
Building a strategy out of this is straightforward (refer to my strategy explanation above), I strongly encourage new Pinescript coders to try to a plotarrow() based overlay indicator to get more familiar with Pine.
More info:
---------
The Volatility (Regime) Switch Indicator : traders.com
Complete list of my indicators:
-------------------------------------
docs.google.com