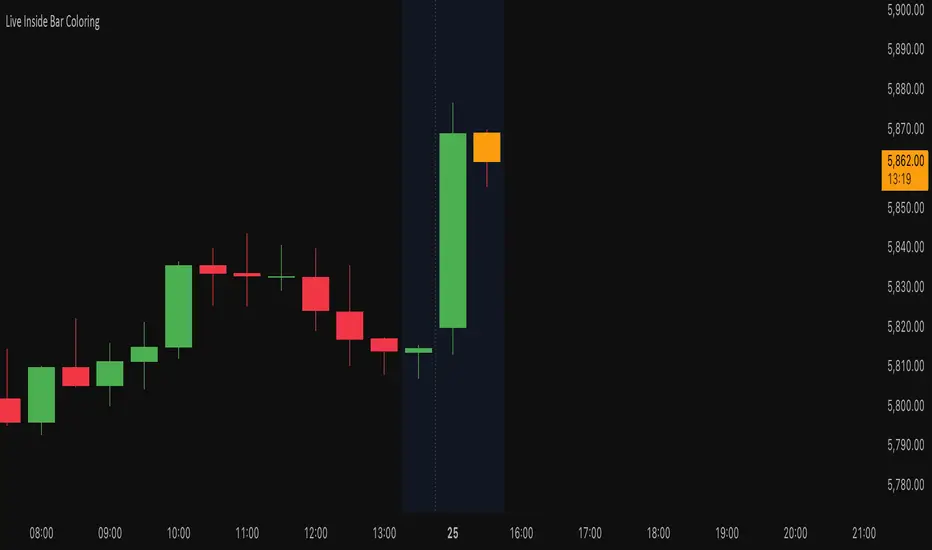
Live Inside Bar ColoringDescription
This script colors the current bar if it is inside the prior bar's high and low. Inside is defined as ≤ the high, and ≥ the low of the prior bar.
Utility
This gives a quick visual indication if the current bar is inside. This can indicate a choppier market. By definition, an inside bar is consolidating and not trending.
Function
Colors distinguish if the current price is above the opening price of the inside bar on a given timeframe. If you do not want to distinguish this, you can set both colors the same.
Search in scripts for "inside bar"
4 SMAs & Inside Bar (Colored)SMAs and Inside Bar strategy is very common as far as Technical analysis is concern. This script is a combination of 10-20-50-200 SMA and Inside Bar Candle Identification.
SMA Crossover:
4 SMAs (10, 20, 50 & 200) are combined here in one single indicator.
Crossover signal for Buy as "B" will be shown in the chart if SMA 10 is above 20 & 50 and SMA 20 is above 50.
Crossover signal for Sell as "S" will be shown in the chart if SMA 10 is below 20 & 50 and SMA 20 is below 50.
Inside Bar Identification:
This is to simply identify if there is a inside bar candle. The logic is very simple - High of the previous candle should be higher than current candle and low of the previous candle should be lower than the current candle.
If the previous candle is red, the following candle would be Yellow - which may give some bullish view in most of the cases but not always
If the previous candle is green, the following candle would be Black - which may give some bearish view in most of the cases but not always
Be Cautious when you see alternate yellow and black candle, it may give move on the both side
Please comment if you have any interesting ideas to improve this indicator.

Actionable Signals: Hammers, Shooters, and Inside Bars#TheStrat Actionable Signals
This indicator automatically detects hammers, shooters, and inside bars, which are key reversal and continuation patterns that can signal actionable trading opportunities. These 'Actionable Signals' are based on #TheStrat methodology developed by Rob Smith.
This indicator allows you to use a 'Classic' hammer/shooter definition as well as to customize hammer/shooter candle proportions to your liking.
Pattern Types
Classic Hammer/Shooter - Traditional pin bar pattern featuring a small body (≤30% of range) positioned at the extreme with a long dominant wick (3x+ body ratio). The most widely recognized reversal signal.
Custom Hammer/Shooter - Fully adjustable pattern parameters allowing you to fine-tune detection criteria for your specific trading strategy and timeframe preferences.
Paddle - Strong momentum bar with a large body (up to 85%) closing within 5% of the extreme. Identifies continuation moves with conviction. Color-validated (green hammers, red shooters).
Rejection - Wick-dominant pattern showing price rejection at extremes. Features moderate body (≤60%) with strong rejection wick (≥40%). Color-agnostic for flexibility.
Inside Bar - Bar contained entirely within the previous bar's range, signaling consolidation and potential breakout setups.
Key Features
Multi-Pattern Detection: Enable multiple pattern types simultaneously to capture different market structures
Pivot Validation: Optional swing high/low requirement ensures patterns occur at meaningful inflection points
Session Filtering: Restrict signals to specific trading sessions across multiple timezones
Visual Clarity: Color-coded markers distinguish between pattern types (customize via Style settings)
Testing Panel: Built-in debugging tool displays detailed bar analysis for fine-tuning detection parameters
How to Use
Default Settings: Start with Classic, Paddle, and Rejection patterns enabled for balanced signal generation
Pivot Filter: Keep "Require Swing High/Low" enabled to focus on patterns at key support/resistance levels
Customization: Adjust pattern strictness parameters based on your timeframe and trading style
Colors: Modify marker colors and styles through the Style tab for optimal chart visibility
Testing Panel: Enable to see why patterns are or aren't triggering on specific bars
Please share any issues you encounter, it will help improve the script for everyone!
Note: This indicator displays historical patterns and should be used as part of a comprehensive trading strategy. Past performance does not guarantee future results.

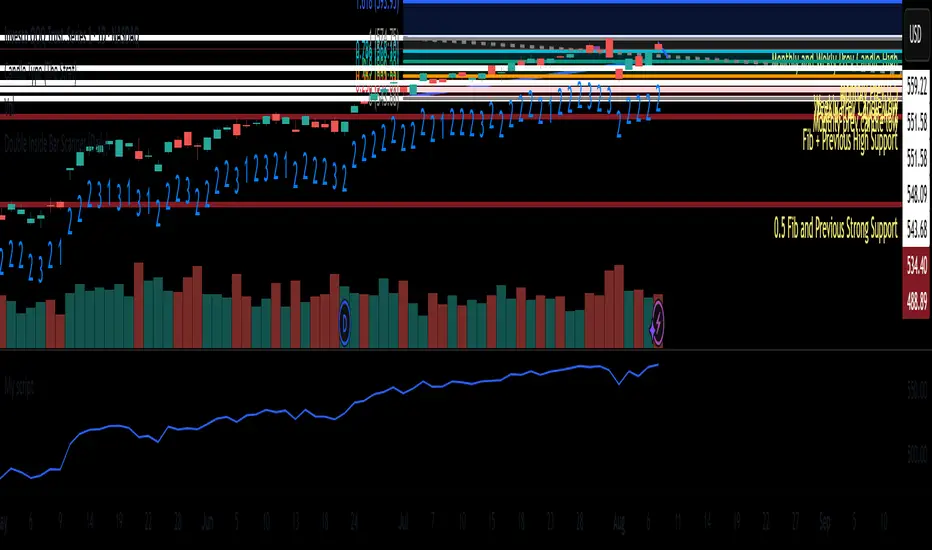
Double Inside BarThis indicator provides a statistical report on the Double Inside Bar pattern. Based on the chart's bars, it can improve your edge on any markets and timeframes.
A Double Inside Bar refers to a contraction where price is consolidating while making consecutive lower highs and a higher lows.
The report is broken down into the different following sections: retracement , invalidation , continuation and breakout .
Each of them provides hindsights about the pattern price behavior and brings answers to questions such as: How often does price retrace? Does the pattern often invalidate? If it doesn't then does it break in the pattern's direction? How far does price go? What are the odds of a false breakout?
While there are many ways to make use of the metrics, my favorite use case is for developing directional and daily/weekly biases while refining my stop/entry/target positioning.
Miscellaneous
Highlights patterns on the chart;
Supports bar to bar analysis and replay functionalities;
Provides counts on the `Data Window` panel for debugging or computing your own metrics;
Settings
Show/hide for toggling different sections;
Report coloring and offset on the x axis;
Gaining Access
This is a private indicator and is available only for my Patrons. You can reach my Patreon page below from the link in my signature.

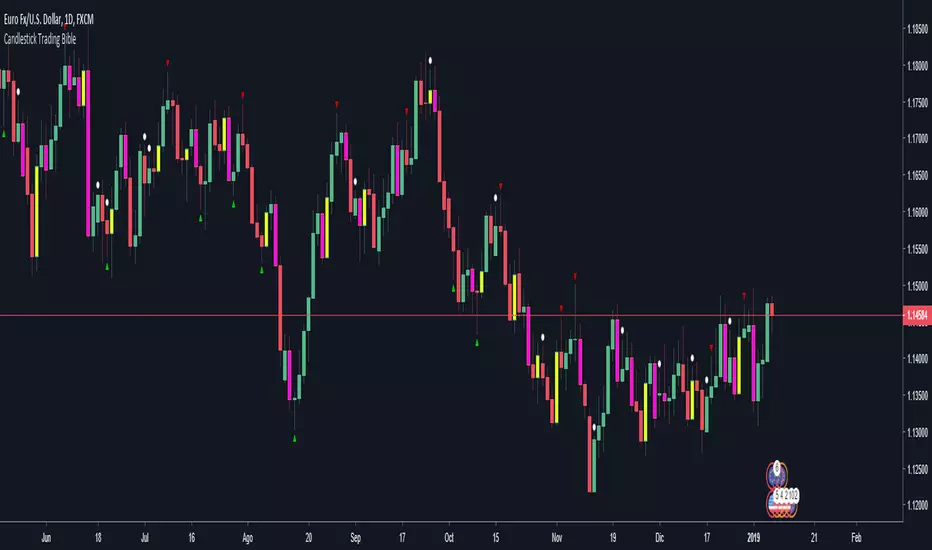
Candlestick Trading Bible pack: Engulfing + Pin bar + Inside barHelpful indicator that overlays the price with colors and arrows for understanding easily engulfing, pin bar and inside bar formations as seen in the book "The Candlestick Trading Bible" IG of writer: @price.action.strategies
How it works:
-Bullish engulfing: yellow
-Bearish engulfing: fuchsia
-Pin bars: up/down green/red arrows
-Inside bars: white circle above the inside candle
----------
I do not have any relationship with the writer or the book mentioned above. The explanations in it may differ from what is drawn on the graph.
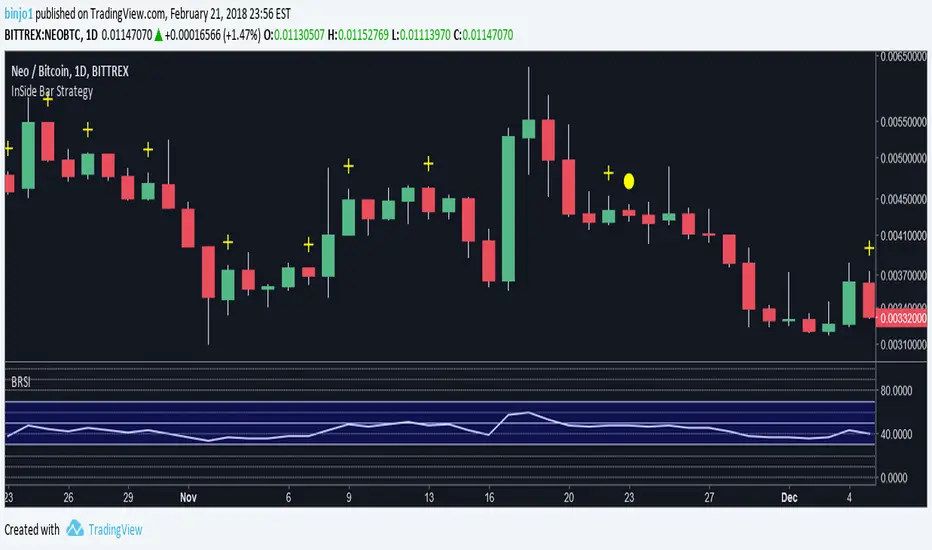
RSI Candle Bar with Inside BarThis Indicator is RSI convert into Candle Bar with Inside Bar Candle
How to use :
Do Some setting
RSI Overbought - 60 It will shows in Blue Candle Bar means Bullish Signal
RSI Oversold - 40 It will shows in Yellow Candle Bar means Bearish Signal
Inside Bar Candle -
Gray or Black Bar --- Which is Shows that Trend may be Reverse or Big Move may be come.
Colors you can be change according to your convenience.

7 Inside Bars with Full Range Box (15m)his indicator detects periods of extreme price compression by identifying 7 consecutive inside bars on the 15-minute timeframe. An inside bar is a candle that forms within the high and low of the previous candle. When 7 such bars occur in a row, it's a strong signal of market indecision and potential breakout.
What it does:
Detects if the last 7 candles are all inside the range of the 8th candle (the outer bar).
Highlights the consolidation zone by drawing a fuchsia-colored box from the high to low of the outer candle.
Marks the final candle in the sequence with a small "7IN" label below the bar.
This setup can help traders spot high-probability breakout zones and prepare for potential volatility after extended consolidation.
🔍 Best Used For:
Breakout trading
Volatility expansion strategies
Trade setups following tight consolidation
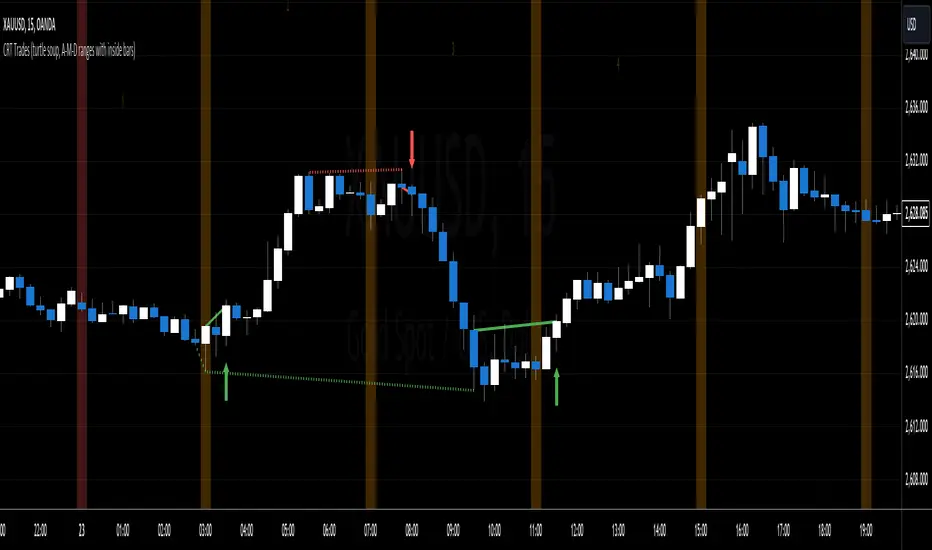
CRT Trades (turtle soup, A-M-D ranges with inside bars)CRT means Candle Range Theory. Every single candle is a range, on every single timeframe. Ranges may be either manipulated - turtle souped or broken - engulfed - closed above/below and retested.
CRT is usually presented as a 3 candle model. However it may consist of more than 3 candles due to inside bars. Inside bar is the candle where high is not higher then previous candle high and low is not lower then previous candle low.
First candle represents accumulation (may consist of more candles - inside bars), second candle represents manipulation (turtle soup) and third candle represents distribution. The abbreviation for that is A-M-D.
In accumulation the range with specific high and low is created. In manipulation (turtle soup) the high or low of the range is manipulated - liquidity taken and price should usually reverse back to the range. In distribution price is reversing back to the opposite side of the range. On higher timeframe it looks like manipulation candle wick is higher/lower than previous range high/low (may consist of 1 or more inside bar candles) but the body must not close above/below previous range high/low. Otherwise it is not manipulation (turtle soup) most likely and price should continue in direction of the candle close. Distribution candle should touch opposite side of range and it is mostly heavy and fast candle.
CRT model can be found on higher timeframe (e.g. 4h) and entries can be found on lower timeframe (e.g. 15m). You always use only lower timeframe on your chart because CRT model on the higher timeframe is shown on the lower one and also you can plan entries on the lower timeframe. You are able to change CRT model higher timeframe in the indicator settings.
There are two types of entries:
simple - wait for manipulation candle to close on higher timeframe (HTF) and then enter on lower timeframe (LTF) above open of the distribution candle on HTF if it is short or on LTF below open of the distribution candle on HTF if it is long. These entries can be done by market order.
advanced - wait for the break of previous range high/low and enter by limit order when price reverses back to the range and retraces to the order block or fair value gap created by the breaker candle.
Stop loss can be placed above/below of the top/bottom created by manipulation candle. First take profit should be placed in 1/2 of the accumulation range and second take profit should be placed at the opposite range of accumulation range.
It is possible to filter only particular accumulation (range) and manipulation (turtle soup) candles depending also on timezone set in the settings. For example on 4h CRT model if you fill input "indices" for section "range" like 1,2 and input "indices" for section "turtle soup" like 3,4 then you are awaiting the range to form during asia session and manipulation during london session if the timezone is somewhere around "UTC+2".
Dotted lines represent turtle soup of previous range and solid lines represent engulfing candle of the breaker candle on lower timeframe. When the engulfing is closed you can look for entries either by market order after closing or by limit order when the price retraces to order block (created by breaker candle) or fair value gap (created by engulfing).
Recommendations for combining lower (entries) and higher (crt model) timeframes:
1D CRT model => 1h entries,
4h CRT model => 15m entries,
1h CRT model => 5m entries,
15m CRT model => 1m entries.
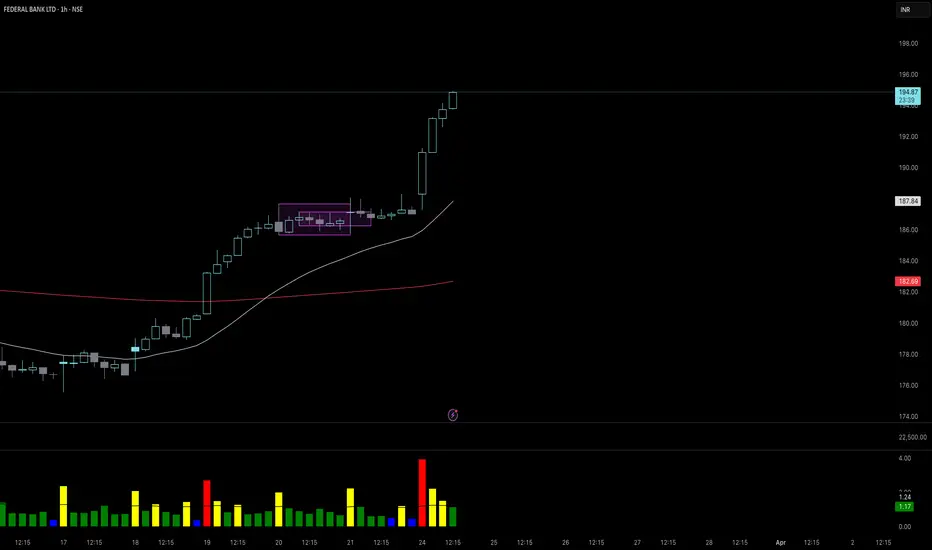
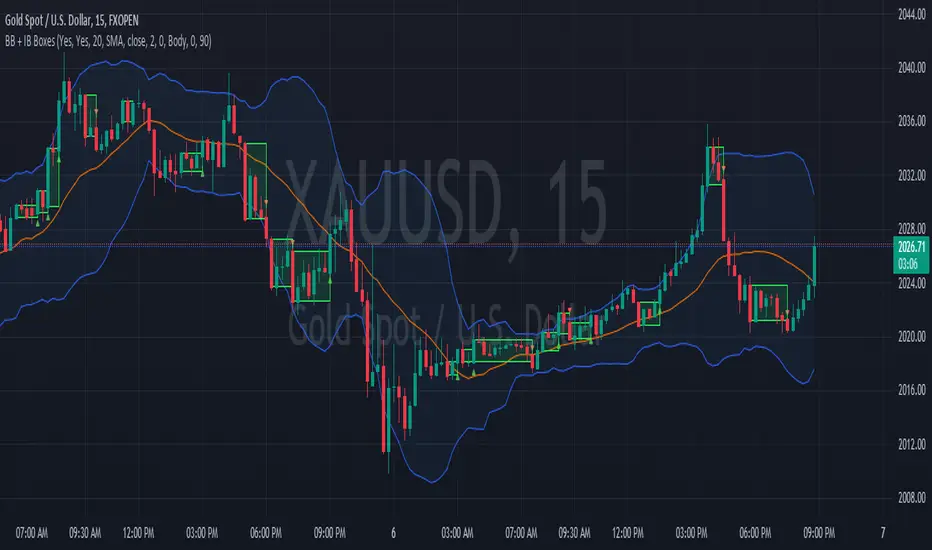
Bolingger Bands + Inside Bar BoxesBollinger Bands are a technical analysis tool consist of three bands—an upper, middle, and lower band—that are used to spotlight extreme short-term prices in a security. The upper band represents overbought territory, while the lower band can show you when a security is oversold. Most technicians will use Bollinger Bands® in conjunction with other analysis tools to get a better picture of the current state of a market or security.
An Inside Bar is a two-bar price action trading strategy in which the inside bar is smaller and within the high to low range of the prior bar. Inside bars show a period of consolidation in a market. They often form following a strong move in a market, as it ‘pauses’ to consolidate before making its next move. However, they can also form at market turning points and act as reversal signals from key support or resistance levels.
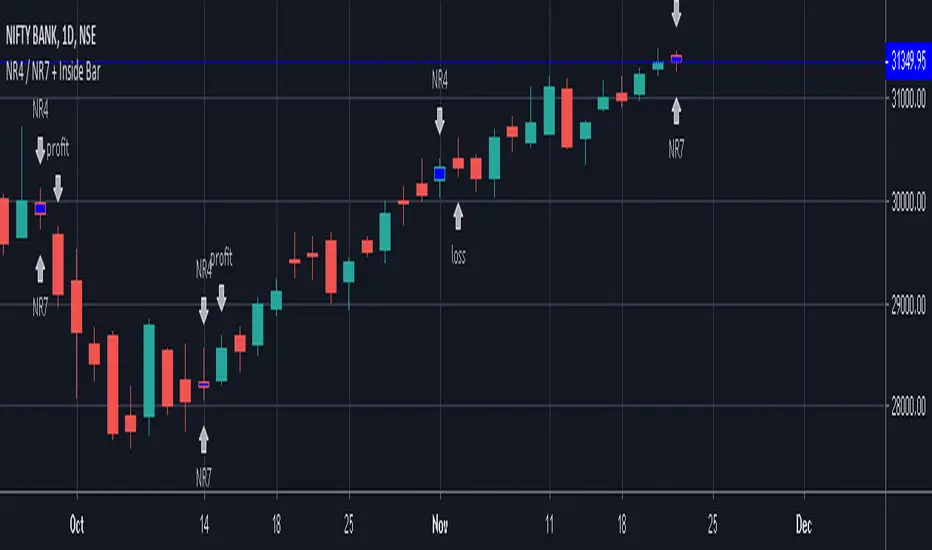
NR4 / NR7 + Inside BarIndicator Script for identifying Narrow Range 4 / 7 + Inside Bar
It also helps to check whether NR4 / NR7 breakout trading has been profitable or not in the past in a particular instrument.
It has helped me to select profitable scripts and avoid losing ones. Can be used for anytime frame.
SIGNAL
NR4 == Narrowest range of 4 periods + signal day is an inside bar
NR4 & NR7 == Narrowest range of 7 periods + signal day is an inside bar
SIGNAL "PROFIT" -
Prior day was NR4 / NR7 and next day price broke out of prior day range in 1 direction and closed in the direction of breakout away from breakout price, resulting in a profit trade.
SIGNAL "LOSS" -
Prior day was NR4 / NR7 and next day price broke out of prior day range and returned back to close inside the narrow zone OR went in opposite direction after the initial breakout, resulting in a loss trade.
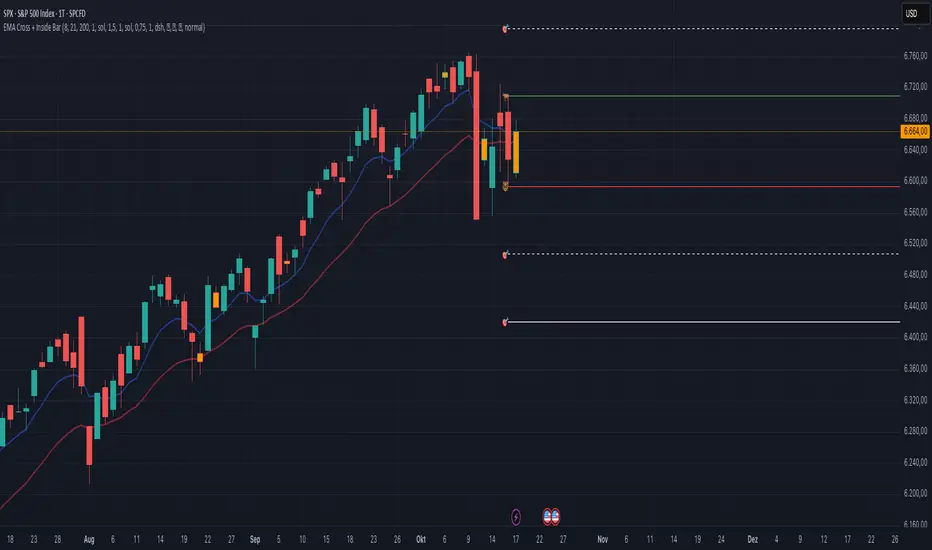
EMA Cross + Inside BarWith the EMA Cross + Inside Bar script you can spot inside bars instantly.
Based on the inside bar there is a call and a put trigger to help you find the key areas to look for long/short positions.
It's also possible to show possible target areas based on a multiplier.
The script is highly customizable and will be improved in the future.
If you have questions or feedback just message me via X.
And don't forget: Always do your own research :)
Screener Inside BarsBased on the teachings of Rob Smith
1= Inside Candle
2= Goes past the previous candle's price up or down
3= Goes past the previous candle's price on both sides
Ability to change the timeframe and the symbols this indicator is scanning through in the input tab under settings of this indicator. Maximum symbols 40.
Looking for inside bars within 40 symbols. By default some symbols are entered in the indicator already. They cannot be left empty. If left empty, an error comes up and the script doesn't load.
By changing the timeframe, inside bars can be looked under many timeframes like Monthly, Weekly, Dialy, Intraday, etc.
First label is for all of the symbols the indicator is scanning.
Second label is the result of the scan. Text is bigger than in this label than the first label to differentiate from the first label and for ease of use.
Please DM me on how to access this indicator.

Outside & Inside BarOutside & Inside Bar Indicator — highlights and alerts two key candle patterns: outside bars (high–low breakouts) and inside bars (range contractions).
You can independently enable or disable signals, highlights, and arrows for each type.
Includes session filtering, custom colors, and optional alerts for bullish and bearish setups.

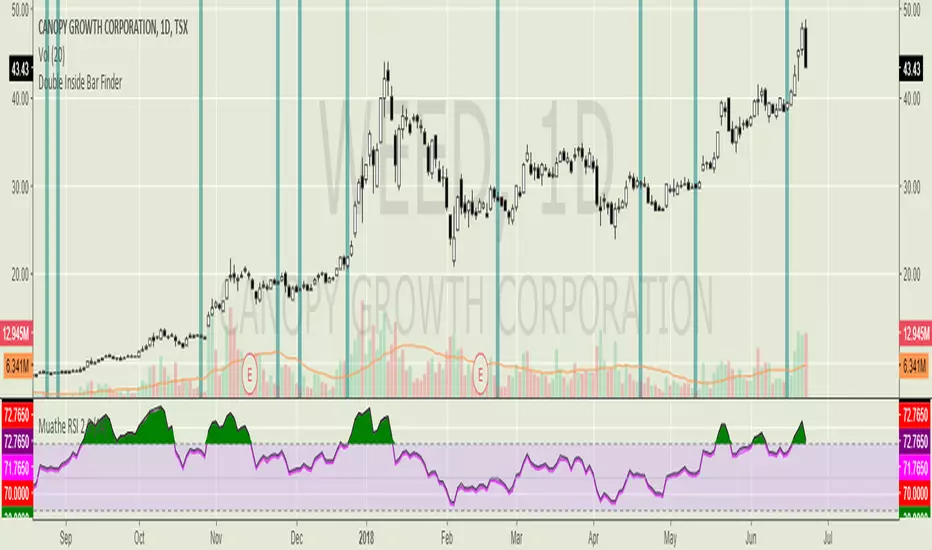
Double Inside Bar FinderHighlights in blue when an inside bar follows an inside bar. Double inside bars (when used on the daily timeframe) are a way of easily finding equilibrium patterns (i.e. pennant shaped price action) on lower time frames. There is usually a strong move in whatever direction these patterns break, so good to have alerts set up for your favourite markets.
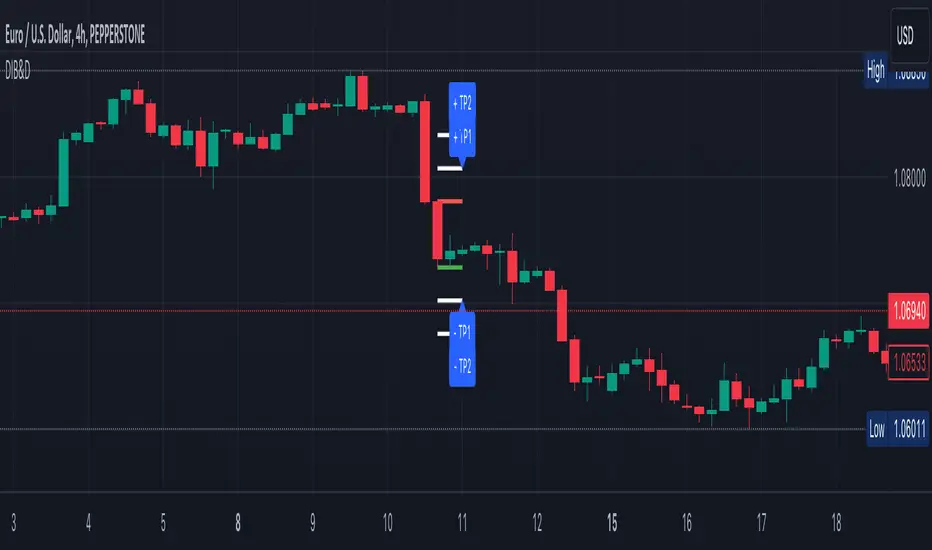
Double Inside bar with drift - by Yasser Mahmoud (YWMAAAWORLD)This is a new indicator that detects double inside bars with the condition that their base bar is either shifted above or below (i.e. both base bar's high and low are higher or lower than the mother bar's high and low respectively)
it plots lines at the top and bottom of the mother bar and 2 TPs above and 2 TPs below.
Double Inside Bar Scanner [Daily]Double Inside Bar Scanner . Captures Double Inside based on last 2 daily Bars
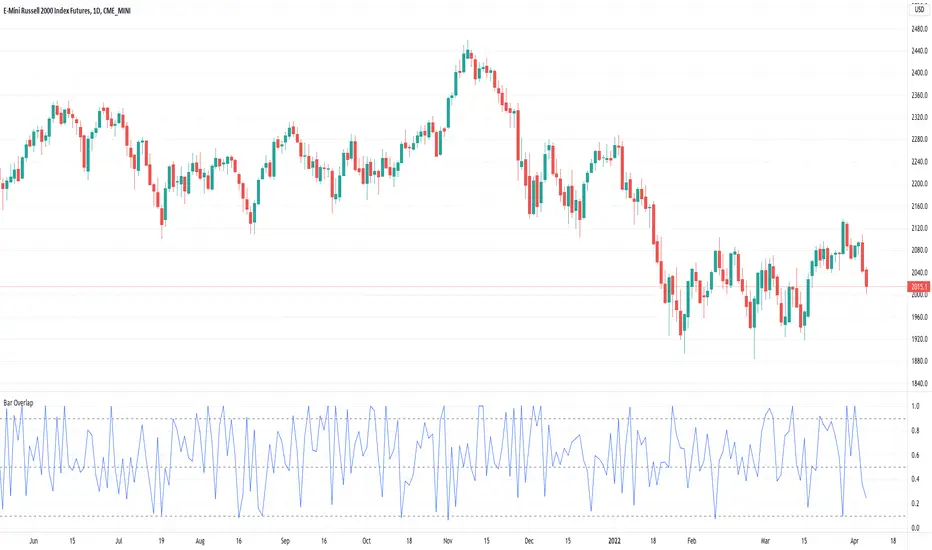
Bar Overlap - Sort of inside barsCalculates the amount the current bar overlaps with the previous bar as a percentage. 1 = totally overlapping (inside bar) , 0 = no overlap at all
EMA Cross 9,21,50,80,200 + Inside barEste script faz o seguinte:
1. Plota 5 EMAs (9,21,50,80,200)
2. Faz crossover da 9x21 e 21x50
3. Colore inside bar em amarelo (é possível ainda colorir diferentemente bullish e bearish inside bar)

MACD (Moving Average Convergence/Divergence) + Inside BarMACD (Moving Average Convergence/Divergence) + Inside Bar so that free users can have two things in same indicator.
Script is open for everyone.
Check and test the code of Inside Bar and let me know if it is correct.
Feel feel to share.

Better Inside BarsIndicates a single inside bar with a yellow plus symbol and two inside bars in a row with a yellow circle.
Inside Breakout - inside bar - PerQuantumCoin Premium IndicatorHOW IT WORKS:
- The Inside Breakout gives signals on the chart on the breakout of inside bar chart pattern;
- It allows to trade trend or counter-trend signals;
- Computes intrinsic values to access the strength of the Buy/Sell signal;
- Allows users to adjust their own settings, adapting the signals produced;
- These signals can be also set up as Alerts;
- The indicator has a few custom features that allows users to filter out signals using multi-timeframe trend indicator and to keep tracking positions so that one can only get new signals when they reserve position;
This Script is meant to help traders easily identify great entry opportunities.
The Script does NOT repaint signals.

Multicross - golden/death cross indicator with inside barThis script utilizes five exponential moving averages, golden/death cross flags and inside bars. The EMAs are: 8,13,21,55 and 100. The cross flags appear when: 1st fastest crosses the 2nd fastest, 2nd fastest crosses the 3rd fastest and so on and so forth. Inside The script originated after I watched the youtube video with Philakone talking about swing trades. I started the the four EMAs he used and then decided to add the 100 to add a little more weight to the projected movements. I've noticed sometimes when inside bars and a golden crosses happen simultaneously the movements are more explosive.

Trading margin, inside bars and outside barsThe indicator shows the trading range and the average trading range over a freely selectable period. Inside bars and outside bars are color-coded in the chart.
Der Indikator zeigt die Handelspanne und die durchschnittliche Handelspanne über eine frei wählbare Periode. Im Chart werden Innenstäbe und Außenstäbe farblich gekennzeichnet.
