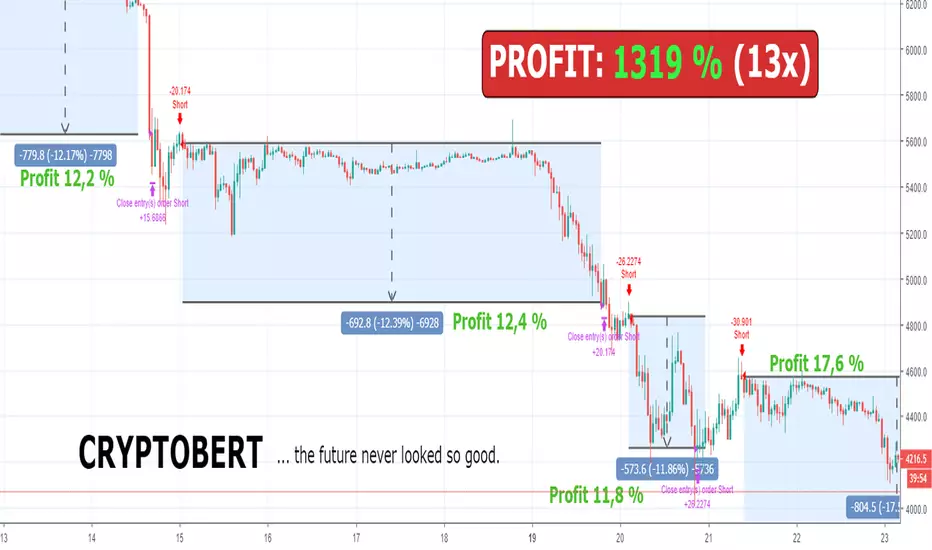
Bert LONG BTC Strategy - Profit 2018: 1319 % (without leverage)Bert LONG Term BTC Strategy (BITMEX)
This is a revolutionary strategy for bitcoin (XBT) trading. The strategy is perfectly configured for trading on the Bitmex exchange. No further configuration and setup is required.
The strategy itself recognizes a volatile period or whether the market is in downtrend, uptrend or sideways. Accordingly, it applies the appropriate orders to reach maximum profit.
The strategy can be handled manually, you can receive alerts (popup, email, sms) or can be fully automated by bot (works with: Autoview, Gunbot, Profitview, Jubot and others) without any manual intervention.
What is the minimum and maximum capital I can trade with?
You can trade with 0.0001BTC – 1000BTC. That is one of many advantages of using this strategy on XBT. There is enough liquidity to execute the order for the market price with a big investment amount.
What is the recommended setting?
Timeframe: 45m
Chart: Bitcoin/USD Dollar Perpetual Inverse Swap Contract (XBT)
Leverage: 2x
Orders: Long and Shorts
Why was this strategy created?
You have basically two option how to make money in crypto market. HODL (buy the coin and believe it will rise to the moon) and TRADING (only 3-5% traders are profitable, most of them are full time traders with 5+ years of experience in trading).
If you HODL btc in this year, you are -70 % this year
If you are TRADING, the results depend on how good you are (think about this, if you decide to be a heart surgeon, rocket star or NBA player, do you think you can be? Yes, you can but the chances are very small. The same probability you have that you will be in the 3-5% profitable traders 😊). It takes time, you need experience and still 96% all of you will never be a profitable traders!
If you use Bert BTC long term strategy, you are + 1319 % this year
How well the Bert BTC strategy performs?
Profit in 2018 was 1319 % / 13x (without leverage)
Profit in 2018 was 11 477 % / 115x (with leverage 2)
If you invested (with leverage 2) 1 000 USD you have now 114 766 USD
If you invested (with leverage 2) 10 000 USD you have now 1 147 660 USD
Detailed trades report for 2018 (you can calculate your own profit with specific investments and leverage) – download excel here
Notes:
You will hardly find better strategy on the market which achieves similar results with minimal risk and can operate in any market condition (downtrend, uptrend, sideways).
We guarantee the strategy does not repaint, and we use real candles (not heikin ashi or renko which does not reflect real prices).
We wish you to become financially independent and all your secret wishes to be fulfilled.
And in case if you still want to HODL or you want to be TRADING all the days watching to your monitors, consider to try our strategy at least with a minimum capital invested, you will see that you will not regret in long run. Be patient and the money will come to you!
For access to this strategy visit website: www.cryptobert.io
Search in scripts for "liquidity"
Support/Resistance Algo-Tradeing StrategyThis strategy Automates Support and resistance trading and a tight trailing stop loss technique. The support and resistance levels are calculated from previous highs and lows; these levels are used to make two types of trades:
1. Break out trades, taking a trade if the market is able to push through a support or resistance level.
2. Liquidity pool rejection, also known as a stop loss hunt. When the market is brought past a key level (to take out stop losses) which traders (usually institutions) use to enter, which then reverses back through the support/resistance level where the strategy enters a trade.
An optional "volatility filter" may be used when on a suitable market. This means that trades are only entered when there is suitable volatility.
A tight stop loss is kept so most trades lose, but winning trades are left to run much further. So this is a very reliable profitable strategy on many markets.
For a limited time I will provide access to this strategy for free as it is not yet complete, there is still testing to do and I would appreciate any feedback.

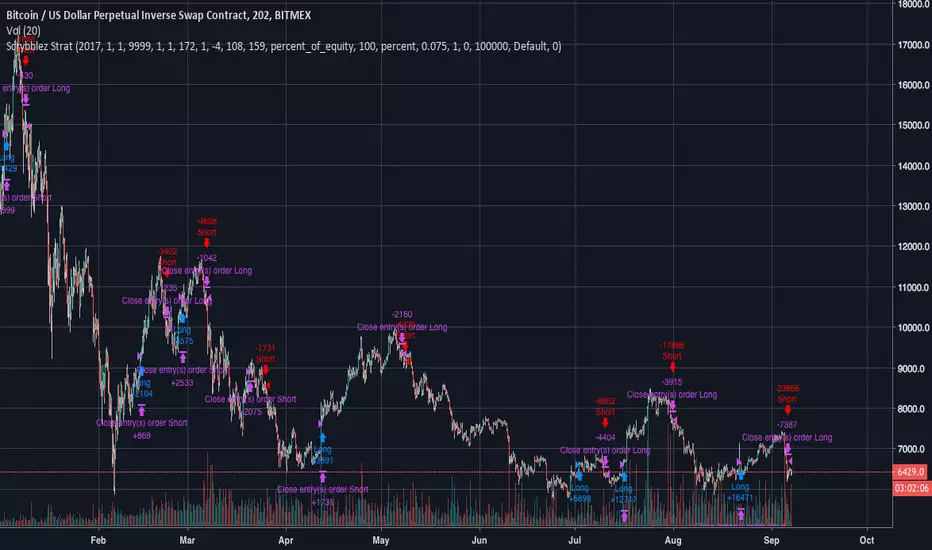
Scrybblez Strategy## Scrybblez Strategy ##
How does this strategy work?
This strategy works particularly well with Bitcoin and can be applied to volatile coins with big swings, but properly configured it will perform decently coins with smaller movements.
Request access for a trial here or by twitter to @scrybblez
It comes preconfigured with settings for 202 minutes, and already takes into account that each transaction will have a commission of 0.075% (Binance and Bitmex both have this comission at the moment) and assumes you'll be starting with a capital of 100,000 and put 100% of this capital into each trade. This works for Bitcoin but fails for some coins when there's not enough liquidity, to have the strategy work with smaller coins change your capital down from 100,000 to 1 or 5 (this will basically be telling Tradingview that you have 1-5 BTCs to trade and not 100,000 BTC).
What timeframes does it work on?
The strategy is particularly setup to work on 202 minutes but will perform well in 1h-6h timeframes.
To use it in different timeframes to its optimum output mainly focus on increasing/decreasing accordingly the following values:
- Bull/Bear EMA Range
- Upper StopLoss band
- Lower StopLoss band
Noise filters play a smaller (but important) role on avoiding too many false entries.
- Bull noise filter
- Bear noise filter
What are all these options I see ?
0.Shorting
Toggle this option on/off depending on if you are in a platform that allows you to short (Bitmex, Bitfinex,...) or a platform that does not allow you to do so (Binance, KuCoin,...).
1. Time function
This strategy comes equipped with a time function that allows you to backtest from any given date to any given date.
Properties:
- From Year
- From Month
- From Day
- To Year
- To Month
- To Day
2. Noise Filtering/Smoothing
To avoid too many false entries the strategy filters noise with several algorithms, you can enable/ disable this Noise filter by turning it on/off with "Use Smoothing" and can configure it's noise cleaning properties with other properties. You can, if you wish, colour your background to easily identify what's the current trend we're on (bear in mind that the indicator does not necessarily exit on Bull/Bear trends if it detects them as temporary or weak ones).
Properties:
- Use Smoothing
- Bull noise filter
- Bear noise filter
- Color Bull/Bear Runs
3. StopLoss Bands
Initially both bands were being used to terminate entries if crossed, but right now they work in conjunction with other internal calculations to determine if we should enter a trade and in minor degree to exit. With the latest changes included in the algorithm, we do not use SL bands to IMMEDIATELY exit positions, but the option is there.
Poperties:
- Upper SL Band
- Lower SL Band
- Use SL Bands to Open Positions.
- Use SL Bands to Close Positions.
4.Ichimoku
By turning this on, you'll plot Ichimoku with Bitcoin settings, you can change it to its original settings by clicking the next option.
Can you give me examples on how well it performs?
Following this strategy from the 1st of January of 2017 until today 7th of September of 2018 would've netted you (comission already substracted) 49286% returns.
Following this strategy from the 1st of September of 2017 until today 7th of September of 2018 would've netted you (comission already substracted) 3941% returns.
Following this strategy from the 1st of January of 2018 until today 7th of September of 2018would've netted you (comission already substracted) 583.96% returns.
Give time to the strategy
BTC MTF Directional average (1h/2h res)1h or 2h resolution
Any market without multiple weekly binary data events and enough liquidity (eg. Bitcoin)
**For bitcoin use preferably on bitfinex or an index of all exchanges and exchange volume. Most of the price manipulation occurs at bitfinex, other exchanges will often be slightly behind.
V 0.0.1
** KNOWN ISSUES
Around the time of the new daily candle (2AM GMT+1 on BTC) false signals may occur due to 24 hours being the highest resolution.
Repainting: due to the nature of tradingview's pinescript these false signals will disappear after 2-3 new candles and refreshing the page.
** UPDATES
Added browser alerts (untested)
Tip: Don't always wait for the bot to flip to risk off when volatility kicks in (eg. during wash trades).
