Rawstocks 15 Minute ModelRawstocks 15-Minute Model
The Rawstocks 15-Minute Model is a precision intraday trading strategy designed for the US stock market (9:30 AM - 4:00 PM ET), optimized for the 15-minute timeframe. It combines institutional order flow concepts with Fibonacci retracements to identify high-probability reversal setups while enforcing strict risk management and session-based rules.
Key Features
Time-Based Execution
Trading Hours: 9:30 AM - 4:00 PM ET (no new entries after 4:00 PM)
Force Close: All positions auto-exit at 4:30 PM ET (prevents overnight risk)
Entry Logic
Order Block + Fib Confluence:
Identifies institutional order blocks (previous swing highs/lows)
Requires price pullback to 61.8% or 79% Fibonacci level
Liquidity Confirmation:
Waits for stop runs (liquidity sweeps) before reversal entries
Exit Rules
Stop Loss: 1x ATR (14) from entry
Take Profit: 2:1 Risk-Reward (adjustable)
Visual Signals
Green Triangle: Valid long setup (pullback to bullish OB + Fib)
Red Triangle: Valid short setup (pullback to bearish OB + Fib)
Blue/Purple Background: Highlights active trading vs. close period
How It Works
Identify the Setup
Wait for a strong impulse move (break of structure)
Mark the order block (institutional zone)
Confirm Pullback
Price must retrace to 61.8% or 79% Fib level
Must occur within trading hours (9:30 AM - 4:00 PM)
Enter on Confirmation
Long: Break of pullback candle high (stop below recent swing low)
Short: Break of pullback candle low (stop above recent swing high)
Manage the Trade
Trail stop or exit at 2R (risk-to-reward)
All positions close at 4:30 PM sharp
Search in scripts for "liquidity"

Hyperion Crypto Matrix: Ultimate Market Sentinel
// 🔰 HYPERION CRYPTO MATRIX: ULTIMATE MARKET SENTINEL
// ─────────────────────────────────────────────────────────────────────────────
/*
The **Hyperion Crypto Matrix** is an advanced crypto trend-following strategy built from the ground up for precision, not just performance. Unlike traditional “mashups” of indicators, this system was **engineered around synergy**—each module is purpose-driven and non-redundant, delivering fast, filtered, high-probability signals in volatile crypto markets.
─────────────────────────────────────────────────────────────
📌 STRATEGY PURPOSE
─────────────────────────────────────────────────────────────
Hyperion is built for **1-hour crypto trading** and optimizes for:
- High Win Rate
- Early Exits on Trend Weakness
- Partial Position Scaling (TP1/TP2)
- Real-time trade performance tracking
It is ideal for traders who want **real-time trade logic** with:
- No repainting
- No overfitting
- Realistic entry/exit structure
- No same-bar entry & exit (enforces 1-bar delay)
─────────────────────────────────────────────────────────────
🧠 WHAT MAKES IT ORIGINAL
─────────────────────────────────────────────────────────────
Each component is **custom-integrated** with strict role separation:
- **Trend Direction:** Enhanced Wave Oscillator (EWO) with adaptive band filtering
- **Trend Strength Memory:** Relative Momentum Index (RMI) with threshold locking
- **Volume Confirmation:** Historical relative volume spike filter using SMA multiplier
- **Momentum Weakness Exit:** Combined ROC and CCI to detect early reversal before price turns
- **Position Tracking:** TP1 (50% exit), TP2 (100% close) with cooldown to prevent whipsaws
- **Dynamic Dashboard:** Real-time stats including win rate, PnL efficiency, and TP hit status
These aren’t just “plugged in” indicators—they are synchronized to **filter, confirm, and adapt** to price action with timing logic that prevents premature entries or late exits.
─────────────────────────────────────────────────────────────
📊 INDICATOR LOGIC OVERVIEW
─────────────────────────────────────────────────────────────
1. **📈 Enhanced Wave Oscillator (EWO):**
- Calculates the delta between a fast and slow EMA (5 vs. 34 by default)
- Uses a dynamic banding system to detect peaks/troughs and prevent entries during exhaustion
- Filters only active, accelerating trends — reducing false positives
2. **🧠 Relative Momentum Index (RMI):**
- Similar to RSI but with a forward-looking momentum comparison
- Confirms trend *persistence* over time, preventing entries on short-term flips
- Long entries only allowed when RMI > threshold (default 55), short if RMI < 45
3. **🔊 Volume Spike Filter:**
- Uses 20-bar SMA of volume and a multiplier (1.5x default) to detect **relative volume breakouts**
- Prevents trades in low-liquidity environments (e.g., chop, overnight sessions)
4. **📉 Weak Trend Close Logic:**
- Combines Rate of Change (ROC) and Commodity Channel Index (CCI)
- Detects early signs of momentum deterioration, often before the trend visually reverses
- Triggers exit before price falls into sideways zones
5. **🎯 Take Profit System (TP1/TP2):**
- TP1: 50% position closed at +2% (default)
- TP2: Full close at +4% (default)
- Uses `strategy.exit()` with limit orders based on entry price
6. **⏱️ Reentry Cooldown:**
- After TP2 or weak trend exit, system enforces a 1-bar delay before reentry
- Avoids frequent churn in flat or noisy environments
7. **📋 Real-Time Dashboard (Optional):**
- Displays live trade status, PnL metrics, TP1/TP2 hit status, bars since entry, win rate %, and profit factor
- Color-coded background to highlight active trade direction (green for long, red for short)
─────────────────────────────────────────────────────────────
⚙️ HOW TO USE
─────────────────────────────────────────────────────────────
1. Load on a 1H chart of a crypto asset with good liquidity (e.g., BTC, ETH, LINK)
2. Toggle between \"Long Only\", \"Short Only\", or \"Both\" in the settings
3. Use default TP1/TP2 percentages, or tune them for the asset’s volatility
4. Observe trade execution and live stats on the optional dashboard
5. Review the bar coloring for EWO trend bias confirmation
> Stop-loss logic is not included. This strategy assumes exits occur at TP2 or on trend/momentum failure.
─────────────────────────────────────────────────────────────
⚖️ TRADINGVIEW COMPLIANCE & USAGE DISCLAIMER
─────────────────────────────────────────────────────────────
This strategy does **not repaint**, is fully compatible with **TradingView backtesting**, and adheres to all known Pine Script execution rules.
⚠️ **Disclaimer:** This script is for educational purposes only and does not constitute financial advice. Trading cryptocurrencies involves significant risk. Always test strategies on a demo account and consult with a financial advisor before live trading.
─────────────────────────────────────────────────────────────
🧪 CONCLUSION
─────────────────────────────────────────────────────────────
The **Hyperion Crypto Matrix** is not a mashup—it’s a **modular, optimized, logic-driven system** crafted for real-world crypto trading. Every component has been tuned for function, not fluff. Whether you're backtesting or live trading, this system is designed to give you **structured, actionable edge** with live feedback every step of the way.
*/

02 SMC + BB Breakout (Improved)This strategy combines Smart Money Concepts (SMC) with Bollinger Band breakouts to identify potential trading opportunities. SMC focuses on identifying key price levels and market structure shifts, while Bollinger Bands help pinpoint overbought/oversold conditions and potential breakout points. The strategy also incorporates higher timeframe trend confirmation to filter out trades that go against the prevailing trend.
Key Components:
Bollinger Bands:
Calculated using a Simple Moving Average (SMA) of the closing price and a standard deviation multiplier.
The strategy uses the upper and lower bands to identify potential breakout points.
The SMA (basis) acts as a centerline and potential support/resistance level.
The fill between the upper and lower bands can be toggled by the user.
Higher Timeframe Trend Confirmation:
The strategy allows for optional confirmation of the current trend using a higher timeframe (e.g., daily).
It calculates the SMA of the higher timeframe's closing prices.
A bullish trend is confirmed if the higher timeframe's closing price is above its SMA.
This helps filter out trades that go against the prevailing long-term trend.
Smart Money Concepts (SMC):
Order Blocks:
Simplified as recent price clusters, identified by the highest high and lowest low over a specified lookback period.
These levels are considered potential areas of support or resistance.
Liquidity Zones (Swing Highs/Lows):
Identified by recent swing highs and lows, indicating areas where liquidity may be present.
The Swing highs and lows are calculated based on user defined lookback periods.
Market Structure Shift (MSS):
Identifies potential changes in market structure.
A bullish MSS occurs when the closing price breaks above a previous swing high.
A bearish MSS occurs when the closing price breaks below a previous swing low.
The swing high and low values used for the MSS are calculated based on the user defined swing length.
Entry Conditions:
Long Entry:
The closing price crosses above the upper Bollinger Band.
If higher timeframe confirmation is enabled, the higher timeframe trend must be bullish.
A bullish MSS must have occurred.
Short Entry:
The closing price crosses below the lower Bollinger Band.
If higher timeframe confirmation is enabled, the higher timeframe trend must be bearish.
A bearish MSS must have occurred.
Exit Conditions:
Long Exit:
The closing price crosses below the Bollinger Band basis.
Or the Closing price falls below 99% of the order block low.
Short Exit:
The closing price crosses above the Bollinger Band basis.
Or the closing price rises above 101% of the order block high.
Position Sizing:
The strategy calculates the position size based on a fixed percentage (5%) of the strategy's equity.
This helps manage risk by limiting the potential loss per trade.
Visualizations:
Bollinger Bands (upper, lower, and basis) are plotted on the chart.
SMC elements (order blocks, swing highs/lows) are plotted as lines, with user-adjustable visibility.
Entry and exit signals are plotted as shapes on the chart.
The Bollinger band fill opacity is adjustable by the user.
Trading Logic:
The strategy aims to capitalize on Bollinger Band breakouts that are confirmed by SMC signals and higher timeframe trend. It looks for breakouts that align with potential market structure shifts and key price levels (order blocks, swing highs/lows). The higher timeframe filter helps avoid trades that go against the overall trend.
In essence, the strategy attempts to identify high-probability breakout trades by combining momentum (Bollinger Bands) with structural analysis (SMC) and trend confirmation.
Key User-Adjustable Parameters:
Bollinger Bands Length
Standard Deviation Multiplier
Higher Timeframe
Higher Timeframe Confirmation (on/off)
SMC Elements Visibility (on/off)
Order block lookback length.
Swing lookback length.
Bollinger band fill opacity.
This detailed description should provide a comprehensive understanding of the strategy's logic and components.
***DISCLAIMER: This strategy is for educational purposes only. It is not financial advice. Past performance is not indicative of future results. Use at your own risk. Always perform thorough backtesting and forward testing before using any strategy in live trading.***

Arbitrage Spot-Futures Don++Strategy: Spot-Futures Arbitrage Don++
This strategy has been designed to detect and exploit arbitrage opportunities between the Spot and Futures markets of the same trading pair (e.g. BTC/USDT). The aim is to take advantage of price differences (spreads) between the two markets, while minimizing risk through dynamic position management.
[Operating principle
The strategy is based on calculating the spread between Spot and Futures prices. When this spread exceeds a certain threshold (positive or negative), reverse positions are opened simultaneously on both markets:
- i] Long Spot + Short Futures when the spread is positive.
- i] Short Spot + Long Futures when the spread is negative.
Positions are closed when the spread returns to a value close to zero or after a user-defined maximum duration.
[Strategy strengths
1. Adaptive thresholds :
- Entry/exit thresholds can be dynamic (based on moving averages and standard deviations) or fixed, offering greater flexibility to adapt to market conditions.
2. Robust data management :
- The script checks the validity of data before executing calculations, thus avoiding errors linked to missing or invalid data.
3. Risk limitation :
- A position size based on a percentage of available capital (default 10%) limits exposure.
- A time filter limits the maximum duration of positions to avoid losses due to persistent spreads.
4. Clear visualization :
- Charts include horizontal lines for entry/exit thresholds, as well as visual indicators for spread and Spot/Futures prices.
5. Alerts and logs :
- Alerts are triggered on entries and exits to inform the user in real time.
[Points for improvement or completion
Although this strategy is functional and robust, it still has a few limitations that could be addressed in future versions:
1. [Limited historical data :
- TradingView does not retrieve real-time data for multiple symbols simultaneously. This can limit the accuracy of calculations, especially under conditions of high volatility.
2. [Lack of liquidity management :
- The script does not take into account the volumes available on the order books. In conditions of low liquidity, it may be difficult to execute orders at the desired prices.
3. [Non-dynamic transaction costs :
- Transaction costs (exchange fees, slippage) are set manually. A dynamic integration of these costs via an external API would be more realistic.
4. User-dependency for symbols :
- Users must manually specify Spot and Futures symbols. Automatic symbol validation would be useful to avoid configuration errors.
5. Lack of advanced backtesting :
- Backtesting is based solely on historical data available on TradingView. An implementation with third-party data (via an API) would enable the strategy to be tested under more realistic conditions.
6. [Parameter optimization :
- Certain parameters (such as analysis period or spread thresholds) could be optimized for each specific trading pair.
[How can I contribute?
If you'd like to help improve this strategy, here are a few ideas:
1. Add additional filters:
- For example, a filter based on volume or volatility to avoid false signals.
2. Integrate dynamic costs:
- Use an external API to retrieve actual costs and adjust thresholds accordingly.
3. Improve position management:
- Implement hedging or scalping mechanisms to maximize profits.
4. Test on other pairs:
- Evaluate the strategy's performance on other assets (ETH, SOL, etc.) and adjust parameters accordingly.
5. Publish backtesting results :
- Share detailed analyses of the strategy's performance under different market conditions.
[Conclusion
This Spot-Futures arbitrage strategy is a powerful tool for exploiting price differentials between markets. Although it is already functional, it can still be improved to meet more complex trading scenarios. Feel free to test, modify and share your ideas to make this strategy even more effective!
[Thank you for contributing to this open-source community!
If you have any questions or suggestions, please feel free to comment or contact me directly.

Sunil 2 Bar Breakout StrategyDetailed Explanation of the Sunil 2 Bar Breakout Strategy
Introduction
The Sunil 2 Bar Breakout Strategy is a simple yet effective price-action-based approach designed to identify breakout opportunities in financial markets. This strategy analyzes the movement of the last three candles to detect momentum and initiates trades in the direction of the breakout. It is equipped with a built-in stop-loss mechanism to protect capital, making it suitable for traders looking for a structured and disciplined trading system.
The strategy works well across different timeframes and asset classes, including indices, stocks, forex, and cryptocurrencies. Its versatility makes it ideal for both intraday and swing trading.
Core Concept
The strategy revolves around two primary conditions: breakout identification and risk management.
Breakout Identification:
Long Trade Setup: The strategy identifies bullish breakouts when:
The current candle's closing price is higher than the previous candle's closing price.
The high of the previous candle is greater than the highs of the two candles before it.
Short Trade Setup: The strategy identifies bearish breakouts when:
The current candle's closing price is lower than the previous candle's closing price.
The low of the previous candle is lower than the lows of the two candles before it.
Risk Management:
Stop-Loss: For each trade, a stop-loss is automatically set:
For long trades, the stop-loss is set to the low of the previous candle.
For short trades, the stop-loss is set to the high of the previous candle.
This ensures that losses are minimized if the breakout fails.
Exit Logic:
The trade is closed automatically when the stop-loss is hit.
This approach maintains discipline and prevents emotional trading.
Strategy Workflow
Entry Criteria:
Long Entry: A long trade is triggered when:
The current close is greater than the previous close.
The high of the previous candle exceeds the highs of the two candles before it.
Short Entry: A short trade is triggered when:
The current close is less than the previous close.
The low of the previous candle is below the lows of the two candles before it.
Stop-Loss Placement:
For long trades, the stop-loss is set at the low of the previous candle.
For short trades, the stop-loss is set at the high of the previous candle.
Trade Management:
Trades are exited automatically if the stop-loss level is hit.
The strategy avoids re-entering trades until new breakout conditions are met.
Default Settings
Position Sizing:
The default position size is set to 1% of the account equity. This ensures proper risk management and prevents overexposure to the market.
Stop-Loss:
Stop-loss levels are automatically calculated based on the previous candle’s high or low.
Timeframes:
The strategy is versatile and works across multiple timeframes. However, it is recommended to test it on 15-minute, 1-hour, and daily charts for optimal performance.
Key Features
Automated Trade Execution:
The strategy handles both trade entry and exit automatically based on pre-defined conditions.
Built-In Risk Management:
The automatic stop-loss placement ensures losses are minimized on failed breakouts.
Works Across Markets:
The strategy is compatible with a wide range of instruments, including indices, stocks, forex, and cryptocurrencies.
Clear Signals:
Entry and exit points are straightforward and based on objective conditions, reducing ambiguity.
Versatility:
Can be used for both day trading and swing trading, depending on the chosen timeframe.
Best Practices for Using This Strategy
Backtesting:
Test the strategy on your chosen instrument and timeframe using TradingView's Strategy Tester to evaluate its performance.
Market Conditions:
The strategy performs best in trending markets or during periods of high volatility. Avoid using it in range-bound or choppy markets.
Position Sizing:
Use the default position size (1% of equity) or adjust based on your risk tolerance and account size.
Instrument Selection:
Focus on instruments with good liquidity and volatility, such as indices (e.g., NIFTY, BANKNIFTY), forex pairs, or major cryptocurrencies (e.g., Bitcoin, Ethereum).
Potential Enhancements
To make the strategy even more robust, consider adding the following optional features:
Stop-Loss Multiplier:
Allow users to customize the stop-loss distance as a multiple of the default level (e.g., 1.5x the low or high of the previous candle).
Take-Profit Levels:
Add user-defined take-profit levels, such as a fixed risk-reward ratio (e.g., 1:2).
Time Filter:
Include an option to restrict trading to specific market hours (e.g., avoid low-liquidity times).
Conclusion
The Sunil 2 Bar Breakout Strategy is an excellent tool for traders looking to capitalize on breakout opportunities while maintaining disciplined risk management. Its simplicity, combined with its effectiveness, makes it suitable for traders of all experience levels. By adhering to the clearly defined rules, traders can achieve consistent results while avoiding emotional trading decisions.
This strategy is a reliable addition to any trader’s toolbox and is designed to work seamlessly across different market conditions and instruments.

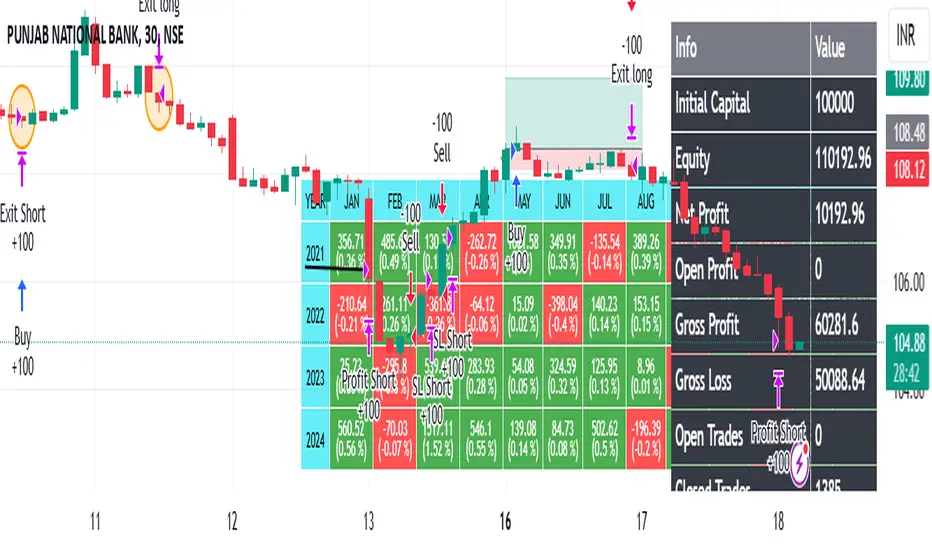
ROBO STB GainCraft strategyPure Price Action Candlestick Strategy by ROBO STB
Overview
This strategy is built entirely on the principles of price action and candlestick analysis, designed for traders who prefer raw market data over traditional indicators. By focusing solely on candlestick patterns and their context within recent price movements, the strategy identifies high-probability entry and exit points in liquid markets.
Entry signals are generated based on these patterns appearing at significant market locations, such as after consolidations, pullbacks, or at key support/resistance levels.
Price Action Integration:
Instead of relying on oscillators or moving averages, the script leverages the inherent market structure provided by candlesticks to interpret potential trend reversals or continuations.
This approach provides a clearer view of market sentiment.
No External Indicators:
This script avoids the use of traditional indicators like RSI, MACD, or Bollinger Bands, offering a clean, uncluttered chart.
Risk Management (Optional):
Fixed-percentage risk management options can also be enabled, ensuring trades remain within acceptable risk parameters.
How the Strategy Works
Entry Conditions:
Buy Entry: A bullish candlestick pattern (e.g., bullish engulfing) forms after a period of consolidation or pullback, indicating potential upward momentum.
Sell Entry: A bearish candlestick pattern (e.g., bearish engulfing) suggests a downturn is likely.
Exit Conditions:
Exits are triggered by the appearance of reversal candlestick patterns or through predefined SL/TP levels.
The strategy adapts to varying market conditions by analyzing candlestick structures dynamically.
Ideal Use Cases
Short-Term Trading: Designed for day traders and scalpers targeting quick moves on shorter timeframes.
Highly Liquid Markets: Performs best in markets with high liquidity, such as Nifty, Bank Nifty, or major forex pairs, where candlestick patterns provide reliable signals.
30-Minute Timeframe: For optimal results, the strategy is recommended for use on a 30-minute timeframe.
Transparency and Realism
Backtesting Parameters:
The default backtesting settings simulate realistic trading conditions, including commissions and slippage, ensuring that results are not misleading.
Trade sizes are calibrated to risk sustainable amounts (.05% maximum equity per trade).
Dataset Selection:
This strategy has been tested on diverse datasets to produce a statistically significant number of trades, ensuring robust performance evaluation.
Why This Strategy is Unique
This script stands apart by offering a refined approach to price action trading. Unlike generic indicator mashups, it provides traders with an actionable, candlestick-focused methodology tailored for volatile, high-liquidity markets.
The strategy is both simple to understand and powerful in execution, making it an excellent tool for traders who want to develop their skills in raw price action analysis while maintaining strict risk management.
Key Features
Candlestick-Based Entry and Exit Signals:
1. Risk Management:
- Risk-to-Reward Ratio (RTR):
Set a customizable risk-to-reward ratio to calculate target prices based on stop-loss levels.
Default: 3:1
order size added -100
2. Opening Range Identification
- Opening Range High and Low:
The script detects the high and low of the first trading session using Pine Script's session functions.
These levels are plotted as visual guides on the chart:
- High: Lime-colored circles.
- Low: Red-colored circles.
3. Trade Entry Logic
- Long Entry:
A long trade is triggered when the price closes above the opening range high.
- Entry condition: Crossover of the price above the opening range high.
-Short Entry:
A short trade is triggered when the price closes below the opening range low.
- Entry condition: Crossunder of the price below the opening range low.
Both entries are conditional on the absence of an existing position.
4. Stop Loss and Take Profit
- Long Position:
- Stop Loss: Previous candle's low.
- Take Profit: Calculated based on the RTR.
- **Short Position:**
- **Stop Loss:** Previous candle's high.
- **Take Profit:** Calculated based on the RTR.
The strategy plots these levels for visual reference:
- Stop Loss: Red dashed lines.
- Take Profit: Green dashed lines.
5. Visual Enhancements
-Trade Level Highlighting:
The script dynamically shades the areas between the entry price and SL/TP levels:
- Red shading for the stop-loss region.
- Green shading for the take-profit region.
How to Use:
1.Input Configuration:
Adjust the Risk-to-Reward ratio, max trades per day, and session end time to suit your trading preferences.
2.Visual Cues:
Use the opening range high/low lines and shading to identify potential breakout opportunities.
3.Execution:
The strategy will automatically enter and exit trades based on the conditions. Review the plotted SL and TP levels to monitor the risk-reward setup.
Important Notes:
- This strategy is designed for intraday trading and works best in markets with high volatility during the opening session.
- Backtest the strategy on your preferred market and timeframe to ensure compatibility.
- Proper risk management and position sizing are essential when using this strategy in live markets.
Please let me know if you have any doubts.
SMC StrategyThis Pine Script strategy is based on Smart Money Concepts (SMC), designed for TradingView. Here's a brief summary of what the script does:
1. Swing High and Low Calculation: It identifies recent swing highs and lows, which are used to define key zones.
2. Equilibrium, Premium, and Discount Zones:
- Equilibrium is the midpoint between the swing high and low.
- Premium Zone is above the equilibrium, indicating a potential resistance area (sell zone).
- Discount Zone is below the equilibrium, indicating a potential support area (buy zone).
3. Simple Moving Average (SMA): It uses a 50-period SMA to determine the trend direction. If the price is above the SMA, the trend is bullish; if it's below, the trend is bearish.
4. Buy and Sell Signals:
- Buy Signal: Generated when the price is in the discount zone and above the equilibrium, with the price also above the SMA.
- Sell Signal: Triggered when the price is in the premium zone and below the equilibrium, with the price also below the SMA.
5. Order Blocks: It detects basic order blocks by identifying the highest high and lowest low within the last 20 bars. These levels help confirm the buy and sell signals.
6. Liquidity Zones: It marks the swing high and low as potential liquidity zones, indicating where price may reverse due to institutional players' activity.
The strategy then executes trades based on these signals, plotting buy and sell markers on the chart and showing the key levels (zones) and trend direction.

Advanced Multi-Seasonality StrategyThe Multi-Seasonality Strategy is a trading system based on seasonal market patterns. Seasonality refers to recurring market trends driven by predictable calendar-based events. These patterns emerge due to economic cycles, corporate activities (e.g., earnings reports), and investor behavior around specific times of the year. Studies have shown that such effects can influence asset prices over defined periods, leading to opportunities for traders who exploit these patterns (Hirshleifer, 2001; Bouman & Jacobsen, 2002).
How the Strategy Works:
The strategy allows the user to define four distinct periods within a calendar year. For each period, the trader selects:
Entry Date (Month and Day): The date to enter the trade.
Holding Period: The number of trading days to remain in the trade after the entry.
Trade Direction: Whether to take a long or short position during that period.
The system is designed with flexibility, enabling the user to activate or deactivate each of the four periods. The idea is to take advantage of seasonal patterns, such as buying during historically strong periods and selling during weaker ones. A well-known example is the "Sell in May and Go Away" phenomenon, which suggests that stock returns are higher from November to April and weaker from May to October (Bouman & Jacobsen, 2002).
Seasonality in Financial Markets:
Seasonal effects have been documented across different asset classes and markets:
Equities: Stock markets tend to exhibit higher returns during certain months, such as the "January effect," where prices rise after year-end tax-loss selling (Haugen & Lakonishok, 1987).
Commodities: Agricultural commodities often follow seasonal planting and harvesting cycles, which impact supply and demand patterns (Fama & French, 1987).
Forex: Currency pairs may show strength or weakness during specific quarters based on macroeconomic factors, such as fiscal year-end flows or central bank policy decisions.
Scientific Basis:
Research shows that market anomalies like seasonality are linked to behavioral biases and institutional practices. For example, investors may respond to tax incentives at the end of the year, and companies may engage in window dressing (Haugen & Lakonishok, 1987). Additionally, macroeconomic factors, such as monetary policy shifts and holiday trading volumes, can also contribute to predictable seasonal trends (Bouman & Jacobsen, 2002).
Risks of Seasonal Trading:
While the strategy seeks to exploit predictable patterns, there are inherent risks:
Market Changes: Seasonal effects observed in the past may weaken or disappear as market conditions evolve. Increased algorithmic trading, globalization, and policy changes can reduce the reliability of historical patterns (Lo, 2004).
Overfitting: One of the risks in seasonal trading is overfitting the strategy to historical data. A pattern that worked in the past may not necessarily work in the future, especially if it was based on random chance or external factors that no longer apply (Sullivan, Timmermann, & White, 1999).
Liquidity and Volatility: Trading during specific periods may expose the trader to low liquidity, especially around holidays or earnings seasons, leading to slippage and larger-than-expected price swings.
Economic and Geopolitical Shocks: External events such as pandemics, wars, or political instability can disrupt seasonal patterns, leading to unexpected market behavior.
Conclusion:
The Multi-Seasonality Strategy capitalizes on the predictable nature of certain calendar-based patterns in financial markets. By entering and exiting trades based on well-established seasonal effects, traders can potentially capture short-term profits. However, caution is necessary, as market dynamics can change, and seasonal patterns are not guaranteed to persist. Rigorous backtesting, combined with risk management practices, is essential to successfully implementing this strategy.
References:
Bouman, S., & Jacobsen, B. (2002). The Halloween Indicator, "Sell in May and Go Away": Another Puzzle. American Economic Review, 92(5), 1618-1635.
Fama, E. F., & French, K. R. (1987). Commodity Futures Prices: Some Evidence on Forecast Power, Premiums, and the Theory of Storage. Journal of Business, 60(1), 55-73.
Haugen, R. A., & Lakonishok, J. (1987). The Incredible January Effect: The Stock Market's Unsolved Mystery. Dow Jones-Irwin.
Hirshleifer, D. (2001). Investor Psychology and Asset Pricing. Journal of Finance, 56(4), 1533-1597.
Lo, A. W. (2004). The Adaptive Markets Hypothesis: Market Efficiency from an Evolutionary Perspective. Journal of Portfolio Management, 30(5), 15-29.
Sullivan, R., Timmermann, A., & White, H. (1999). Data-Snooping, Technical Trading Rule Performance, and the Bootstrap. Journal of Finance, 54(5), 1647-1691.
This strategy harnesses the power of seasonality but requires careful consideration of the risks and potential changes in market behavior over time.

Connors VIX Reversal III invented by Dave LandryThis strategy is based on trading signals derived from the behavior of the Volatility Index (VIX) relative to its 10-day moving average. The rules are split into buying and selling conditions:
Buy Conditions:
The VIX low must be above its 10-day moving average.
The VIX must close at least 10% above its 10-day moving average.
If both conditions are met, a buy signal is generated at the market's close.
Sell Conditions:
The VIX high must be below its 10-day moving average.
The VIX must close at least 10% below its 10-day moving average.
If both conditions are met, a sell signal is generated at the market's close.
Exit Conditions:
For long positions, the strategy exits when the VIX trades intraday below its previous day’s 10-day moving average.
For short positions, the strategy exits when the VIX trades intraday above its previous day’s 10-day moving average.
This strategy is primarily a mean-reversion strategy, where the market is expected to revert to a more normal state after the VIX exhibits extreme behavior (i.e., large deviations from its moving average).
About Dave Landry
Dave Landry is a well-known figure in the world of trading, particularly in technical analysis. He is an author, trader, and educator, best known for his work on swing trading strategies. Landry focuses on trend-following and momentum-based techniques, teaching traders how to capitalize on shorter-term price swings in the market. He has written books like "Dave Landry on Swing Trading" and "The Layman's Guide to Trading Stocks," which emphasize practical, actionable trading strategies.
About Connors Research
Connors Research is a financial research firm known for its quantitative research in financial markets. Founded by Larry Connors, the firm specializes in developing high-probability trading systems based on historical market behavior. Connors’ work is widely respected for its data-driven approach, including systems like the RSI(2) strategy, which focuses on short-term mean reversion. The firm also provides trading education and tools for institutional and retail traders alike, emphasizing strategies that can be backtested and quantified.
Risks of the Strategy
While this strategy may appear to offer promising opportunities to exploit extreme VIX movements, it carries several risks:
Market Volatility: The VIX itself is a measure of market volatility, meaning the strategy can be exposed to sudden and unpredictable market swings. This can result in whipsaws, where positions are opened and closed in rapid succession due to sharp reversals in the VIX.
Overfitting: Strategies based on specific conditions like the VIX closing 10% above or below its moving average can be subject to overfitting, meaning they work well in historical tests but may underperform in live markets. This is a common issue in quantitative trading systems that are not adaptable to changing market conditions .
Mean-Reversion Assumption: The core assumption behind this strategy is that markets will revert to their mean after extreme movements. However, during periods of sustained trends (e.g., market crashes or rallies), this assumption may break down, leading to prolonged drawdowns.
Liquidity and Slippage: Depending on the asset being traded (e.g., S&P 500 futures, ETFs), liquidity issues or slippage could occur when executing trades at market close, particularly in volatile conditions. This could increase costs or worsen trade execution.
Scientific Explanation of the Strategy
The VIX is often referred to as the "fear gauge" because it measures the market's expectations of volatility based on options prices. Research has shown that the VIX tends to spike during periods of market stress and revert to lower levels when conditions stabilize . Mean reversion strategies like this one assume that extreme VIX levels are unsustainable in the long run, which aligns with findings from academic literature on volatility and market behavior.
Studies have found that the VIX is inversely correlated with stock market returns, meaning that higher VIX levels often correspond to lower stock prices and vice versa . By using the VIX’s relationship with its 10-day moving average, this strategy aims to capture reversals in market sentiment. The 10% threshold is designed to identify moments when the VIX is significantly deviating from its norm, signaling a potential reversal.
However, academic research also highlights the limitations of relying on the VIX alone for trading signals. The VIX does not predict market direction, only volatility, meaning that it cannot indicate the magnitude of price movements . Furthermore, extreme VIX levels can persist longer than expected, particularly during financial crises.
In conclusion, while the strategy is grounded in well-established financial principles (e.g., mean reversion and the relationship between volatility and market performance), it carries inherent risks and should be used with caution. Backtesting and careful risk management are essential before applying this strategy in live markets.

TRIN (Arms Index) Trading StrategyThe TRIN (Arms Index), also known as the Short-Term Trading Index, is a technical indicator designed to gauge the internal strength or weakness of the market. It compares the number of advancing and declining stocks to the advancing and declining volume (AD Volume). A TRIN value above 1.0 generally indicates bearish market conditions, while a value below 1.0 suggests bullish market sentiment.
Strategy Rules:
Entry Condition (Long Position): When the TRIN value is above 1.0, the strategy enters a long position, indicating that the market may be oversold, and a potential reversal could occur.
Exit Condition: The strategy exits the long position when the closing price is higher than the previous day’s high, signaling a potential rebound in the market.
This strategy aims to capitalize on short-term market inefficiencies by entering trades during periods of potential market weakness and exiting when signs of recovery appear.
How the TRIN Index Works:
The TRIN is calculated as follows:
TRIN=Advancing Issues / Declining IssuesAdvancing Volume / Declining Volume
TRIN=Advancing Volume / Declining VolumeAdvancing Issues / Declining Issues
A TRIN value above 1.0 indicates that the market is potentially oversold (more declining stocks with higher volume), while a value below 1.0 suggests the market may be overbought (more advancing stocks with higher volume) .
Empirical Evidence:
Market Sentiment Indicator: The TRIN has been widely used as a sentiment indicator. Research by Zweig (1997) suggests that extreme TRIN values can serve as a contrarian signal, indicating potential turning points in the market. For instance, a TRIN above 2.0 is often considered a sign of panic selling, which can precede a market bottom .
Overbought/Oversold Conditions: Studies have shown that indicators like TRIN, which measure market breadth and volume, can be effective in identifying overbought and oversold conditions. According to Fama and French (1988), market sentiment indicators that consider both price and volume data can offer insights into future price movements .
Risks and Limitations:
False Signals:
One of the primary risks of using the TRIN-based strategy is the possibility of false signals. A TRIN value above 1.0 does not always guarantee a market rebound, especially in sustained bearish trends. In such cases, the strategy might enter long positions prematurely, leading to losses.
Research by Brock, Lakonishok, and LeBaron (1992) found that while market indicators like TRIN can be useful, they are not foolproof and can generate multiple false positives, particularly in volatile markets .
Market Regimes:
The effectiveness of the TRIN index can vary depending on the market regime. In strongly trending markets, either bullish or bearish, the TRIN may not provide reliable reversal signals, and relying on it could result in trades that go against the prevailing trend. For instance, during strong bear markets, the TRIN may frequently remain above 1.0, leading to multiple losing trades as the market continues to decline.
Short-Term Focus:
The TRIN strategy is inherently short-term focused, aiming to capture quick market reversals. This makes it sensitive to market noise and less effective for longer-term investors. Moreover, short-term trading strategies often require more frequent adjustments and can incur higher transaction costs, which may erode profitability over time.
Liquidity and Execution Risk:
Since the TRIN strategy requires entering and exiting trades based on short-term market movements, it is vulnerable to liquidity and execution risks. In fast-moving markets, the execution of trades may be delayed, leading to slippage and potentially unfavorable entry or exit points.
Conclusion:
The TRIN (Arms Index) Trading Strategy can be an effective tool for traders looking to capitalize on short-term market inefficiencies and potential reversals. However, it is important to recognize the risks associated with this strategy, including false signals, sensitivity to market regimes, and execution risks. Traders should employ proper risk management techniques and consider combining the TRIN with other indicators to improve the robustness of the strategy.
While the TRIN provides valuable insights into market sentiment, it is not a standalone solution and should be used in conjunction with a broader trading plan that takes into account both technical and fundamental analysis.
References:
Arms, Richard W. "Volume Adjusted Moving Averages." Technical Analysis of Stocks & Commodities, 1993.
Zweig, Martin. Winning on Wall Street. Warner Books, 1997.
Fama, Eugene F., and Kenneth R. French. "Permanent and Temporary Components of Stock Prices." Journal of Political Economy, 1988.
Brock, William, Josef Lakonishok, and Blake LeBaron. "Simple Technical Trading Rules and the Stochastic Properties of Stock Returns." Journal of Finance, 1992.

Universal Algo [Coff3eG]Universal Algo By G
Overview:
Universal Algo By G is a comprehensive LONG-ONLY trading strategy specifically designed for medium to long-term use in cryptocurrency markets, particularly Bitcoin. This algorithm can be manually adjusted to fit the volatility of specific coins, ensuring the best possible results. While it does not generate a large number of trades due to the nature of bull and bear market cycles, it has been rigorously backtested and forward-tested to ensure the strategy is not overfitted.
Core Features:
Integrated Systems: Universal Algo is built around five core systems, each contributing unique analytical perspectives to enhance trade signal reliability. These systems are designed to identify clear trend opportunities for significant gains while also employing logic to navigate through ranging markets effectively.
Optional Ranging Market Filter: Helps filter out noise, potentially enhancing signal clarity.
Market State Detection: Identifies four distinct market states:
Trending
Ranging
Danger (Possible top)
Possible Bottom
Global Liquidity Indicator (GLI) Integration: Leverages GLI values to identify positive liquidity trends.
Volatility Bands: Provides insights into market volatility.
Top and Bottom Detection: Shows possible bottoms with green backgrounds and red backgrounds for possible top detection.
The Market State Detection, GLI, Volatility Bands, and Top and Bottom Detection feature all serve as an expectation management feature.
Additional Features:
Optional Metrics Table: Displays strategy metrics and statistics, providing detailed insights into performance.
Customization Options: The script offers a range of user inputs, allowing for customization of the backtesting starting date, the decision to display the strategy equity curve, among other settings. These inputs cater to diverse trading needs and preferences, offering users control over their strategy implementation.
Operational Parameters:
Customizable Inputs: Users can adjust thresholds to match the coin's volatility, enhancing strategy performance.
Transparency and Logic Insight: While specific calculation details and proprietary indicators are integral to maintaining the uniqueness of Universal Algo, the strategy is grounded on well-established financial analysis techniques. These include momentum analysis, volatility assessments, and adaptive thresholding, among others, to formulate its trade signals. Notably, no single indicator is used in isolation; each indicator is combined with another to enhance signal accuracy and robustness. Some of the indicators include customized versions of the TEMA, Supertrend, Augmented Dickey-Fuller (ADF), and Weekly Positive Directional Movement Index (WPDM), all integrated together to create a cohesive and effective trading strategy.
System Operation:
Universal Algo works by taking the average score of the five core systems used for the signals. Three of these systems have been lengthened out to function as longer-term systems, while the remaining two operate at a slightly faster speed. This combination and averaging of systems help to balance the overall strategy, ensuring it maintains the right amount of speed to remain effective for medium to long-term use with minimal noise. The average score is then compared against customizable thresholds. The strategy will go long if the average score is above the threshold and short if it is below the threshold. This averaging mechanism helps to smooth out individual system anomalies and provides a more robust signal for trading decisions.
Originality and Usefulness:
Universal Algo is an original strategy that combines multiple proprietary and customized indicators to deliver robust trading signals. The strategy integrates various advanced indicators and methodologies, including:
System Indicator: Calculates a cumulative score based on recent price movements, aiding in trend detection.
Median For Loop: Utilizes percentile rank calculations of price data to gauge market direction.
Volatility Stop: A modified volatility-based stop-loss indicator that adjusts based on market conditions.
Supertrend: A customized supertrend indicator that uses percentile ranks and ATR for trend detection.
RSI and DEMA: Combines a modified RSI and DEMA for overbought/oversold conditions.
TEMA: Uses 3 different types of MA for trend detection and standard deviation bands for additional confirmation.
Detailed Explanation of Components and Their Interaction:
RSI (Relative Strength Index): Used to identify overbought and oversold conditions. In Universal Algo, RSI is combined with DEMA (Double Exponential Moving Average) to smooth the price data and provide clearer signals.
ATR (Average True Range): Used to measure market volatility. ATR is incorporated into the Volatility Stop and Supertrend indicators to adjust stop-loss levels and trend detection based on current market conditions.
DEMA (Double Exponential Moving Average): Provides a smoother price trend compared to traditional moving averages, reducing lag and making it easier to identify trend changes.
Modified TEMA (Triple Exponential Moving Average): Similar to DEMA but provides even greater smoothing, reducing lag further and enhancing trend detection accuracy.
Volatility Stop: Utilizes ATR to dynamically set stop-loss levels that adapt to changing market volatility. This helps in protecting profits and minimizing losses.
Customized Supertrend: Uses ATR and percentile ranks to determine trend direction and strength. This indicator helps in capturing major trends while filtering out market noise.
Median For Loop: Calculates percentile ranks of price data over a specified period to assess market direction. This helps in identifying potential reversals and trend continuations.
HMA (Hull Moving Average): A fast-acting moving average that reduces lag while maintaining smoothness. It helps in quickly identifying trend changes.
SMA (Simple Moving Average): A traditional moving average that provides baseline trend information. Combined with HMA and other indicators, it forms a comprehensive trend detection system.
Universal Algo offers a sophisticated blend of advanced indicators and proprietary logic that is not available in free or open-source scripts. Here are some reasons why it is worth paying for:
Customization and Flexibility: The strategy provides a high degree of customization, allowing users to adjust various parameters to suit their trading style and market conditions. This flexibility is often not available in free scripts.
Proprietary Indicators: The use of proprietary and customized indicators such as the TEMA, Supertrend, ADF, and WPDM ensures that the strategy is unique and not replicable by free or open-source scripts.
Integrated Systems: The strategy combines multiple systems and indicators to provide a more comprehensive and reliable trading signal. This integration helps to smooth out anomalies and reduces noise, providing clearer trading opportunities.
Rigorous Testing: Universal Algo has undergone extensive backtesting and forward-testing to ensure its robustness and reliability. The results demonstrate its ability to perform well under various market conditions, offering users confidence in its effectiveness.
Detailed Metrics and Analysis: The optional metrics table provides users with detailed insights into the strategy's performance, including metrics like equity, drawdown, Sharpe ratio, and more. This level of detail helps traders make informed decisions.
Value Addition: By providing a strategy that combines advanced indicators, customization options, and thorough testing, Universal Algo adds significant value to traders looking for a reliable and adaptable trading tool.
Realistic Trading Conditions:
Backtesting and Forward-Testing: Rigorous testing ensures performance and reliability, with a focus on prudent risk management. Default properties include an initial capital of $1000, 0 pyramiding, 20 slippage, 0.05% commission, and using 5% of equity for trades.
The strategy is designed and tested with a focus on achieving a balance between risk and reward, striving for robustness and reliability rather than unrealistic profitability promises. Realistic trading conditions are considered, including appropriate account size, commission, slippage, and sustainable risk levels per trade.
Concluding Thoughts:
Universal Algo By G is offered to the TradingView community as a robust tool for enhancing market analysis and trading strategies. It is designed with a commitment to quality, innovation, and adaptability, aiming to provide valuable insights and decision support across various market conditions. Potential users are encouraged to evaluate Universal Algo within the context of their overall trading approach and objectives.

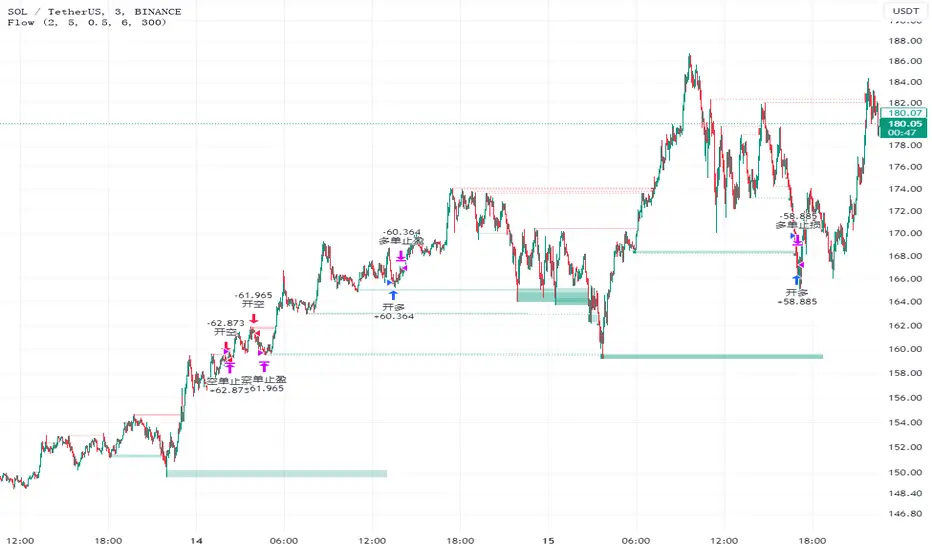
FlowHello, everyone,
Recently I found a useful indicator for the short-term minute-level trading called Liquidity Sweeps. This is a technical indicator that studies the resistance and support levels of candle patterns.
The strategy takes into account the following market factors:
Lql -> resistance formed by a rapid rise or support formed by a rapid rise
Sweep Area -> potential entry point
The inspiration of this strategy comes mostly from Liquidity Sweeps (LuxAlgo), but I have also optimized it based on my own trading experience.
What are the differences from the original strategy?
The Only Outbreaks & Retest option has been removed, and the formation of Wicks is enough to prevent conflicting signals.
The P&L ratio of the strategy has been set, which allows more combinations of the appropriate strategy parameters to match different characteristics of trading pairs.
Signals
1. Enter the trade when three consecutive bars are formed in the Wicks block (resistance or support) and set the stop-loss/stop-profit
2. The condition is not met when three bars are formed in the Wicks block, and the Wicks index is reset when the price returns.
Risk Management
1. Use the P&L ratio, plus appropriate ATR volatility to prevent false breakouts.
2. When the signal is reversed.
3. The strategy is suitable for the short-term level, not for the trend market.
Now, for the inexperienced reader, a series of knowledge. ATR: Like Boolean channel and ADX, Average True Rage is an indicator used to measure price volatility. But unlike these two indicators, it can reflect the price volatility more accurately because of the factors such as gaps added in its calculation process. For this reason, it is called "true" volatility.
Sincerely,
Special thanks to @LuxAlgo for sharing.
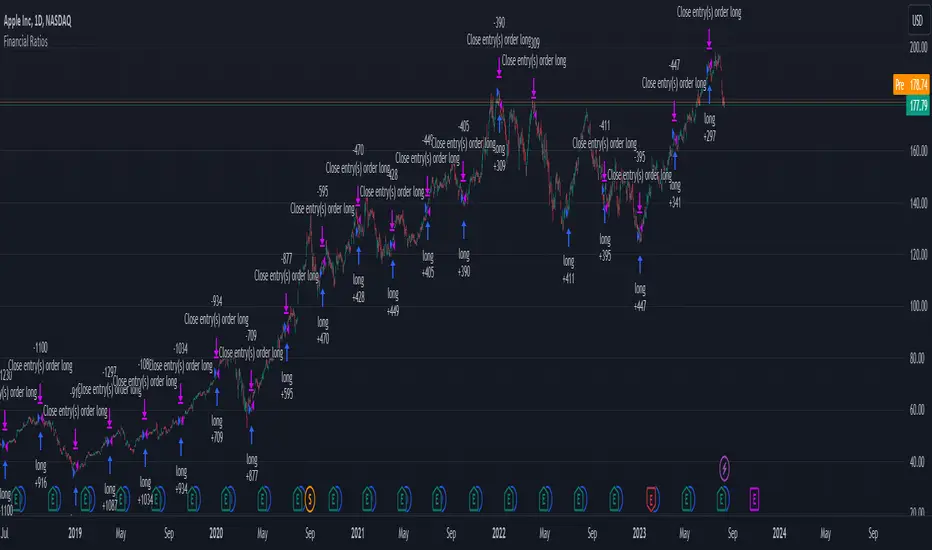
Financial Ratios Fundamental StrategyWhat are financial ratios?
Financial ratios are basic calculations using quantitative data from a company’s financial statements. They are used to get insights and important information on the company’s performance, profitability, and financial health.
Common financial ratios come from a company’s balance sheet, income statement, and cash flow statement.
Businesses use financial ratios to determine liquidity, debt concentration, growth, profitability, and market value.
The common financial ratios every business should track are
1) liquidity ratios
2) leverage ratios
3)efficiency ratio
4) profitability ratios
5) market value ratios.
Initially I had a big list of 20 different ratios for testing, but in the end I decided to stick for the strategy with these ones :
Current ratio: Current Assets / Current Liabilities
The current ratio measures how a business’s current assets, such as cash, cash equivalents, accounts receivable, and inventories, are used to settle current liabilities such as accounts payable.
Interest coverage ratio: EBIT / Interest expenses
Companies generally pay interest on corporate debt. The interest coverage ratio shows if a company’s revenue after operating expenses can cover interest liabilities.
Payables turnover ratio: Cost of Goods sold (or net credit purchases) / Average Accounts Payable
The payables turnover ratio calculates how quickly a business pays its suppliers and creditors.
Gross margin: Gross profit / Net sales
The gross margin ratio measures how much profit a business makes after the cost of goods and services compared to net sales.
With this data, I have created the long and long exit strategy:
For long, if any of the 4 listed ratios,such as current ratio or interest coverage ratio or payable turn ratio or gross margin ratio is ascending after a quarter, its a potential long entry.
For example in january the gross margin ratio is at 10% and in april is at 15%, this is an increase from a quarter to another, so it will get a long entry trigger.
The same could happen if any of the 4 listed ratios follow the ascending condition since they are all treated equally as important
For exit, if any of the 4 listed ratios are descending after a quarter, such as current ratio or interest coverage ratio or payable turn ratio or gross margin ratio is descending after a quarter, its a potential long exit.
For example in april we entered a long trade, and in july data from gross margin comes as 12% .
In this case it fell down from 15% to 12%, triggering an exit for our trade.
However there is a special case with this strategy, in order to make it more re active and make use of the compound effect:
So lets say on july 1 when the data came in, the gross margin data came descending (indicating an exit for the long trade), however at the same the interest coverage ratio came as positive, or any of the other 3 left ratios left . In that case the next day after the trade closed, it will enter a new long position and wait again until a new quarter data for the financial is being published.
Regarding the guidelines of tradingview, they recommend to have more than 100 trades.
With this type of strategy, using Daily timeframe and data from financials coming each quarter(4 times a year), we only have the financial data available since 2016, so that makes 28 quarters of data, making a maximum potential of 28 trades.
This can however be "bypassed" to check the integrity of the strategy and its edge, by taking for example multiple stocks and test them in a row, for example, appl, msft, goog, brk and so on, and you can see the correlation between them all.
At the same time I have to say that this strategy is more as an educational one since it miss a risk management and other additional filters to make it more adapted for real live trading, and instead serves as a guiding tool for those that want to make use of fundamentals in their trades
If you have any questions, please let me know !
Premium VWAP Trendfollow Strategy [wbburgin]This is a strongly-revised version of my VWAP Trendfollow Strategy, which follows a substantial reworking to address various structural inefficiencies with the script, such as the narrowing of the standard deviation band upon anchor reset. I will continue updating the original script with planned adjustments, this is a different proof-of-concept that builds off of the original script thesis with a different calculation method and execution.
This strategy is not built for any specific asset or timeframe, and has been backtested on crypto and equities from 1 min-1 day. The previous experimental strategy was heavily-correlated with the actual movement of the asset, which added unpalatable risk to the strategy and increased drawdown. This revised form has a more stable backtesting curve, but I want to heavily emphasize that I cannot guarantee that the strategy will be profitable for your circumstances. Backtesting only goes so far and every exchange has a different fee schedule, which can substantially eat into your profits. At the bottom I will explain the parameters behind the strategy results.
**********
The VWAP Trendfollow Strategy begins with a simple premise: to enter long when the price breaks above the upper standard deviation of a VWAP, and to close the position when the price breaks below the lower standard deviation of the VWAP. This is more effective than initiating the same strategy for a VWMA because the VWAP resets its anchor depending on your chosen anchor period, and the act of resetting its anchor also resets its standard deviation value. As a consequence, in sustained uptrends, the standard deviation is pulled upward to meet the price when the anchor resets, instead of requiring the price to fall all the way back down, as in the lower standard deviation band of the VWMA. This essentially acts as the VWAP itself raising the stop loss at each anchor period, which works well for the overall trend-following strategy.
However, this narrowing can still have consequences for a simple breakout strategy; as the price gradually oscillates towards above or below its standard deviation band, it may cross over the other and produce false signals. This oscillation is worrisome especially when fees are taken into account.
Thus, the premium VWAP Trendfollow strategy has a variable width which detects abnormal narrowing of the band, and adjusts it until it is reasonable to close the variability period. Additionally, a filter is added to the open/close signals to soften the frequency of signals without impacting performance significantly.
This script contains an ATR stop loss and an ATR take profit (which is also a difference between it and the original experimental script), with customizable inputs. The strategy results shown below are with initial capital of $1000, qty entry of 10%, and commissions of 0.06%. It works best on 24/7 instruments, like crypto, but I have found it also works with FAANG stocks or other high volatility / high volume assets. The issue with stocks, however, is that the price can jump/plummet because of abnormal events after-hours, which the strategy cannot pick up on until pre-trading begins the next morning. For that reason I suggest it be used on crypto and, because of its low % profitable (but high average winning trade in relation to its average losing trade), be used on an exchange that has minimal fees or volume-based discounts. In the unfortunate case that you cannot find a minimal fee or volume-discounted fee exchange (such as fellow Americans following the liquidity-retreat on Binance.US), I encourage you to test out the higher anchor periods for the higher timeframes, which will reduce the number of trades and increase the average % per trade.
Additionally, this is a long-term strategy used best for accumulation. It is currently long-only; that may change based off of user input.
**********
Disclaimer
Copyright by wbburgin.
The information contained in my Scripts/Indicators/Algorithms does not constitute financial advice or a solicitation to buy or sell any securities of any type. I will not accept liability for any loss or damage, including without limitation any loss of profit, which may arise directly or indirectly from the use of or reliance on such information.
All investments involve risk, and the past performance of a security, industry, sector, market, financial product, trading strategy, backtest, or individual's trading does not guarantee future results or returns. Investors are fully responsible for any investment decisions they make. Such decisions should be based solely on an evaluation of their financial circumstances, investment objectives, risk tolerance, and liquidity needs.

ALLinBull&Bear v9.0 STRATEGYEach of my Allin Custom Indicators combined, ads to your understanding where the Market could go next. Each of them have their own purpose and set of rules.
You will weight gathered information to get a better understanding of when to ENTER or EXIT a position (SHORT or LONG).
First you need to find the right Indicator Settings and the best preforming TimeFrame for chosen crypto or fiat pair. You will do that with a "STRATEGY" Indicator. I chose either 3min TF for highly liquid assets or 15min TF for assets of low liquidity but you can choose whatever you want to up to 30min TF.
Do not stop until you find 80% or more Precent Profitable result (test different setting on different TF for best results) in Strategy Tester. You can backtest your Strategy with different settings and in different TimeFames to find the very best results for that pair.
BACKTESTING past results does not guarantee your future results. BACKTESTING is used to fine-tune your indicator.
Example: with a guitar tuner (Strategy Tester in our case) you fine-tune your guitar (our Indicators in our case) so you know what tone the guitar will produce when you hit a certain note ("in-tuned" visual interpretation of the Market in our case). It is normal to get a 100% Precent Profitable result from backtesting with very little Drawdown. More than 80% and low drawdown usually means Indicators is "in-tune".
CUSTOM INDICATOR TYPE: STRATEGY
SETUP
There are five different settings. To use them efficiently you need to understand what is their purpose and meaning.
"2nd", "3rd" and "4th" FIELD
All of my custom indicators use data from 4 different TimeFrames. First TimeFrame is the one you picked in TradingView. Now you need to set up the other three TimeFrames. To do that you need to click on the "Settings" icon on this indicator and change the "2nd", "3rd" and "4th" field. The preferred setting I use to start searching for the best performing set of Settings is 2-8-32 OR 3-9-27 OR 4-16-64 OR 5-20-80. Those numbers are multiplication of chosen TimeFrame.
Example: setting 2-8-32 on a 5-minute TimeFrame means it will gather data from 5min TF, 10min TF (5minX2), 40min TF (5minX8) and 160min TF (5minX32).
Smoother FIELD
This Field is used to average down all that data indicator it is gathering from the price chart. I use integers like for example 9, 18, 27, and any number in between. It is connected to volatility. High Volatility needs Low Number and vice versa.
Threshold FIELD
This Field is used to cancel down all the mini signal confirmations that are false due to an insignificant influence on future price movements. This number is usually best at 21. When you set all other Fields and get satisfying results you can still try and fine-tune it even more and get even better results.
HOW TO USE IT
First, you have to choose your TimeFrame. I choose either 3min TF for highly liquid assets and 15min TF for assets of low liquidity but you can choose whatever you want to up to 30min TF. Example: if you chose 30min TimeFrame and you fill the "4th" Field with the number "80", one of observed TF by the indicator will be "30minX80" or "2400min" or "40h" TimeFrame, so it is HUGE.
It always depends based on the nature of the actual pair you are looking at. If it is very volatile with a lot of volume, the market beat for this pair settings is very different from another pair with for example very little volume and low volatility. So you need to find the right Indicator Settings at the right TimeFrame for each pair you are following. You are basically tuning your Indicator like you would tune your guitar so you know what to expect before hitting those "strings" of yours.
Find the best performing setting and TimeFrame with help from a TradingView feature called "Strategy Tester". Get familiar with this feature. But rule of thumb is: everything more than 80% Precent Profitable result with Max Drawdown (negative yield from the worst closed position) lower or similar to AvgTrade is considered good enough tuning of my Indicators.
You need to reevaluate your best setting whenever your last trade gets a negative result or something big (whale manipulation) happens on the market. You need to re-tune your Indicator so it will be in tune with the Market again. Check and try to find better performing (better Precent Profitable result, lower Drawdown) settings periodically every few days to find your best yielding results.
CUSTOM INDICATOR: BULL&BEAR
HOW TO READ IT
WHITE WAVY LINE AND TWO HORIZONTAL WHITE LINES
With this one just follow the existing rules when exiting an oversold or overbought area as in RSI,CCI or SRSI indicator. When combining with the signal colored lines in the background it then makes better sense if it is a false signal and it will turn back or it is the right signal and it will exit the oversold or overbought area and advance in that direction.
IN THE BACKGROUND: NINE COLORED LINES
Rule of thumb here is the more GREEN LINES you see the more LONG/BUY the Signal is and vice versa. It helps to look at those lines a few hours back to get the "feel" where the market is pushing the price. First (1), second (2) and seventh (7) line are the most important lines and they have to be aligned and prevailed in the same color to get a viable signal but it still needs to be confirmed with other Signals.
Before making any decisions based on visualisation you should refresh the page. Indicator is very data sensitive and needs that very last data for the most accurate visual representation of the Market.

ALLinOscillator v3.0 STRATEGYEach of my Allin Custom Indicators combined, ads to your understanding where the Market could go next. Each of them have their own purpose and set of rules.
You will weight gathered information to get a better understanding of when to ENTER or EXIT a position (SHORT or LONG).
First you need to find the right Indicator Settings and the best preforming TimeFrame for chosen crypto or fiat pair. You will do that with a "STRATEGY" Indicator. I chose either 3min TF for highly liquid assets or 15min TF for assets of low liquidity but you can choose whatever you want to up to 30min TF.
Do not stop until you find 80% or more Precent Profitable result (test different setting on different TF for best results) in Strategy Tester. You can backtest your Strategy with different settings and in different TimeFames to find the very best results for that pair.
BACKTESTING past results does not guarantee your future results. BACKTESTING is used to fine-tune your indicator.
Example: with a guitar tuner (Strategy Tester in our case) you fine-tune your guitar (our Indicators in our case) so you know what tone the guitar will produce when you hit a certain note ("in-tuned" visual interpretation of the Market in our case). It is normal to get a 100% Precent Profitable result from backtesting with very little Drawdown. More than 80% and low drawdown usually means Indicators is "in-tune".
CUSTOM INDICATOR TYPE: STRATEGY
SETUP
There are five different settings. To use them efficiently you need to understand what is their purpose and meaning.
"2nd", "3rd" and "4th" FIELD
All of my custom indicators use data from 4 different TimeFrames. First TimeFrame is the one you picked in TradingView. Now you need to set up the other three TimeFrames. To do that you need to click on the "Settings" icon on this indicator and change the "2nd", "3rd" and "4th" field. The preferred setting I use to start searching for the best performing set of Settings is 2-8-32 OR 3-9-27 OR 4-16-64 OR 5-20-80. Those numbers are multiplication of chosen TimeFrame.
Example: setting 2-8-32 on a 5-minute TimeFrame means it will gather data from 5min TF, 10min TF (5minX2), 40min TF (5minX8) and 160min TF (5minX32).
Smoother FIELD
This Field is used to average down all that data indicator it is gathering from the price chart. I use integers like for example 9, 18, 27, and any number in between. It is connected to volatility. High Volatility needs Low Number and vice versa.
Threshold FIELD
This Field is used to cancel down all the mini signal confirmations that are false due to an insignificant influence on future price movements. This number is usually best at 21. When you set all other Fields and get satisfying results you can still try and fine-tune it even more and get even better results.
HOW TO USE IT
First, you have to choose your TimeFrame. I choose either 3min TF for highly liquid assets and 15min TF for assets of low liquidity but you can choose whatever you want to up to 30min TF. Example: if you chose 30min TimeFrame and you fill the "4th" Field with the number "80", one of observed TF by the indicator will be "30minX80" or "2400min" or "40h" TimeFrame, so it is HUGE.
It always depends based on the nature of the actual pair you are looking at. If it is very volatile with a lot of volume, the market beat for this pair settings is very different from another pair with for example very little volume and low volatility. So you need to find the right Indicator Settings at the right TimeFrame for each pair you are following. You are basically tuning your Indicator like you would tune your guitar so you know what to expect before hitting those "strings" of yours.
Find the best performing setting and TimeFrame with help from a TradingView feature called "Strategy Tester". Get familiar with this feature. But rule of thumb is: everything more than 80% Precent Profitable result with Max Drawdown (negative yield from the worst closed position) lower or similar to AvgTrade is considered good enough tuning of my Indicators.
You need to reevaluate your best setting whenever your last trade gets a negative result or something big (whale manipulation) happens on the market. You need to re-tune your Indicator so it will be in tune with the Market again. Check and try to find better performing (better Precent Profitable result, lower Drawdown) settings periodically every few days to find your best yielding results.
CUSTOM INDICATOR: OSCILLATOR
HOW TO READ IT
GREEN AREA on the bottom and RED AREA on top are just like the oversold or overbought areas in RSI, CCI or SRSI and uses the same principle.
Example: when a WHITE wave line crosses-UP WHITE horizontal line in GREEN area it means that it is a LONG/BUY signal/confirmation. It needs to be confirmed with other confirmation signals in that same Indicator on in a "BULL&BEAR" Indicator to get better understanding that the price would not turn back down due to a false price move in UPWARDS direction.
GREEN or RED OSCILLATOR WAVE AREAS indicates the direction price is going and how strong the "force" behind the price move is.
Example: if WHITE LINE is over the RED/GREEN LINE the area turns GREEN and it is a LONG/BUY signal. When a shadow color is on the OTHER SIDE that means it is an added confirmation for a LONG/BUY position. When a SHADOW AREA is over the GREEN AREA and turns RED it usually means there are still forces pulling the price down.
Before making any decisions based on visualisation you should refresh the page. Indicator is very data sensitive and needs that very last data for the most accurate visual representation of the Market.

Crypto LONG PYThis trading approach is a powerful combination of technical tools aimed at taking advantage of market fluctuations with precision and reliability. By integrating Bollinger Bands (BB), the Relative Strength Index (RSI), Exponential Moving Averages (EMA), and Fibonacci retracement levels (Fib), we create a strategy that captures key market moves and helps identify optimal entry and exit points, all within the context of the New York market conditions (NY).
Bollinger Bands provide insight into market volatility, offering signals about potential extreme price movements. The RSI is used to measure momentum and assess overbought or oversold conditions, indicating when the market might be nearing a reversal. Meanwhile, EMAs add a layer of smoothing, allowing us to observe short- and medium-term trends, helping filter out false signals and providing a clearer view of the overall market direction.
Additionally, Fibonacci retracements are integrated to identify key support and resistance levels, pinpointing potential areas of price retracement and continuation. When combined, these indicators offer a holistic approach to navigating the markets, enabling traders to make data-driven, informed decisions.
This approach is ideal for traders looking for a meticulous methodology for trading during the NY session, where liquidity and volatility tend to be at their highest. Leverage the synergy between these indicators to optimize your trading strategy and maximize your market performance.

[SM-021] Gaussian Trend System [Optimized]This script is a comprehensive trend-following strategy centered around a Gaussian Channel. It is designed to capture significant market movements while filtering out noise during consolidation phases. This version (v2) introduces code optimizations using Pine Script v6 Arrays and a new Intraday Time Control feature.
1. Core Methodology & Math
The foundation of this strategy is the Gaussian Filter, originally conceptualized by @DonovanWall.
Gaussian Poles: Unlike standard moving averages (SMA/EMA), this filter uses "poles" (referencing signal processing logic) to reduce lag while maintaining smoothness.
Array Optimization: In this specific iteration, the f_pole function has been refactored to utilize Pine Script Arrays. This improves calculation efficiency and rendering speed compared to recursive variable calls, especially when calculating deep historical data.
Channel Logic: The strategy calculates a "Filtered True Range" to create High and Low bands around the main Gaussian line.
Long Entry: Price closes above the High Band.
Short Entry: Price closes below the Low Band.
2. Signal Filtering (Confluence)
To reduce false signals common in trend-following systems, the strategy employs a "confluence" approach using three additional layers:
Baseline Filter: A 200-period (customizable) EMA or SMA acts as a regime filter. Longs are only taken above the baseline; Shorts only below.
ADX Filter (Volatility): The Average Directional Index (ADX) is used to measure trend strength. If the ADX is below a user-defined threshold (default: 20), the market is considered "choppy," and new entries are blocked.
Momentum Check: A Stochastic RSI check ensures that momentum aligns with the breakout direction.
3. NEW: Intraday Session Filter
Per user requests, a time-based filter has been added to restrict trading activity to specific market sessions (e.g., the New York Open).
How it works: Users can toggle a checkbox to enable/disable the filter.
Configuration: You can define a specific time range (Default: 09:30 - 16:00) and a specific Timezone (Default: New York).
Logic: The strategy longCondition and shortCondition now check if the current bar's timestamp falls within this window. If outside the window, no new entries are generated, though existing trades are managed normally.
4. Risk Management
The strategy relies on volatility-based exits rather than fixed percentage stops:
ATR Stop Loss: A multiple of the Average True Range (ATR) is calculated at the moment of entry to set a dynamic Stop Loss.
ATR Take Profit: An optional Reward-to-Risk (RR) ratio can be set to place a Take Profit target relative to the Stop Loss distance.
Band Exit: If the trend reverses and price crosses the opposite band, the trade is closed immediately to prevent large drawdowns.
Credits & Attribution
Original Gaussian Logic: Developed by @DonovanWalll. This script utilizes his mathematical formula for the pole filters.
Strategy Wrapper & Array Refactor: Developed by @sebamarghella.
Community Request: The Intraday Session Filter was added to assist traders focusing on specific liquidity windows.
Disclaimer: This strategy is for educational purposes. Past performance is not indicative of future results. Please use the settings menu to adjust the Session Time and Risk parameters to fit your specific asset class.

Customer Short strategy A5.1 + Session + CBL SLFor my customer.
HalfTrend Directional Framework (A5.1)
Used for primary trend recognition and breakout validation.
Session-Based Volatility Windows
Trades only occur within specific high-liquidity windows (e.g., 08:30–12:30 and 12:30–16:30), improving fill quality and reducing noise.
Three-Bar Opening Range Model
The first three 5-minute bars define:
session high
session low
These become structural breakout levels:
price > range high → long-bias
price < range low → short-bias
CBL (Guppy Count-Back Line) Stop-Loss
Instead of using ATR or static percentage stops, Libra_S relies on CBL to:
avoid premature exits during healthy pullbacks
capture trend persistence
provide structure-based invalidation

King StrategyKing Strategy is an all-in-one TradingView edge for scalpers, swing traders and prop- or hedge-fund pros alike. It blends classic pattern flags with institutional-grade filters to pinpoint high-probability long entries and exits—and displays them with instant visual cues (buy/sell flags, dynamic backgrounds, trend-lines, support/resistance and volume-zones).
Built-in time-of-day and cycle locks help tame overtrading, and every signal lives in a single Inputs panel so you can toggle filters, tweak risk parameters and dial in exits in seconds. Whether you’re chasing 1-minute scalps or planning multi-day swings, S85 keeps you in sync with the market—just fine-tune its tools to match your timeframe, liquidity and comfort with risk.

Trend Following $ZEC - Multi-Timeframe Structure Filter + Revers# Trend Following CRYPTOCAP:ZEC - Strategy Guide
## 📊 Strategy Overview
Trend Following CRYPTOCAP:ZEC is an enhanced Turtle Trading system designed for cryptocurrency spot trading, combining Donchian Channel breakouts, multi-timeframe structure filtering, and ATR-based dynamic risk management for both long and short positions.
---
## 🎯 Core Features
1. Multi-Timeframe Structure Filtering
- Uses Swing High/Low to identify market structure
- Customizable structure timeframe (default: 1 minute)
- Only enters trades in the direction of the trend, avoiding counter-trend positions
2. Reverse Signal Exit
- No fixed stop-loss or fixed-period exits
- Exits only when a reverse entry signal triggers
- Maximizes trend profits, reduces premature exits
3. ATR Dynamic Pyramiding
- Adds positions when price moves 0.5 ATR in favorable direction
- Supports up to 2 units maximum (adjustable)
- Pyramid scaling to enhance profitability
4. Complete Risk Management
- Fixed position size (5000 USD per unit)
- Commission fee 0.06% (Binance spot rate)
- Initial capital 10,000 USD
---
## 📈 Trading Logic
Entry Conditions
✅ Long Entry:
- Close price breaks above 20-period high
- Structure trend is bullish (price breaks above Swing High)
✅ Short Entry:
- Close price breaks below 20-period low
- Structure trend is bearish (price breaks below Swing Low)
Add Position Conditions
- Long: Price rises ≥ 0.5 ATR
- Short: Price falls ≥ 0.5 ATR
- Maximum 2 units including initial entry
Exit Conditions
- Long Exit: When short entry signal triggers (price breaks 20-period low + structure turns bearish)
- Short Exit: When long entry signal triggers (price breaks 20-period high + structure turns bullish)
---
## ⚙️ Parameter Settings
Channel Settings
- Entry Channel Period: 20 (Donchian Channel breakout period)
- Exit Channel Period: 10 (reserved parameter, actually uses reverse signal exit)
ATR Settings
- ATR Period: 20
- Stop Loss ATR Multiplier: 2.0 (reserved parameter)
- Add Position ATR Multiplier: 0.5
Structure Filter
- Swing Length: 160 (Swing High/Low calculation period)
- Structure Timeframe: 1 minute (can change to 5/15/60, etc.)
Position Management
- Maximum Units: 2 (including initial entry)
- Capital Per Unit: 5000 USD
---
## 🎨 Visualization Features
Background Colors
- Light Green: Bullish structure
- Light Red: Bearish structure
- Dark Green: Long entry
- Dark Red: Short entry
Optional Display (Default: OFF)
- Entry/exit channel lines
- Structure high/low lines
- ATR stop-loss line
- Next add position indicator
- Entry/exit labels
---
## 📱 Alert Message Format
Strategy sends notifications on entry/exit with the following format:
- Entry: `1m Long EP:428.26`
- Add Position: `15m Add Long 2/2 EP:429.50`
- Exit: `1m Close Long Reverse Signal`
Where:
- `1m`/`15m` = Current chart timeframe
- `EP` = Entry Price
---
## 💰 Backtest Settings
Capital Allocation
- Initial Capital: 10,000 USD
- Per Entry: 5,000 USD (split into 2 entries)
- Leverage: 0x (spot trading)
Trading Costs
- Commission: 0.06% (Binance spot VIP0)
- Slippage: 0
---
## 🎯 Use Cases
✅ Best Scenarios
- Trending markets
- Moderate volatility assets
- 1-minute to 4-hour timeframes
⚠️ Not Suitable For
- Highly volatile choppy markets
- Low liquidity small-cap coins
- Extreme market conditions (black swan events)
---
## 📊 Usage Recommendations
Timeframe Suggestions
| Timeframe | Trading Style | Suggested Parameter Adjustment |
|-----------|--------------|-------------------------------|
| 1-5 min | Scalping | Swing Length 100-160 |
| 15-30 min | Short-term | Swing Length 50-100 |
| 1-4 hour | Swing Trading | Swing Length 20-50 |
Optimization Tips
1. Adjust swing length based on backtest results
2. Different coins may require different parameters
3. Recommend backtesting on 1-minute chart first before live trading
4. Enable labels to observe entry/exit points
---
## ⚠️ Risk Disclaimer
1. Past Performance Does Not Guarantee Future Results
- Backtest data is for reference only
- Live trading may be affected by slippage, delays, etc.
2. Market Condition Changes
- Strategy performs better in trending markets
- May experience frequent stops in ranging markets
3. Capital Management
- Do not invest more than you can afford to lose
- Recommend setting total capital stop-loss threshold
4. Commission Impact
- Frequent trading accumulates commission fees
- Recommend using exchange discounts (BNB fee reduction, etc.)
---
## 🔧 Troubleshooting
Q: No entry signals?
A: Check if structure filter is too strict, adjust swing length or timeframe
Q: Too many labels displayed?
A: Turn off "Show Labels" option in settings
Q: Poor backtest performance?
A:
1. Check if the coin is suitable for trend-following strategies
2. Adjust parameters (swing length, channel period)
3. Try different timeframes
Q: How to set alerts?
A:
1. Click "Alert" in top-right corner of chart
2. Condition: Select "Strategy - Trend Following CRYPTOCAP:ZEC "
3. Choose "Order filled"
4. Set notification method (Webhook/Email/App)
---
## 📞 Contact Information
Strategy Name: Trend Following CRYPTOCAP:ZEC
Version: v1.0
Pine Script Version: v6
Last Updated: December 2025
---
## 📄 Copyright Notice
This strategy is for educational and research purposes only.
All risks of using this strategy for live trading are borne by the user.
Commercial use without authorization is prohibited.
---
## 🎓 Learning Resources
To understand the strategy principles in depth, recommended reading:
- "The Complete TurtleTrader" - Curtis Faith
- "Trend Following" - Michael Covel
- TradingView Pine Script Official Documentation
---
Happy Trading! Remember to manage your risk 📈

Mutanabby_AI | ONEUSDT_MR1
ONEUSDT Mean-Reversion Strategy | 74.68% Win Rate | 417% Net Profit
This is a long-only mean-reversion strategy designed specifically for ONEUSDT on the 1-hour timeframe. The core logic identifies oversold conditions following sharp declines and enters positions when selling pressure exhausts, capturing the subsequent recovery bounce.
Backtested Period: June 2019 – December 2025 (~6 years)
Performance Summary
| Metric | Value |
|--------|-------|
| Net Profit | +417.68% |
| Win Rate | 74.68% |
| Profit Factor | 4.019 |
| Total Trades | 237 |
| Sharpe Ratio | 0.364 |
| Sortino Ratio | 1.917 |
| Max Drawdown | 51.08% |
| Avg Win | +3.14% |
| Avg Loss | -2.30% |
| Buy & Hold Return | -80.44% |
Strategy Logic :
Entry Conditions (Long Only):
The strategy seeks confluence of three conditions that identify exhausted selling:
1. Prior Move Filter:*The price change from 5 bars ago to 3 bars ago must be ≥ -7% (ensures we're not entering during freefall)
2. Current Move Filter: The price change over the last 2 bars must be ≤ 0% (confirms momentum is stalling or reversing)
3. Three-Bar Decline: The price change from 5 bars ago to 3 bars ago must be ≤ -5% (confirms a significant recent drop occurred)
When all three conditions align, the strategy identifies a potential reversal point where sellers are exhausted.
Exit Conditions:
- Primary Exit: Close above the previous bar's high while the open of the previous bar is at or below the close from 9 bars ago (profit-taking on strength)
- Trailing Stop: 11x ATR trailing stop that locks in profits as price rises
Risk Management
- Position Sizing:Fixed position based on account equity divided by entry price
- Trailing Stop:11× ATR (14-period) provides wide enough room for crypto volatility while protecting gains
- Pyramiding:Up to 4 orders allowed (can scale into winning positions)
- **Commission:** 0.1% per trade (realistic exchange fees included)
Important Disclaimers
⚠️ This is NOT financial advice.
- Past performance does not guarantee future results
- Backtest results may contain look-ahead bias or curve-fitting
- Real trading involves slippage, liquidity issues, and execution delays
- This strategy is optimized for ONEUSDT specifically — results may differ on other pairs
- Always test before risking real capital
Recommended Usage
- Timeframe:*1H (as designed)
- Pair: ONEUSDT (Binance)
- Account Size: Ensure sufficient capital to survive max drawdown
Source Code
Feedback Welcome
I'm sharing this strategy freely for educational purposes. Please:
- Drop a comment with your backtesting results any you analysis
- Share any modifications that improve performance
- Let me know if you spot any issues in the logic
Happy trading
As a quant trader, do you think this strategy will survive in live trading?
Yes or No? And why?
I want to hear from you guys

ChronoPulse MS-MACD Resonance StrategyChronoPulse MS-MACD Resonance Strategy
A systematic trading strategy that combines higher-timeframe market structure analysis with dual MACD momentum confirmation, ATR-based risk management, and real-time quality assurance monitoring.
Core Principles
The strategy operates on the principle of multi-timeframe confluence, requiring agreement between:
Market structure breaks (CHOCH/BOS) on a higher timeframe
Dual MACD momentum confirmation (classic and crypto-tuned profiles)
Trend alignment via directional EMAs
Volatility and volume filters
Quality score composite threshold
Strategy Components
Market Structure Engine : Detects Break of Structure (BOS) and Change of Character (CHOCH) events using confirmed pivots on a configurable higher timeframe. Default structure timeframe is 240 minutes (4H).
Dual MACD Fusion : Requires agreement between two MACD configurations:
Classic MACD: 12/26/9 (default)
Fusion MACD: 8/21/5 (default, optimized for crypto volatility)
Both must agree on direction before trade execution. This can be disabled to use single MACD confirmation.
Trend Alignment : Uses two EMAs for directional bias:
Directional EMA: 55 periods (default)
Execution Trend Guide: 34 periods (default)
Both must align with trade direction.
ATR Risk Management : All risk parameters are expressed in ATR multiples:
Stop Loss: 1.5 × ATR (default)
Take Profit: 3.0 × ATR (default)
Trail Activation: 1.0 × ATR profit required (default)
Trail Distance: 1.5 × ATR behind price (default)
Volume Surge Filter : Optional gate requiring current volume to exceed a multiple of the volume SMA. Default threshold is 1.4× the 20-period volume SMA.
Quality Score Gate : Composite score (0-1) combining:
Structure alignment (0.0-1.0)
Momentum strength (0.0-1.0)
Trend alignment (0.0-1.0)
ATR volatility score (0.0-1.0)
Volume intensity (0.0-1.0)
Default threshold: 0.62. Trades only execute when quality score exceeds this threshold.
Execution Discipline : Trade budgeting system:
Maximum trades per session: 6 (default)
Cooldown bars between entries: 5 (default)
Quality Assurance Console : Real-time monitoring panel displaying:
Structure status (pass/fail)
Momentum confirmation (pass/fail)
Volatility readiness (pass/fail)
Quality score (pass/fail)
Discipline compliance (pass/fail)
Performance metrics (win rate, profit factor)
Net PnL
Certification requires: Win Rate ≥ 40%, Profit Factor ≥ 1.4, Minimum 25 closed trades, and positive net profit.
Integrity Suite : Optional validation panel that audits:
Configuration sanity checks
ATR data readiness
EMA hierarchy validity
Performance realism checks
Strategy Settings
strategy(
title="ChronoPulse MS-MACD Resonance Strategy",
shorttitle="ChronPulse",
overlay=true,
max_labels_count=500,
max_lines_count=500,
initial_capital=100000,
currency=currency.USD,
pyramiding=0,
commission_type=strategy.commission.percent,
commission_value=0.015,
slippage=2,
default_qty_type=strategy.percent_of_equity,
default_qty_value=2.0,
calc_on_order_fills=true,
calc_on_every_tick=true,
process_orders_on_close=true
)
Key Input Parameters
Structure Timeframe : 240 (4H) - Higher timeframe for structure analysis
Structure Pivot Left/Right : 3/3 - Pivot confirmation periods
Structure Break Buffer : 0.15% - Buffer for structure break confirmation
MACD Fast/Slow/Signal : 12/26/9 - Classic MACD parameters
Fusion MACD Fast/Slow/Signal : 8/21/5 - Crypto-tuned MACD parameters
Directional EMA Length : 55 - Primary trend filter
Execution Trend Guide : 34 - Secondary trend filter
ATR Length : 14 - ATR calculation period
ATR Stop Multiplier : 1.5 - Stop loss in ATR units
ATR Target Multiplier : 3.0 - Take profit in ATR units
Trail Activation : 1.0 ATR - Profit required before trailing
Trail Distance : 1.5 ATR - Distance behind price
Volume Threshold : 1.4× - Volume surge multiplier
Quality Threshold : 0.62 - Minimum quality score (0-1)
Max Trades Per Session : 6 - Daily trade limit
Cooldown Bars : 5 - Bars between entries
Win-Rate Target : 40% - Minimum for QA certification
Profit Factor Target : 1.4 - Minimum for QA certification
Minimum Trades for QA : 25 - Required closed trades
Signal Generation Logic
A trade signal is generated when ALL of the following conditions are met:
Higher timeframe structure shows bullish (CHOCH/BOS) or bearish structure break
Both MACD profiles agree on direction (if fusion enabled)
Price is above both EMAs for longs (below for shorts)
ATR data is ready and above minimum threshold
Volume exceeds threshold × SMA (if volume gate enabled)
Quality score ≥ quality threshold
Trade budget available (under max trades per day)
Cooldown period satisfied
Risk Management
Stop loss and take profit are set immediately on entry
Trailing stop activates after 1.0 ATR of profit
Trailing stop maintains 1.5 ATR distance behind highest profit point
Position sizing uses 2% of equity per trade (default)
No pyramiding (single position per direction)
Limitations and Considerations
The strategy requires sufficient historical data for higher timeframe structure analysis
Quality gate may filter out many potential trades, reducing trade frequency
Performance metrics are based on historical backtesting and do not guarantee future results
Commission and slippage assumptions (0.015% + 2 ticks) may vary by broker
The strategy is optimized for trending markets with clear structure breaks
Choppy or ranging markets may produce false signals
Crypto markets may require different parameter tuning than traditional assets
Optimization Notes
The strategy includes several parameters that can be tuned for different market conditions:
Quality Threshold : Lower values (0.50-0.60) allow more trades but may reduce average quality. Higher values (0.70+) are more selective but may miss opportunities.
Structure Timeframe : Use 240 (4H) for intraday trading, Daily for swing trading, Weekly for position trading
Volume Gate : Disable for low-liquidity pairs or when volume data is unreliable
Dual MACD Fusion : Disable for mean-reverting markets where single MACD may be more responsive
Trade Discipline : Adjust max trades and cooldown based on your risk tolerance and market volatility
Non-Repainting Guarantee
All higher timeframe data requests use lookahead=barmerge.lookahead_off to prevent repainting. Pivot detection waits for full confirmation before registering structure breaks. All visual elements (tables, labels) update only on closed bars.
Alerts
Three alert conditions are available:
ChronoPulse Long Setup : Fires when all long entry conditions are met
ChronoPulse Short Setup : Fires when all short entry conditions are met
ChronoPulse QA Certification : Fires when Quality Assurance console reaches CERTIFIED status
Configure alerts with "Once Per Bar Close" delivery to match the non-repainting design.
Visual Elements
Structure Labels : CHOCH↑, CHOCH↓, BOS↑, BOS↓ markers on structure breaks
Directional EMA : Orange line showing trend bias
Trailing Stop Lines : Green (long) and red (short) trailing stop levels
Dashboard Panel : Real-time status display (structure, MACD, ATR, quality, PnL)
QA Console : Quality assurance monitoring panel
Integrity Suite Panel : Optional validation status display
Recommended Usage
Forward test with paper trading before live deployment
Monitor the QA console until it reaches CERTIFIED status
Adjust parameters based on your specific market and timeframe
Respect the trade discipline limits to avoid over-trading
Review quality scores and adjust threshold if needed
Use appropriate commission and slippage settings for your broker
Technical Implementation
The strategy uses Pine Script v6 with the following key features:
Multi-timeframe data requests with lookahead protection
Confirmed pivot detection for structure analysis
Dynamic trailing stop management
Real-time quality score calculation
Trade budgeting and cooldown enforcement
Comprehensive dashboard and monitoring panels
All source code is open and available for review and modification.
Disclaimer
This script is for educational and informational purposes only. It is not intended as financial, investment, or trading advice. Past performance does not guarantee future results. Trading involves substantial risk of loss and is not suitable for all investors. Always conduct your own research and consult with a qualified financial advisor before making any trading decisions. The author and TradingView are not responsible for any losses incurred from using this strategy.
