Previous Hour High and Low### **🔷 Previous Hour High & Low Indicator – Description**
#### 📌 **Overview**
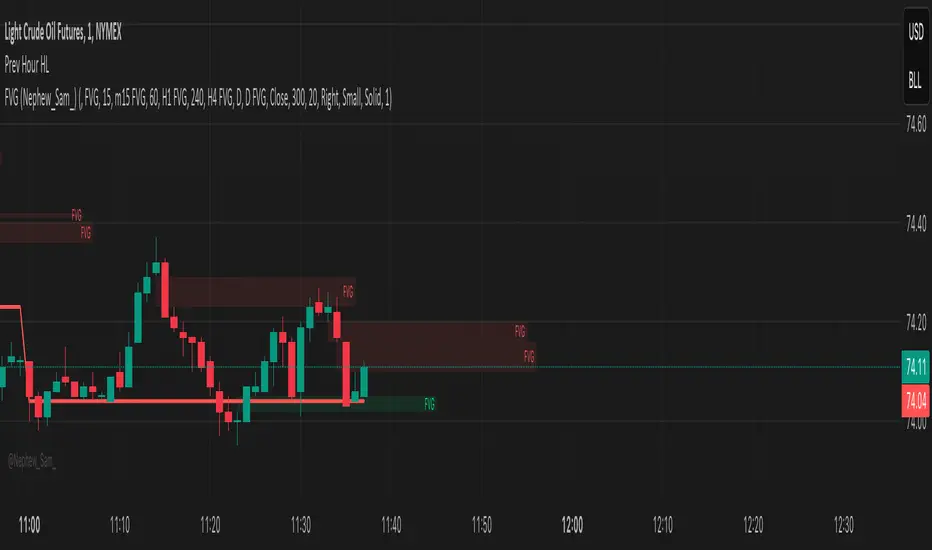
The **Previous Hour High & Low Indicator** is designed to help traders identify key levels from the last completed hourly candle. These levels often act as **support and resistance zones**, helping traders make informed decisions about potential breakouts, reversals, and liquidity grabs.
#### 🎯 **How It Works**
- At the start of every new hour, the indicator **locks in** the **high and low** from the **previous fully completed hour**.
- It then **draws horizontal lines** on the chart, marking these levels.
- Works **only on intraday timeframes** (e.g., 1m, 5m, 15m, 30m), ensuring clean and relevant levels.
- Updates dynamically **every new hour** without repainting.
#### 🔑 **Why Is This Useful?**
✔ **Identifies Key Liquidity Zones** – The market often reacts to previous hour highs/lows, making them useful for stop hunts, liquidity grabs, and order block setups.
✔ **Works Well with ICT Concepts** – If you're trading **ICT kill zones**, these levels can help in finding optimal trade entries.
✔ **Helps with Breakout & Rejection Setups** – Traders can watch for price breaking or rejecting these levels for trade confirmation.
✔ **Useful for Scalping & Day Trading** – Works best for short-term traders looking for intraday movements.
#### ⚙ **Customization Options**
- The high and low levels are color-coded:
🔵 **Previous Hour High (Blue)** → Acts as potential resistance or breakout point.
🔴 **Previous Hour Low (Red)** → Acts as potential support or breakdown level.
#### 📊 **Best Timeframes to Use This On**
- **1-minute, 5-minute, 15-minute, 30-minute charts** → Most effective for intraday trading.
- Avoid using on **hourly or higher timeframes**, as these levels become less relevant.
---
🚀 **This indicator is perfect for traders looking to track short-term price reactions at key levels.** Let me know if you want to add alerts, zone shading, or any other enhancements! 🔥
Search in scripts for "low"
[GrandAlgo] MTF Historical Highs and LowsMany traders rely on weekly highs and lows to identify key market levels, but what if you could see how price reacted to these levels in past weeks, months, or even years? With MTF Historical Highs and Lows, you can visualize all past highs, lows, and midpoints from any timeframe, allowing you to refine your strategy and make more informed trading decisions.
This indicator retrieves and plots historical highs, lows, and midpoints based on a user-selected timeframe (default: Weekly). It dynamically updates, ensuring that all significant price levels remain visible on your chart. Additionally, smart filtering helps you focus only on relevant levels, and alerts notify you when price interacts with key zones.
Key Features:
✅ Automatically Fetches & Plots Historical Highs, Lows, and Midpoints
✅ Customizable Timeframes (default: Weekly, but adjustable)
✅ Visibility Filtering – Hides lines that are too far from the current price
✅ Alerts for Key Levels – Get notified when price touches an important historical level
✅ Customizable Colors & Display Preferences for clarity
How It Works:
1️⃣ Select a Date Range – Focus on historical levels that are most relevant to the current market conditions
2️⃣ Choose a Timeframe – Use Weekly, Monthly, or any timeframe that suits your strategy.
3️⃣ Enable Highs, Lows, and Midpoints – Customize what you want to see.
4️⃣ Adjust Filtering – Hide lines that are too far from the current price to reduce clutter.
5️⃣ Get Alerts – Be notified when price reaches a historical level for potential trade setups.
Ideal for Traders Who:
Trade Support & Resistance Levels – Understand how price reacts at historical highs and lows.
Analyze Market Structure – Identify key areas where price may reverse or break out.
Want Smart Alerts – Stay informed without staring at charts all day.

Buy on 5 day low Strategy█ STRATEGY DESCRIPTION
The "Buy on 5 Day Low Strategy" is a mean-reversion strategy designed to identify potential buying opportunities when the price drops below the lowest low of the previous five days. It enters a long position when specific conditions are met and exits when the price exceeds the high of the previous day. This strategy is optimized for use on daily or higher timeframes.
█ WHAT IS THE 5-DAY LOW?
The 5-Day Low is the lowest price observed over the last five days. This level is used as a reference to identify potential oversold conditions and reversal points.
█ SIGNAL GENERATION
1. LONG ENTRY
A Buy Signal is triggered when:
The close price is below the lowest low of the previous five days (`close < _lowest `).
The signal occurs within the specified time window (between `Start Time` and `End Time`).
2. EXIT CONDITION
A Sell Signal is generated when the current closing price exceeds the high of the previous day (`close > high `). This indicates that the price has shown strength, potentially confirming the reversal and prompting the strategy to exit the position.
█ ADDITIONAL SETTINGS
Start Time and End Time: The time window during which the strategy is allowed to execute trades.
█ PERFORMANCE OVERVIEW
This strategy is designed for mean-reverting markets and performs best when the price frequently oscillates around key support levels.
It is sensitive to oversold conditions, as indicated by the 5-Day Low, and overbought conditions, as indicated by the previous day's high.
Backtesting results should be analyzed to optimize the strategy for specific instruments and market conditions.

3-Bar Low Strategy█ STRATEGY DESCRIPTION
The "3-Bar Low Strategy" is a mean-reversion strategy designed to identify potential buying opportunities when the price drops below the lowest low of the previous three bars. It enters a long position when specific conditions are met and exits when the price exceeds the highest high of the previous seven bars. This strategy is suitable for use on various timeframes.
█ WHAT IS THE 3-BAR LOW?
The 3-Bar Low is the lowest price observed over the last three bars. This level is used as a reference to identify potential oversold conditions and reversal points.
█ WHAT IS THE 7-BAR HIGH?
The 7-Bar High is the highest price observed over the last seven bars. This level is used as a reference to identify potential overbought conditions and exit points.
█ SIGNAL GENERATION
1. LONG ENTRY
A Buy Signal is triggered when:
The close price is below the lowest low of the previous three bars (`close < _lowest `).
The signal occurs within the specified time window (between `Start Time` and `End Time`).
If the EMA Filter is enabled, the close price must also be above the 200-period Exponential Moving Average (EMA).
2. EXIT CONDITION
A Sell Signal is generated when the current closing price exceeds the highest high of the previous seven bars (`close > _highest `). This indicates that the price has shown strength, potentially confirming the reversal and prompting the strategy to exit the position.
█ ADDITIONAL SETTINGS
MA Period: The lookback period for the 200-period EMA used in the EMA Filter. Default is 200.
Use EMA Filter: Enables or disables the EMA Filter for long entries. Default is disabled.
Start Time and End Time: The time window during which the strategy is allowed to execute trades.
█ PERFORMANCE OVERVIEW
This strategy is designed for mean-reverting markets and performs best when the price frequently oscillates around key support and resistance levels.
It is sensitive to oversold conditions, as indicated by the 3-Bar Low, and overbought conditions, as indicated by the 7-Bar High.
Backtesting results should be analyzed to optimize the MA Period and EMA Filter settings for specific instruments.

Pivot Highs/Lows with Bar CountsWhat does the indicator do?
This indicator adds labels to a chart at swing (a.k.a., "pivot") highs and lows. Each label may contain a date, the closing price at the swing, the number of bars since the last swing in the same direction, and the number of bars from the last swing in the opposite direction. A table is also added to the chart that shows the average, min, and max number of bars between swings.
OK, but how do I use it?
Many markets -- especially sideways-moving ones -- commonly cycle between swing highs and lows at regular time intervals. By measuring the number of bars between highs and lows -- both same-sided swings (i.e., H-H and L-L) and opposite-sided swings (i.e., H-L and L-H) -- you can then project the averages of those bar counts from the last high or low swing to make predictions about where the next swing high or low should occur. Note that this indicator does not make the projection for you. You have to determine which swing you want to project from and then use the bar counts from the indicator to draw a line, place a label, etc.
Example: Chart of BTC/USD
The indicator shows pivot highs and lows with bar counts, and it displays a table of stats on those pivots.
If you focus on the center section of the chart, you can see that prices were moving in a sideways channel with very regular highs and lows. This indicator counts the bars between these pivots, and you could have used those counts to predict when the next high or low may have occurred.
The bar counts do not work as well on the more recent section of the chart because there are no regularly time swings.

Session High/Low Average & Range [1CG]The Session High/Low Average & Range indicator independently measures the average price movement from the opening price in each direction. It also displays the maximum high and low distance, called Range. Separating the averages and range into highs and lows helps analyze the volatility of the market as well as the direction.
USE EXAMPLES
Session Open
Session Close
Customization
Minimal - 1x and 2x Averages are replaced with custom lines, in order to show distance to3x.
Calculations
Average High: (high price of session - session opening price) / (session period)
Average Low: (session opening price - low price of session) / (session period)
Range High: The highest price of the last (session period)
Range Low: The lowest price of the last (session period)
INPUTS
Session
Here you can choose the hours for your session and time zone. The default is London session in New York time. Next, the session period determines how many sessions to sample from for the average and range lines, the default is 20. Lastly, you can choose the number of sessions to appear on the chart not including the current session if you are in one, 5 by default.
Lines
All of the lines allow you to change the color, width, and style. They also have a label option to choose to display the price. The bottom of the section allows you to change the location and size of the label text.
**Open Line** -Displays the opening price for the length of the session.
**Average Lines** - Displays the 1x, 2x, and 3x the average distance from open in each direction. Additionally, you can toggle a background color to highlight the area.
**Custom Lines** - Displays a customizable multiple of either the average or range. By default the first custom line displays the Range at a 1x multiplier and the second line displays an Average at a 1.5x multiplier
Display Distance
Here you can choose to display the distance from the lines to the open. This data is marked with a “Δ”. For the three Average lines this will display in the area between the line and the open in the position and size of your choice. The custom lines will have the distance information displayed on the line itself. This helps keep the data organized.

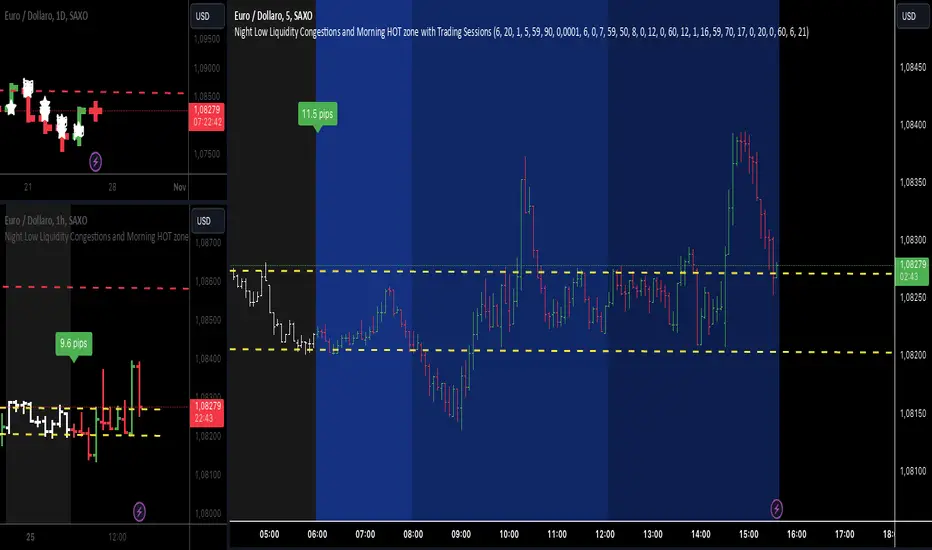
Night Low Liquidity Congestions with 4 Trading SessionsThis indicator is designed to help traders visualize and analyze key market periods of low liquidity during the night and identify high-activity zones in the morning. It also includes customizable time sessions for major global markets, including the European and American sessions, as well as the London Close session.
T he main functionalities include:
- Night Low Liquidity Phase: This highlights periods with typically low market activity during the night (default: 20:01–5:59). It also displays the total range (in pips) during this phase, allowing traders to identify potential price consolidations.
- Morning Hot Zone: This focuses on high-activity periods in the early morning (default: 6:00–7:59), providing visual cues without altering bar colors.
- European Trading Session: Displays the European market’s open hours (default: 8:00–12:00), shaded in blue, to mark increased volatility typically seen during this period.
- American Trading Session: Marks the active hours of the U.S. market (default: 12:01–16:59), where market activity tends to peak.
- London Close Area: Highlights the closing hours of the London market (default: 17:00–20:00), allowing traders to track potential liquidity shifts.
Key Features:
1. Customizable Time Sessions:
- The indicator allows for full customization of the start and end times for each market session, making it adaptable to different instruments and trading style.
- Traders can choose their preferred color and opacity for each time zone to suit their charting preferences.
2. Night Low Liquidity Pip Range Calculation:
- Automatically calculates and displays the pip range for the Night Low Liquidity phase.
- The range is colored red if it exceeds the specified threshold and green if it remains below it.
3. Alarm System:
- Customizable alerts for H1, M15, and M5 timeframes.
- Traders can set alerts to trigger just before a bar closes during specific sessions (European, American, or London Close) and on selected days of the week (Monday–Friday).
- The alarm system allows for full customization of active hours and days, giving traders full control over their notifications.
4. Clear Visual Cues:
- The indicator uses transparent shading to differentiate market sessions, making it easy to spot different phases of the trading day.
- Each session is visually distinct and can be toggled on or off based on trader preferences.
Ideal For:
- Traders who focus on intraday strategies and want to understand how market sessions affect liquidity and volatility.
- Those looking to trade during specific time windows like the Night Low Liquidity or Morning Hot Zones.
- Traders who need to automate their alerts based on specific market hours and close events for major timeframes.
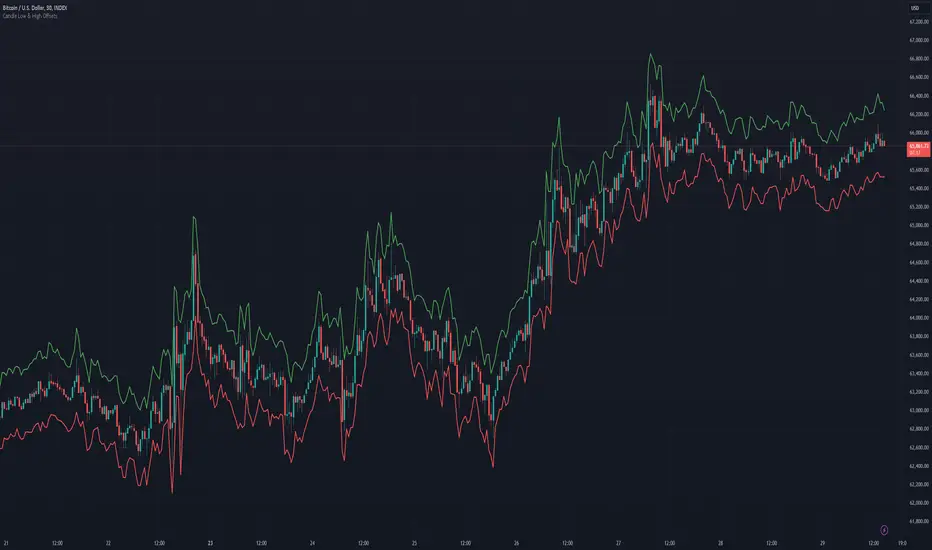
Candle Low Offset [QuadzCrypto]==== Candle Low Offset Indicator ====
==== Overview ====
The "Candle Low Offset" indicator offers a method for tracking a price point that sit below the low of each candle by a percentage offset.
It was originally intended to provide a price point with flexibility for setting a stop loss below the entry candle low, however, it could be used for other applications.
==== Definitions ====
- Offset Percentage: The % below the low you wish the trend line to follow configurable to 0.01 increments
==== Plots ====
- Offset: Plots a trend line below the candle lows
==== Style ====
- Offset: Allows users to configure the colour and thickness of the offset plot line
==== Application ====
This has been coded to be used with the Max StopLoss function on the Krown Quant SKX indicator to provide an alternative stop loss location on the entry candle.
==== Disclaimer ====
This indicator is for educational purposes only and should not be construed as financial advice. Trading involves risk, and you should consult with a qualified financial advisor before making any trading decisions.
Sinc MAKaiser Windowed Sinc Moving Average Indicator
The Kaiser Windowed Sinc Moving Average is an advanced technical indicator that combines the sinc function with the Kaiser window to create a highly customizable finite impulse response (FIR) filter for financial time series analysis.
Sinc Function: The Ideal Low-Pass Filter
At the core of this indicator is the sinc function, which represents the impulse response of an ideal low-pass filter. In signal processing and technical analysis, the sinc function is crucial because it allows for the creation of filters with precise frequency cutoff characteristics. When applied to financial data, this means the ability to separate long-term trends from short-term fluctuations with remarkable accuracy.
The primary advantage of using a sinc-based filter is the independent control over two critical parameters: the cutoff frequency and the number of samples used. The cutoff frequency, analogous to the "length" in traditional moving averages, determines which price movements are considered significant (low frequency) and which are treated as noise (high frequency). By adjusting the cutoff, analysts can fine-tune the filter to respond to specific market cycles or timeframes of interest.
The number of samples used in the filter doesn't affect the cutoff frequency but instead influences the filter's accuracy and steepness. Increasing the sample size results in a better approximation of the ideal low-pass filter, leading to sharper transitions between passed and attenuated frequencies. This allows for more precise trend identification and noise reduction without changing the fundamental frequency response characteristics.
Kaiser Window: Optimizing the Sinc Filter
While the sinc function provides excellent frequency domain characteristics, it has infinite length in the time domain, which is impractical for real-world applications. This is where the Kaiser window comes into play. By applying the Kaiser window to the sinc function, we create a finite-length filter that approximates the ideal response while minimizing unwanted oscillations (known as the Gibbs phenomenon) in the frequency domain.
The Kaiser window introduces an additional parameter, alpha, which controls the trade-off between the main-lobe width and side-lobe levels in the frequency response. This parameter allows users to fine-tune the filter's behavior, balancing between sharp cutoffs and minimal ripple effects.
Customizable Parameters
The Kaiser Windowed Sinc Moving Average offers several key parameters for customization:
Cutoff: Controls the filter's cutoff frequency, determining the divide between trends and noise.
Length: Sets the number of samples used in the FIR filter calculation, affecting the filter's accuracy and computational complexity.
Alpha: Influences the shape of the Kaiser window, allowing for fine-tuning of the filter's frequency response characteristics.
Centered and Non-Centered Modes
The indicator provides two operational modes:
Non-Centered (Real-time) Mode: Uses half of the windowed sinc function, suitable for real-time analysis and current market conditions.
Centered Mode: Utilizes the full windowed sinc function, resulting in a zero-phase filter. This mode introduces a delay but offers the most accurate trend identification for historical analysis.
Visualization Features
To enhance the analytical value of the indicator, several visualization options are included:
Gradient Coloring: Offers a range of color schemes to represent trend direction and strength.
Glow Effect: An optional visual enhancement for improved line visibility.
Background Fill: Highlights the area between the moving average and price, aiding in trend visualization.
Applications in Technical Analysis
The Kaiser Windowed Sinc Moving Average is particularly useful for precise trend identification, cycle analysis, and noise reduction in financial time series. Its ability to create custom low-pass filters with independent control over cutoff and filter accuracy makes it a powerful tool for analyzing various market conditions and timeframes.
Compared to traditional moving averages, this indicator offers superior frequency response characteristics and reduced lag in trend identification when properly tuned. It provides greater flexibility in filter design, allowing analysts to create moving averages tailored to specific trading strategies or market behaviors.
Conclusion
The Kaiser Windowed Sinc Moving Average represents an advanced approach to price smoothing and trend identification in technical analysis. By making the ideal low-pass filter characteristics of the sinc function practically applicable through Kaiser windowing, this indicator provides traders and analysts with a sophisticated tool for examining price trends and cycles.
Its implementation in Pine Script contributes to the TradingView community by making advanced signal processing techniques accessible for experimentation and further development in technical analysis. This indicator serves not only as a practical tool for market analysis but also as an educational resource for those interested in the intersection of signal processing and financial markets.
Related script:

Larry Connors 3 Day High/Low StrategyThe Larry Connors 3 Day High/Low Strategy is a short-term mean-reversion trading strategy that is designed to identify potential buying opportunities when a security is oversold. This strategy is based on the principles developed by Larry Connors, a well-known trading system developer and author.
Key Strategy Elements:
1. Trend Confirmation: The strategy first confirms that the security is in a long-term uptrend by ensuring that the closing price is above the 200-day moving average (condition1). This rule helps filter trades to align with the longer-term trend.
2. Short-Term Pullback: The strategy looks for a short-term pullback by ensuring that the closing price is below the 5-day moving average (condition2). This identifies potential entry points when the price temporarily moves against the longer-term trend.
3. Three Consecutive Lower Highs and Lows:
• The high and low two days ago are lower than those of the day before (condition3).
• The high and low yesterday are lower than those of two days ago (condition4).
• Today’s high and low are lower than yesterday’s (condition5).
These conditions are used to identify a sequence of declining highs and lows, signaling a short-term pullback or oversold condition in the context of an overall uptrend.
4. Entry and Exit Signals:
• Buy Signal: A buy order is triggered when all the above conditions are met (buyCondition).
• Sell Signal: A sell order is executed when the closing price is above the 5-day moving average (sellCondition), indicating that the pullback might be ending.
Risks of the Strategy
1. Mean Reversion Failure: This strategy relies on the assumption that prices will revert to the mean after a short-term pullback. In strong downtrends or during market crashes, prices may continue to decline, leading to significant losses.
2. Whipsaws and False Signals: The strategy may generate false signals, especially in choppy or sideways markets where the price does not follow a clear trend. This can lead to frequent small losses that can add up over time.
3. Dependence on Historical Patterns: The strategy is based on historical price patterns, which do not always predict future price movements accurately. Sudden market news or economic changes can disrupt the pattern.
4. Lack of Risk Management: The strategy as written does not include stop losses or position sizing rules, which can expose traders to larger-than-expected losses if conditions change rapidly.
About Larry Connors
Larry Connors is a renowned trader, author, and founder of Connors Research and TradingMarkets.com. He is widely recognized for his development of quantitative trading strategies, especially those focusing on short-term mean reversion techniques. Connors has authored several books on trading, including “Short-Term Trading Strategies That Work” and “Street Smarts,” co-authored with Linda Raschke. His strategies are known for their systematic, rules-based approach and have been widely used by traders and investment professionals.
Connors’ research often emphasizes the importance of trading with the trend, managing risk, and using statistically validated techniques to improve trading outcomes. His work has been influential in the field of quantitative trading, providing accessible strategies for traders at various skill levels.
References
1. Connors, L., & Raschke, L. (1995). Street Smarts: High Probability Short-Term Trading Strategies.
2. Connors, L. (2009). Short-Term Trading Strategies That Work.
3. Fama, E. F., & French, K. R. (1988). Permanent and Temporary Components of Stock Prices. Journal of Political Economy, 96(2), 246-273.
This strategy and its variations are popular among traders looking to capitalize on short-term price movements while aligning with longer-term trends. However, like all trading strategies, it requires rigorous backtesting and risk management to ensure its effectiveness under different market conditions.

Daily High and Low Levels IndicatorThis Pine Script indicator displays horizontal lines representing the high and low levels of the previous trading day, extending them to the right side of the chart for better visibility. It updates automatically at the start of each new trading day.
Features:
Daily High and Low Levels: Marks the high and low levels of the previous day with horizontal lines.
Customization:
Adjust the color, style, and thickness of the lines to fit your preferences.
High Level Line Color: Customize to your preferred color (default: gray).
Low Level Line Color: Customize to your preferred color (default: white).
Line Style Options: Choose between solid, dashed, or dotted lines.
Line Thickness: Adjust the width of the lines.
Extended Lines: Extend the lines to the right side of the chart for enhanced visibility.
Labeling: Shows clear labels "Previous High" and "Previous Low" next to the lines for easy reference.
Usage :
Add this indicator to your chart to visualize the previous day's high and low levels.
Customize the appearance of the lines and labels using the input options.
The indicator will automatically update these levels at the beginning of each trading day.
This indicator is designed to help traders quickly identify significant price levels from the previous day and make informed trading decisions.
License: This script is provided under the Attribution-NonCommercial-ShareAlike 4.0 International (CC BY-NC-SA 4.0) License. For more information, visit Creative Commons License.

Pivot Highs&lows: Short/Medium/Long-term + Spikeyness FilterShows Pivot Highs & Lows defined or 'Graded' on a fractal basis: Short-term, medium-term and long-term. Also applies 'Spikeyness' condition by default to filter-out weak/rounded pivots
ES1! 4hr chart (CME) shown above, with lookback = 15; clearly identifying the major highs & lows on the basis of how they are fractally 'nested' within lesser Pivots.
-- in the above chart Short term pivot highs (STH) are simply represented by green 'ʌ', and short-term pivot lows (STL) are simply represented by orange 'v'.
//Basics: (as applying to pivot highs, the following is reversed for pivot lows)
-Short term highs (STH) are simple pivot highs, albeit refined from standard with the 'spikeyness' filter.
-Medium-term highs (MTH) are defined as having a lower STH on either side of them.
-Long-term highs (LTH) are defined as having a lower MTH on either side of them.
//Purpose:
-Education: Quick and easy visualization of the strength or importance of a pivot high or low; a way of grading them based on their larger context.
-Backtesting: use in combination with other trading methods when backtesting to see the relative significance and price sensitivity of LTHs/LTLs compared to lower grade highs and lows.
//Settings:
-Choose Pivot lookback/lookforward bars: One setting, the basis from which all further pivot calculations are done.
-Toggle on/off 'Spikeyness' condition to filter-out weak/rounded/unimpressive pivot highs or lows (default is ON).
-Toggle on/off each of STH, MTH, LTH, STL, MTL, LTL; and choose label text-styles/colors/sizes independently.
-Set text Vertically, horizonally, or simply use 'ʌ' or 'v' symbols if you want to declutter your chart.
//Usage notes:
-Pivots take time to print (lookback bars must have elapsed before confirmation). Fractally nested pivots as here (i.e. a LTH), take even longer to print/confirm, so please be patient.
-Works across timeframes & Assets. Different timeframes may require slightly tweaked lookback/forward settings for optimal use; default is 15 bars.
Example usage with just symbolic labels short-term, med-term, long-term with 1x, 2x and 3x ʌ/v respectively:

Top 40 High Low Strategy for SPY, 5minThis strategy is developed based on my High Low Index SPY Top 40 indicator
Notes:
- this strategy is only developed for SPY on the 5 min chart . It seems to work with QQQ as well, but it isn't optimized for it
- P/L shown is based on 10 SPY option contracts, call or put, with strike price closest to the entry SPY price and expiry of 0 to 1 day. This includes commissions (can be changed). This is only an estimate calculated using an arbitrary multiplier factor, this can be changed in the setting
- P/L is based on $5000 initial capital
- Works with both regular / extended trading session turned on/off. However, max drawdown is 1/2 with extended trading session ON
- there is still a bug that doesn't allow alert to be created due to calculation error, will update once fixed
This strategy combines signals from the following indicators to determine entry signals:
- High Low Index SPY Top 40
- MACD
- Linear Regression Slope
Entry signal is triggered when:
- High Low Index line crosses the EMA line
- MACD trending in the same direction
- Linear Regression slope is accelerating above a threshold in the same direction, indicating a strong trend
Profit target(PT) and stop loss(SL) are determined using ATR value, with 2:1 Reward to Risk ratio as default.
Exit signal may be triggered prior to PT or SL trigger when:
- High Low Index SPY Top 40 shows a reversal after overbought or oversold conditions (optional)
- Opposite entry signal is triggered
There are a number of optional settings:
- Turn on/off "option trading", P/L will be calculated using share price only without multiplication factor for trading option contracts
- # of options per trade, default to 10
- Reinvest with profit made
- Trade with trailing SL after PT hit
- Take profit early based on Top 40 overbought/oversold
- Trade 0/1 day expiry. This will signal exit by the end of the day on Mon/Wed/Fri, and only exits 1/2 of positions (if in profit) on Tues/Thurs
- Can reduce the SL level without impacting PT
- No entry between 10:05 - 10:20 (don't ask me why, but statistically it performs better)
Consider donating me some of your profit if you make $$$ hahaha~ ;)
Enjoy~~

Same high/lowIf you are using support/resistance level-based strategies in your trading then this indicator can help you. I think that the retest level strategy is the best for beginners due to its simplicity of risk/reward calculations and higher abundance on the market. There is a well-known method to recognize a big player (buyer/seller) by candlestick pattern where the last two candles have the same low or same high. Moreover, abnormal candles increase the probability of a retest of a strong level, so my indicator highlights these two situations. In my opinion, a higher timeframe of a candle chart increases the win rate for this indicator (>1h).
So there are several patterns which my indicator can recognize:
1. Same low/high: blue flag up - same low, blue flag down - same high.
2. Mirror levels: high-low - green flag up, low-high - green flag down.
3. abnormal candles: yellow body if >2*ATR (please tune atr in properties, the default value is 5).
4. The red flag indicates the third candle with the same high/low in a row.
Thanks for your attention and have a good trading time!

Donchian Channel - Pivot High-LowCombining Pivot High Low and Donchian Channel - both of which are useful indicators for trend following.
Donchian Channel shows highest and lowest prices for X number of bars.
Pivot High-Low identifies when price made new Highs and Lows
Applying Donchian Channel on Pivot High-Low channel, we are plotting highest and lowest pivots formed in X bars.
In this indicator, we have 3 options for Channel Base :
Price : This is regular Donchian channel based on High-Low Price
Pivots : This is Donchian channel based on pivot points.
Combined : Combines both. Takes highest of Price and Pivots for plotting high, lowest of Price and Pivots for plotting low

Shapeshifting Moving Average - Switching From Low-Lag To SmoothThe term "shapeshifting" is more appropriate when used with something with a shape that isn't supposed to change, this is not the case of a moving average whose shape can be altered by the length setting or even by an external factor in the case of adaptive moving averages, but i'll stick with it since it describe the purpose of the proposed moving average pretty well.
In the case of moving averages based on convolution, their properties are fully described by the moving average kernel ( set of weights ), smooth moving averages tend to have a symmetrical bell shaped kernel, while low lag moving averages have negative weights. One of the few moving averages that would let the user alter the shape of its kernel is the Arnaud Legoux moving average, which convolve the input signal with a parametric gaussian function in which the center and width can be changed by the user, however this moving average is not a low-lagging one, as the weights don't include negative values.
Other moving averages where the user can change the kernel from user settings where already presented, i posted a lot of them, but they only focused on letting the user decrease or increase the lag of the moving average, and didn't included specific parameters controlling its smoothness. This is why the shapeshifting moving average is proposed, this parametric moving average will let the user switch from a smooth moving average to a low-lagging one while controlling the amount of lag of the moving average.
Settings/Kernel Interaction
Note that it could be possible to design a specific kernel function in order to provide a more efficient approach to today goal, but the original indicator was a simple low-lag moving average based on a modification of the second derivative of the arc tangent function and because i judged the indicator a bit boring i decided to include this parametric particularity.
As said the moving average "kernel", who refer to the set of weights used by the moving average, is based on a modification of the second derivative of the arc tangent function, the arc tangent function has a "S" shaped curve, "S" shaped functions are called sigmoid functions, the first derivative of a sigmoid function is bell shaped, which is extremely nice in order to design smooth moving averages, the second derivative of a sigmoid function produce a "sinusoid" like shape ( i don't have english words to describe such shape, let me know if you have an idea ) and is great to design bandpass filters.
We modify this 2nd derivative in order to have a decreasing function with negative values near the end, and we end up with:
The function is parametric, and the user can change it ( thus changing the properties of the moving average ) by using the settings, for example an higher power value would reduce the lag of the moving average while increasing overshoots. When power < 3 the moving average can act as a slow moving average in a moving average crossover system, as weights would not include negative values.
Here power = 0 and length = 50. The shapeshifting moving average can approximate a simple moving average with very low power values, as this would make the kernel approximate a rectangular function, however this is only a curiosity and not something you should do.
As A Smooth Moving Average
“So smooth, and so tranquil. It doesn't get any quieter than this”
A smooth moving average kernel should be : symmetrical, not to width and not to sharp, bell shaped curve are often appropriates, the proposed moving average kernel can be symmetrical and can return extremely smooth results. I will use the Blackman filter as comparison.
The smooth version of the moving average can be used when the "smooth" setting is selected. Here power can only be an even number, if power is odd, power will be equal to the nearest lowest even number. When power = 0, the kernel is simply a parabola:
More smoothness can be achieved by using power = 2
In red the shapeshifting moving average, in green a Blackman filter of both length = 100. Higher values of power will create lower negative values near the border of the kernel shape, this often allow to retain information about the peaks and valleys in the input signal. Power = 6 approximate the Blackman filter pretty well.
Conclusion
A moving average using a modification of the 2nd derivative of the arc tangent function as kernel has been presented, the kernel is parametric and allow the user to switch from a low-lag moving average where the lag can be increased/decreased to a really smooth moving average.
As you can see once you get familiar with a function shape, you can know what would be the characteristics of a moving average using it as kernel, this is where you start getting intimate with moving averages.
On a side note, have you noticed that the views counter in posted ideas/indicators has been removed ? This is truly a marvelous idea don't you think ?
Thanks for reading !

6am Candle High/Low Indicator with Highlight6am Candle High/Low Indicator with Highlight
6am Candle High/Low Indicator with Highlight
6am Candle High/Low Indicator with Highlight
6am Candle High/Low Indicator with Highlight 6am Candle High/Low Indicator with Highlight

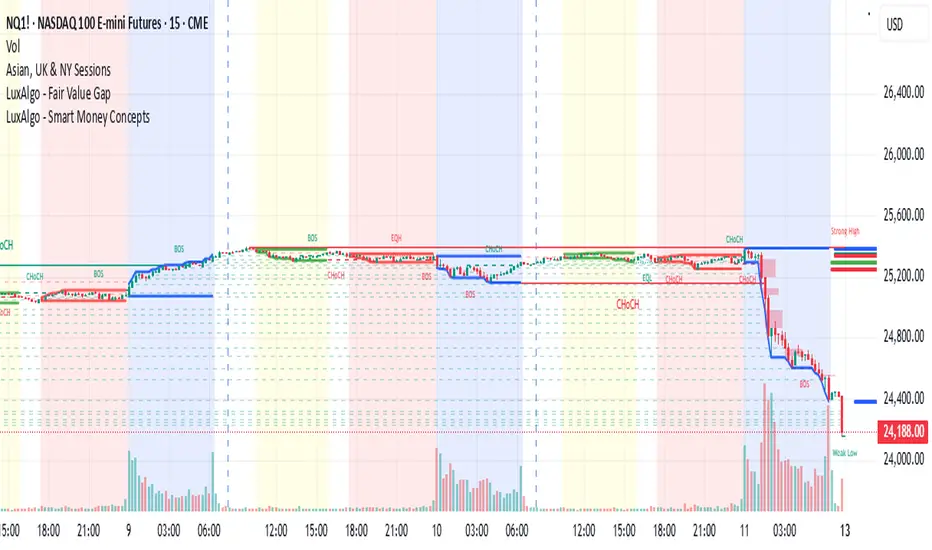
Asian, UK & NY SessionTimes and Day Highs and LowsWhat It Does
The Asian, UK & NY Sessions indicator automatically identifies and highlights the three major global trading sessions on your chart.
For each session, it:
Detects session time in its local timezone.
Tracks the session’s highest and lowest prices.
Plots colored horizontal lines to show those levels throughout the trading day.
Optionally shades each session’s background in its signature color for instant visual context:
🟡 Asian Session: Yellow background
🔴 London Session: Red background
🔵 New York Session: Blue background
This helps traders see how price reacts within and between sessions — spotting overlaps, liquidity zones, and daily ranges.
⚙️ Inputs and Variables
Input Description
Extend lines until next session start (extendLines) Extends each session’s high/low lines forward until the next session begins.
Show prices in scale column (showScaleValues) Controls whether the price labels for session highs/lows appear on the chart’s right-hand price scale.
Show All Session Highs & Lows (showAllHighsLows) Master switch — turn this off to hide all session lines instantly, keeping the chart clean.
Show Session Backgrounds (showBackgrounds) Turns all background shading on or off. When off, all session colors disappear.
Background Opacity (bgOpacityAll) Adjusts the transparency for all session backgrounds (0 = solid, 100 = fully transparent).
🎨 Visual Color Scheme
Session Background High/Low Line
Asian Yellow Green
London Red Red
New York Blue Blue
Each color has a consistent role — making it easy to distinguish sessions even in replay or live view.
Price Tracking:
For each session, the indicator resets High and Low when the new session starts, then updates them as bars print.
Display Control:
If lines or backgrounds are disabled via settings, they’re completely hidden (no clutter, no partial transparency).
💡 How Traders Use It
Identify daily ranges in each global session.
Compare volatility between markets.
Align entries or exits with session transitions.
Observe how price respects previous session highs/lows.
HTF Candle Highs and Lows with Labels + High Probability Signals█ OVERVIEW
This indicator overlays Weekly, Daily, and H4 High/Low levels directly onto your chart, allowing traders to visualize key support and resistance zones from higher timeframes. It also includes high probability breakout signals that appear one candle after a confirmed breakout above or below these levels, filtered by volume and candle strength.
Use this tool to identify breakout opportunities with greater confidence and clarity.
█ FEATURES
• Plots Weekly, Daily, and H4 High and Low levels using request.security. • Customizable line colors, widths, and label sizes. • Toggle visibility for each timeframe independently. • Signals appear one candle after a confirmed breakout: • Bullish: Close above HTF High, strong candle, high volume. • Bearish: Close below HTF Low, strong candle, high volume. • Signal shapes match the color of the broken level for visual clarity.
█ HOW TO USE
1 — Enable the timeframes you want to track using the input toggles. 2 — Watch for triangle-shaped signals: • Upward triangle = Bullish breakout. • Downward triangle = Bearish breakout. 3 — Confirm the breakout: • Candle closes beyond the HTF level by at least 0.1%. • Candle body shows momentum (close > open for bullish, close < open for bearish). • Volume exceeds 20-period average. 4 — Enter trade on the candle after the signal. 5 — Use the HTF level as a reference for stop-loss placement. 6 — Combine with other indicators (e.g., RSI, EMA) for confluence.
█ LIMITATIONS
• Signals may lag by one candle due to confirmation logic. • Not optimized for low-volume assets or illiquid markets. • Best used in trending environments; avoid during consolidation. • Does not include automatic alerts (can be added manually).
█ BEST PRACTICES
• Use on H1 or higher timeframes for cleaner signals. • Avoid trading during news events or low volatility. • Backtest thoroughly before live trading. • Adjust breakout percentage and volume filter based on asset volatility. • Maintain a trading journal to track performance.

Higher High Lower Low Higher High Lower Low 🦉{Phanchai} — TradingView Description
Structure detector with dynamic Support/Resistance, customizable labels, and ready-made alerts (Pine v6).
This script marks market structure turning points — HH (Higher High), HL (Higher Low), LH (Lower High), LL (Lower Low) — and builds segmented Support/Resistance lines from those turns. Labels and colors are fully customizable and the script ships with multiple alert conditions.
What it does
Detects swing pivots using left/right bar windows, then classifies each confirmed swing as HH/HL/LH/LL.
Plots compact labels at the confirmed pivot bars with tooltips (English).
Derives dynamic Support / Resistance : every time structure flips, the previous level is closed and a new segment starts, extending to the right .
Provides alert conditions for any label and for specific first-occurrence shifts (e.g., first HH after a bearish label).
How it works (in short)
A pivot high/low confirms only after Right Bars candles have closed; labels and S/R appear at that confirmation bar.
An internal backbone (zigzag-like) is built from confirmed pivots, with light consistency checks to avoid contradictory sequences.
Structure rules compare the recent five pivots (A…E) to decide HH/HL/LH/LL.
S/R is updated from structure: e.g., in an up leg, new HLs refresh Support; in a down leg, new LHs refresh Resistance.
Alerts included
Any structure label (HH/HL/LH/LL) — Fires on any new label.
First LL after HL/HH — First bearish break after a bullish label.
First HH after LL/LH — First bullish break after a bearish label.
LL or HL formed — Any low-side label.
LH or HH formed — Any high-side label.
HL formed
HH formed
LL formed
LH formed
How to use (quick start)
Add the indicator to your chart.
Choose Left/Right Bars for your timeframe (e.g., 5–10 for intraday; larger for higher timeframes).
Pick your label colors/sizes and S/R style.
Right-click the chart → Add alert… → Condition: this indicator → select the desired alert.
Notes & tips
Because pivots require Right Bars to confirm, labels and S/R appear with a natural delay of that many bars. This avoids repainting.
Raising Left/Right Bars reduces noise and increases the average distance between pivots; lowering them increases sensitivity.
Structure is strict: sometimes you may see two HL (or two LH) in a row if the intermediate opposite swing didn’t qualify as HH/LH (or LL/HL).
S/R segments are drawn with line objects ; they are controlled via Inputs (style/width/color), not the Style tab.
This tool highlights structure; it’s not a standalone entry/exit system. Combine with volume, trend, or risk management rules.
Built with Pine v6. Clean, compact labels; segmented S/R that updates only on confirmed changes; comprehensive alerts ready for automation.

Daily High/Low (15m) + EMA Pre-Market H/L + ORBStraightforward:
I built a swing-trading indicator with ChatGPT that plots 15-minute highs and lows, draws pre-market high/low lines, and adds a 15-minute opening-range breakout feature.
Technical:
Using ChatGPT, I developed a swing-trade indicator that calculates 15-minute highs/lows, overlays pre-market high and low levels, and includes a 15-minute Opening Range Breakout (ORB) module.
Promotional:
I created a ChatGPT-powered swing-trading indicator that maps 15-minute highs/lows, marks pre-market levels, and features a 15-minute Opening Range Breakout for clearer entries.

Essa - Market Structure Crystal Ball SystemEssa - Market Structure Crystal Ball V2.0
Ever wished you had a glimpse into the market's next move? Stop guessing and start anticipating with the Market Structure Crystal Ball!
This isn't just another indicator that tells you what has happened. This is a comprehensive analysis tool that learns from historical price action to forecast the most probable future structure. It combines advanced pattern recognition with essential trading concepts to give you a unique analytical edge.
Key Features
The Predictive Engine (The Crystal Ball)
This is the core of the indicator. It doesn't just identify market structure; it predicts it.
Know the Odds: Get a real-time probability score (%) for the next structural point: Higher High (HH), Higher Low (HL), Lower Low (LL), or Lower High (LH).
Advanced Analysis: The engine considers the pattern sequence, the speed (velocity) of the move, and its size to find the most accurate historical matches.
Dynamic Learning: The indicator constantly updates its analysis as new price data comes in.
The All-in-One Dashboard
Your command center for at-a-glance information. No need to clutter your screen!
Market Phase: Instantly know if the market is in a "🚀 Strong Uptrend," "📉 Steady Downtrend," or "↔️ Consolidation."
Live Probabilities: See the updated forecasts for HH, HL, LL, and LH in a clean, easy-to-read format.
Confidence Level: The dashboard tells you how confident the algorithm is in its current prediction (Low, Medium, or High).
🎯 Dynamic Prediction Zones
Turn probabilities into actionable price areas.
Visual Targets: Based on the highest probability outcome, the indicator draws a target zone on your chart where the next structure point is likely to form.
Context-Aware: These zones are calculated using recent volatility and average swing sizes, making them adaptive to the current market conditions.
🔍 Fair Value Gap (FVG) Detector
Automatically identify and track key price imbalances.
Price Magnets: FVGs are automatically detected and drawn, acting as potential targets for price.
Smart Tracking: The indicator tracks the status of each FVG (Fresh, Partially Filled, or Filled) and uses this data to refine its predictions.
🌍 Trading Session Analysis
Never lose track of key session levels again.
Visualize Sessions: See the Asia, London, and New York sessions highlighted with colored backgrounds.
Key Levels: Automatically plots the high and low of each session, which are often critical support and resistance levels.
Breakout Alerts: Get notified when price breaks a session high or low.
📈 Multi-Timeframe (MTF) Context
Understand the bigger picture by integrating higher timeframe analysis directly onto your chart.
BOS & MSS: Automatically identifies Breaks of Structure (trend continuation) and Market Structure Shifts (potential reversals) from up to two higher timeframes.
Trade with the Trend: Align your intraday trades with the dominant trend for higher probability setups.
⚙️ How It Works in Simple Terms
1️⃣ It Learns: The indicator first identifies all the past swing points (HH, HL, LL, LH) and analyzes their characteristics (speed, size, etc.).
2️⃣ It Finds a Match: It looks at the most recent price action and searches through hundreds of historical bars to find moments that were almost identical.
3️⃣ It Analyzes the Outcome: It checks what happened next in those similar historical scenarios.
4️⃣ It Predicts: Based on that historical data, it calculates the probability of each potential outcome and presents it to you.
🚀 How to Use This Indicator in Your Trading
Confirmation Tool: Use a high probability score (e.g., >60% for a HH) to confirm your own bullish analysis before entering a trade.
Finding High-Probability Zones: Use the Prediction Zones as potential areas to take profit, or as reversal zones to watch for entries in the opposite direction.
Gauging Market Sentiment: Check the "Market Phase" on the dashboard. Avoid forcing trades when the indicator shows "😴 Low Volatility."
Confluence is Key: This indicator is incredibly powerful when combined with your existing strategy. Use it alongside supply/demand zones, moving averages, or RSI for ultimate confirmation.
We hope this tool gives you a powerful new perspective on the market. Dive into the settings to customize it to your liking!
If you find this indicator helpful, please give it a Boost 👍 and leave a comment with your feedback below! Happy trading!
Disclaimer: All predictions are probabilistic and based on historical data. Past performance is not indicative of future results. Always use proper risk management.

Enhanced 4H Candle Countdown & High/Low IndicatorBy profitgang
This Pine Script indicator provides real-time tracking of 4-hour timeframe levels with an integrated countdown timer, designed to help traders monitor key support and resistance zones.
Key Features
📊 Visual Elements
4H High/Low Lines: Clear visualization of previous 4-hour candle high and low levels
Range Fill: Subtle background fill between high and low for better context
Mid-Level Line: Shows the middle point of the 4H range
Position Indicator: Visual cue showing current price position within the range
⏰ Countdown Timer
Real-time countdown to next 4H candle close
Customizable table position (9 different locations)
Adjustable text size (6 size options from Tiny to Huge)
Distance calculations showing percentage distance from key levels
🎯 Signal Generation
Long signals when price crosses above 4H low
Short signals when price crosses below 4H high
RSI confluence filter to reduce false signals
Background highlighting for active signals
TradingView alerts compatible
⚙️ Customization Options
Toggle all features on/off independently
Custom colors for all elements
Table positioning (top/middle/bottom + left/center/right)
Text size selection for optimal readability
Alert notifications for level breaks and updates
How It Works
The indicator fetches the previous 4-hour candle's high and low values and displays them as horizontal lines on your current timeframe chart. It continuously calculates the time remaining until the current 4H candle closes and presents this information in a clean, customizable table.
Use Cases
Swing Trading: Identify key 4H support and resistance levels
Intraday Trading: Monitor when new 4H levels will be established
Risk Management: Calculate distance from key levels for position sizing
Multi-timeframe Analysis: Combine with lower timeframe setups
Educational Purpose
This indicator is designed for educational and analytical purposes to help traders understand price action relative to higher timeframe levels. It provides clear visual feedback about market structure and timing.
Settings Groups
Display Settings: Toggle features, positioning, and sizing
Colors: Customize all visual elements
Signal Settings: Configure alert conditions and confluence filters
Compatibility
Works on all timeframes (recommended for 1m to 1H charts)
Compatible with all instruments
Includes proper alert functionality for automated notifications
Optimized for both light and dark themes
This indicator does not provide financial advice. Always conduct your own research and risk management before making trading decisions.
