I11L - Better Buy Low Volatility or High Volatility?This Pine Script code defines a TradingView strategy called "I11L - Better Buy Low Volatility or High Volatility?". The strategy aims to study the difference between buying when an asset's volatility is low and when it is high. It allows the user to select whether to buy during low or high volatility periods by changing the input variable mode.
Here's a brief explanation of the System:
The strategy is initialized with relevant settings such as overlay, pyramiding, default quantity type, initial capital, and others.
The mode input allows the user to choose between "Buy low Volatility" and "Buy high Volatility" options.
volatilityTargetRatio is the user-defined threshold to be used for making buy decisions. A value of 1 equals the average ATR (Average True Range) for the security. A lower value indicates lower volatility.
atrLength is the number of periods to calculate the ATR.
sellAfterNBarsLength sets the number of bars to hold the position before selling it.
The script calculates the ATR using the ta.atr() function, and then divides it by the closing price to normalize the value. It also calculates the simple moving average (SMA) of the normalized ATR over a period of 5 times the ATR length, and then computes the ratio between the normalized ATR and its average.
The script keeps track of the number of holding bars using the variable holdingBarsCounter. When there are open trades, the holding bars counter is incremented.
The decision to buy is made based on the selected mode and whether the computed ratio is above or below the user-defined threshold.
When the holding bars counter exceeds the user-defined limit, the position is closed.
The script plots the computed ratio with different colors based on the buy and close conditions. The ratio is plotted in green when a buy signal is triggered, red when a close signal is triggered, and white in all other cases. The value of 1 (the reference for the average ATR) is also plotted on the chart in white color.
This strategy helps traders study the difference between buying during low and high volatility periods and compare the performance of these conditions. It can be useful for analyzing the effectiveness of volatility-based trading strategies, such as entering positions when the market is calm or during periods of strong price movement.
Search in scripts for "low"

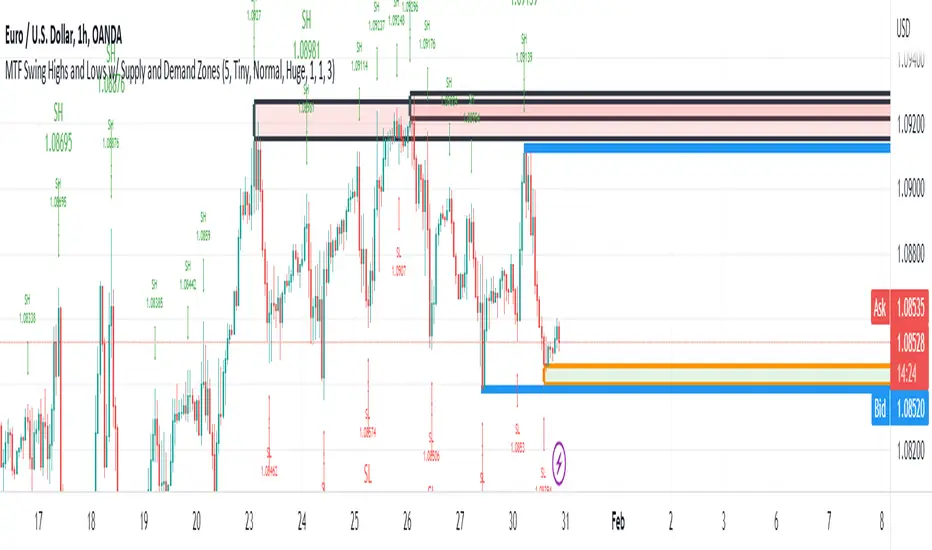
MTF Swing Highs and Lows w/ Supply and Demand ZonesI designed this indicator out of necessity for the Market structure/Price action trading strategy I use.
I thought I'd share. :)
For the fans of my Multi Timeframe Swing High and Low indicator, I have added Supply and Demand Zones!
The Supply and Demand Zones are based on the Swing Highs and Lows of my MTF Swing Highs and Lows Indicator.
The S/D Zones are created on the wicks of the Swing Highs and Lows.
You can choose whether to display the Chart, Higher and/or Highest timeframes as in the chart below.
You can also choose to display up to 3 S/D Zones from the past 3 Swing Highs and Lows.
The default setting is to display 1 chart timeframe S/D Zone, 2 higher and 3 highest, as I found this to be most effective without
cluttering the screen too much
The Chart Timeframe S/D Zones have an orange border, higher timeframe have a blue border and the highest have a black border.
Supply zones based on Swing Highs are red and Demand Zones based on Swing Lows are green.
This indicator displays Swing Highs and Lows on 3 timeframes based on the Chart timeframe, as follows:
Chart TF Higher TF Highest TF
1m 5m 15m
5m 15m 60m
15m 60m 240m
60m 240m Daily
240m Daily Weekly
Daily Weekly Monthly
You can change the font size of the labels as you'd prefer.
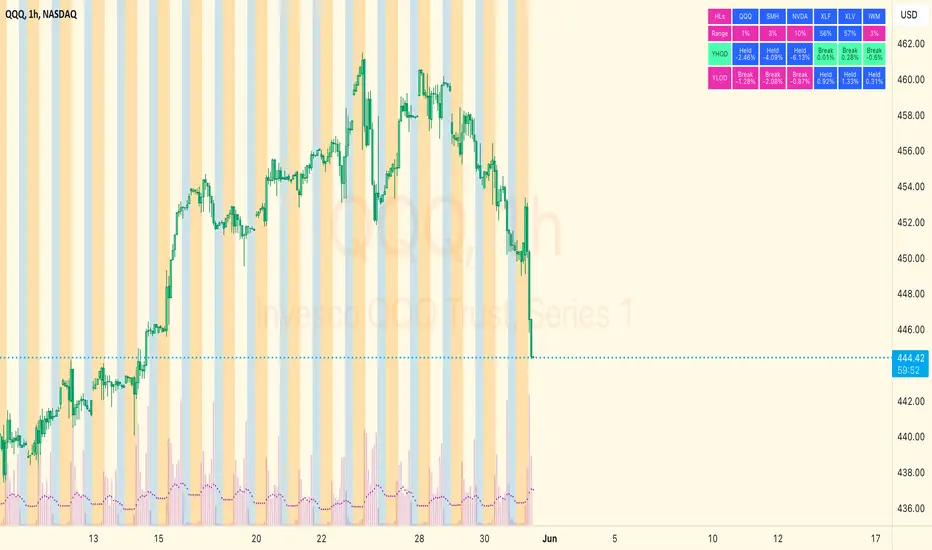
Symbols at Highs & LowsFor the chosen symbols (Defaults to XLV, XLF, IWM, QQQ), this displays a table that indicates (by color) if each symbol is at the high or low of day. When used with the main indexes, If all symbols are at highs or lows together, this can be a great indicator that a trend day is occurring in the market. You can customize the indicator to use up to 8 symbols of your choice. You can also customize the appearance so that it only displays an "All symbols are at the Lows/Highs" message. Finally, you can customize the % threshold to use when measuring how close to the high/low of day price needs to be in order to be considered "at high/low of day".
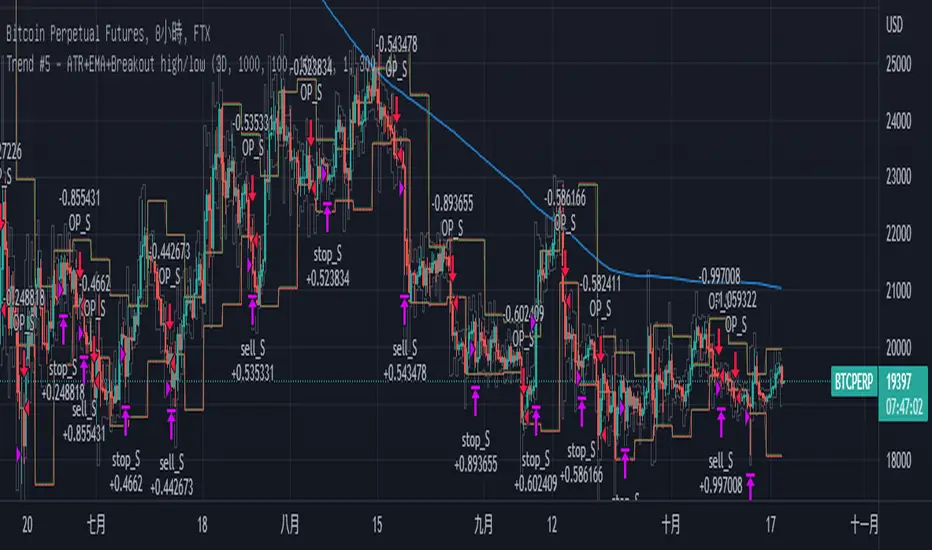
Trend Breakout high/low #1What is the Trend Breakout high/low #1?
This script uses the high/low of each fixed time period as a conditional judgment, and when the high/low is broken as a buy/sell signal, trying to capture a trend.
How to use this script?
Start date and Stop date: You can choose the date of the test.
Trading cycle: Selected time period is used as the basis for determining the high/low and is limited to one trade only.
Stop range: This value will calculate the stop loss range. Set 50-100 that is better
Fixed mode: Fixed of lots per transaction.
---Additional Functions---
Reversal mode: Reversing the buy and sell signals, may be useful in certain situations.
Wighted mode: Increased profitability under certain conditions
When win & When lose:Judgment when there is an ongoing loss/profit as a condition, may be useful in certain situations.
Use closing price: Use the closing price breakout high/low as a conditional judgment, but this function sometimes fails.
Notes:
Trading cycle and your chart time period can't be set too close,that will result repainting.
Stop range can't be set too small,that will result repainting either.
High/Low Historical Volatility Bands [Loxx]High/Low Historical Volatility Bands are constructed using:
Average as the middle line.
Upper and lower bands using the Historical Volatility high/low (instead of "regular" Historical Volatility) for bands calculation.
What is Historical Volatility?
Historical Volatility (HV) is a statistical measure of the dispersion of returns for a given security or market index over a given period of time. Generally, this measure is calculated by determining the average deviation from the average price of a financial instrument in the given time period. Using standard deviation is the most common, but not the only, way to calculate Historical Volatility .
The higher the Historical Volatility value, the riskier the security. However, that is not necessarily a bad result as risk works both ways - bullish and bearish , i.e: Historical Volatility is not a directional indicator and should not be used as other directional indicators are used. Use to to determine the rising and falling price change volatility .
SH is stock's High price in t day.
SL is stock's Low price in t day.
High/Low Return (xt^HL) is calculated as the natural logarithm of the ratio of a stock's High price to stock's Low price.
Return:
And Parkinson's number: 1 / (4 * math.log(2)) * 252 / n * Σ (n, t =1) {math.log(Ht/Lt)^2}
An important use of the Parkinson's number is the assessment of the distribution prices during the day as well as a better understanding of the market dynamics. Comparing the Parkinson's number and periodically sampled volatility helps traders understand the tendency towards mean reversion in the market as well as the distribution of stop-losses.
The color of the middle line, unlike the bands colors, has 3 colors. When colors of the bands are the same, then the middle line has the same color, otherwise it's white.
Included
Alerts
Signals
Loxx's Expanded Source Types
Bar coloring
Related indicators:
Parkinson's Historical Volatility Bands
Historical Volatility Bands

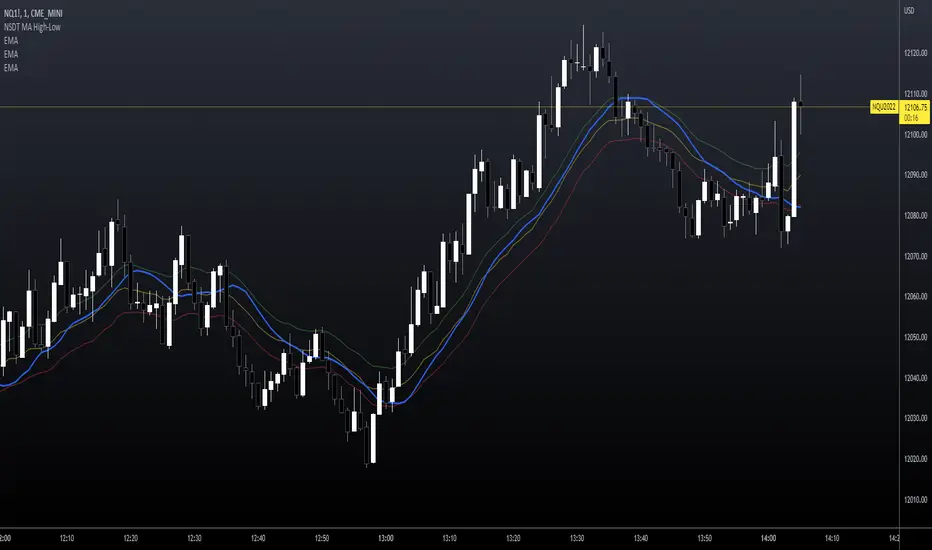
NSDT MA High-LowThis may seem like a pretty basic Moving Average indicator but I haven't seen one that changes the calculation point depending if the market is going up or down.
I've added three EMA's (length of 20) on this sample chart to demonstrate the differences. These are not included with the indicator.
Green, EMA calculated on High
Red, EMA calculated on Low
Yellow, EMA calculated on Close (default)
Blue, EMA calculated on HIGH when rising but on LOW when falling. (looks at 3 candles back to gauge direction)
* * * Note you can choose between 5 different Moving Average types
Notice how the Blue line (when going up it's calculated on the High) is catching up to the Green line (which is already calculated on the High)?
Notice how the Blue line (when going down so it's calculated on the Low) is catching up to the Red line (which is already calculated on the Low)?
This gives a faster response in the direction of the market because it switches between calculating on the High or Low based on market direction.
This script is free and open source.
Session High Low
This indicator shows Session High Low line and prices.
1: Session range is adjustable based on your timeframe. Nomore confusing timezone settings.
You can choose your timezone then set your Session start and end time.
Script will show you the following session high and low lines which is extendable until next session.
2: All historical lines and price levels are can be partially or fully hidden.
And line colors are adjustable so you can use suitable color on your chart.
Based on session you choose this script can be used as a session break strategy AKA (Asian session break, London session break strategy).
You can create your own trading Session and high lows.
Personally I monitor how price reacts on London session high lows during the NewYork trading session.
In this chart Session starts at 8am (London open) and closes at 12:30 (NewYork open). Script is showing high lows only in this session range.
Always double confirm with your trading style. It's not a Financial advice.
Inputs:
1: Hide history - Hides all historical lines and prices that means you can see only todays session.
2: Show price - Shows price level of session high lows. You can hide price level if you want to see only lines.
3: Session time - You can set your time range of session.
4: Start time - Session start time. You can see vertical line on your chart or you can hide line.
5: End time - Session end time. You can see vertical line on your chart or you can hide line.
6: Line extend time - End of the high low lines. You can draw line until the end of the session or you can draw short line.
7: All line and price colors are optional.
Thank you.

Swing High/Low Indicator w/ MACD and HTF EMA'sSwing High/Low Indicator w/ MACD and EMA Confirmations by KaizenTraderB
I designed this indicator to be used with a market structure break strategy.
It labels swing highs and lows that are confirmed by the MACD.
It also displays a higher timeframe Fast and Slow EMA to determine directional bias.
Also provides alerts that signal Swing Low breaks in downtrends and Swing High Breaks in uptrends.
It draws a horizontal line on the last Swing High and Low.
Display this indicator on your entry timeframe and choose your Higher Timeframe in settings.
You can also change lookback period for Swing Highs and Lows and EMA's.
When I use this I am looking for the Swing High/Low break in direction of HTF Trend
Then look for pullback between price level of break and areas of liquidity (wicks, order blocks, price congestion) for entry in direction of EMA trend.

MTF previous high and low quarter levelsDescription
An experimental script that prints quarter levels of the previous timeframe's high and low to the current timeframe. The idea is quite simple and is basically the Fibonacci pivoted on the previous high and low with quarter level settings (0,0.25,0.5,0.75,1 etc). The default setting is the previous daily high and low but can be customized on user discretion.
New quarter levels are printed after the close of the previous timeframe and open of the new timeframe (user's timeframe setting)
How To Use
Levels should not be used blindly. Levels can be used as confluence when aligned with high probability supply and demand zones, support, resistance, order blocks, and so on.
Credit to @HeWhoMustNotBeNamed for the Previous High/Low MTF indicator code and @mrbirman for the idea to put this together.

Auto Fibonacci From Previous High & Low w/ Percentages & AlertsAUTO FIBONACCI FROM PREVIOUS D/W/M/Q/Y HIGH & LOW WITH PERCENTAGES & ALERTS
This is an auto fibonacci level generating indicator that uses the high and low from the previous day, week, month, quarter or year. It also has a table with real time updates of how far away the nearest fibonacci levels are above and below the current price, represented in percentages. It includes alerts for each level as well if you want to be notified of price crossing fibonacci levels without watching the chart.
***HOW TO USE***
Fibonacci levels are also known as the golden ratio and are popular levels for traders to use as support and resistance levels. Expect price to bounce off of these levels regularly.
The previous high and low are marked as white lines. These are very important levels so make sure to pay attention when price reaches these lines.
Make sure to check out the higher timeframes for major levels.
Each fibonacci line retracement and extension up to the 3.272 level in each direction is displayed as red or green depending on whether price is above or below that level.
The retracement levels used are: previous high, .117, .236, .382, .5, .618, .786, .883, previous low, 1.272, 1.618, 2, 2.272, 2.618, 3 and 3.272.
The extension levels used are: .272, .618, 1, 1.272, 1.618, 2, 2.272, 2.618, 3 and 3.272.
In the indicator settings input tab you can quickly change the timeframe used, turn lines on/off, upper line colors, lower line colors, previous high and low line colors, line width, turn percentage table on/off, change the color of the percentage table and move the percentage table to a different location on the chart.
The indicator includes alerts for each fibonacci level as well, just set your fibonacci timeframe on your favorite ticker and turn on tradingview alerts for alert() calls.
***MARKETS***
This indicator can be used as a signal on all markets, including stocks, crypto, futures and forex.
***TIMEFRAMES***
This auto fibonacci indicator can be used on all timeframes.
***TIPS***
Try using numerous indicators of ours on your chart so you can instantly see the bullish or bearish trend of multiple indicators in real time without having to analyze the data. Some of our favorites are our Buy & Sell Pressure Colored Candles, Directional Movement Index + Fisher Transform, Volume Profile W/ Buy & Sell Pressure Labels, Auto Support And Resistance and Money Flow Index in combination with this Auto Fibonacci. They all have real time Bullish and Bearish labels or percentage gap info as well so you can immediately understand each indicator's trend and how far away major levels are in percentages.

Swing Pivots High LowBINANCE:BTCUSDT
This indicator is an opensource merge of the built in 'Pivot Points High Low' and the most popular 'Swing-high-low-support-resistance' indicators. The original 'Pivot Points High Low' does not have extensions with better visibility, while the most popular 'Swing-high-low-support-resistance' has no source available. I've also added additional configurable alert conditions for Pivot High and Low Crossover/Crossunder.
Please read the official documentation for further information about the indicator.

Strat Assistant Alerts and Highs/LowsStrat Assistant FTC Only
----------------------------
█ OVERVIEW
This script is intended to highlight/draw lines for the prior high/low of 30, 60, day, week, month, quarter, as well as create the alerts for when these thresholds get crossed
Input
----------
The script has inputs for every time frame plotted - 30, 60, day, week, month, quarter. All of the following items below can be "modified"
is the high line active? (for the corresponding time frame, will plot the line yes or no - by default only the DAY is displayed)
is the low line active? (for the corresponding time frame, will plot the line yes or no - by default only the DAY is displayed))
The high line color - modify the color of the corresponding time frame high line to your liking
The low line color - modify the color of the corresponding time frame low line to your liking
The time frame line width - make some lines wider than others for easier distinction
Output
----------
Lines for each corresponding time frame activated in the selected color and width.
Custom alerts - open a stock, select the Alerts button at the top, click the condition as the name of this script. The next drop down will show you all the corresponding alerts you can set for the current price crossing above the prior timelines high or below the prior timelines low (the bracket number is just for sorting purposes).
Best Practices
----------
What's not mapped? - Style (you can't drive this by an input, by default day is dashed, the rest are a solid line)
What's not mapped? - Price on the Y axis. I'm still trying to figure this out, not sure you can do it. I can add a label, just gets cluttered fast
Played with this a little bit using crypto, but obviously I can't test out all these alerts without a lot of things moving. Please do your due diligence.
I know a million people are going to want a million things. I can create more alerts coming soon, for now I wanted to start with this. Please and comments or suggestions or feedback and I'll see what I can do. I can create labels (for price) randomly, but it will clutter the screen. Or I can create one big box or table with prices shown.

Strongholds - Objective & Accurate Reference Points / StructuresVery early in my trading career, I came across Pivot Points only to find out that there are as many calculations as one pleases. It was hard to find out which ones work. Most of them probably did only out of randomness, so I ditched the strategy and looked for something else.
I previously used my Oracle Eye and Reference Points scripts but it is time for an upgrade.
Stronghold is a script I have used for quite some time now. I ditched daily and weekly closing prices as not that important. Instead, Strongholds are equipped with:
►Daily High & Low • Azure color
►Weekly High & Low • Dark blue
►Weekly old High & Low • Semi-transparent dark circles
►Monthly High & Low • Wizardly purple
There is an option to print:
►4h High & Low • Semi-transparent red
►VWAP • Lovely purple
►Weekly VWAP • Black
All of the levels and lines are set for 1m, 5m, 10m, 15m, 30m, 1h, 4h, 1D timeframes. If you use any alien timeframe, you may need to enter the code.
You can opt-in and out for certain timeframes. For example, daily levels are visible from 15m or 30, so the indicator won't draw them unless you want to. However, they will not be seen on higher timeframes as there is no reason to show them and oversaturate the chart with lines.
▬▬▬▬▬▬▬▬▬▬▬▬▬▬▬▬▬▬▬▬▬▬
Remember that if you use this script with auto-scale, you need to tick Scale Price Chart Only . Otherwise, your chart will fly to the moon!
Good luck & have fun!

ZLMA - Low-Lag Moving Average Based On An Alternative SMA DesignThere can be many ways to make a simple moving average, you can either sum the current and the n-1 previous data points and divide the result by n , or you can do it more efficiently by first taking the cumulative sum of your data points, and subtracting the current cumulative sum result with the cumulative sum results n bars ago, then divide the result by n . This can be described by the following formulas:
a(t) = a(t-1) + price(t)
b(t) = (a(t) - a(t-n))/n
This method is the one used in order to allow the user to use a series as SMA period, more info here:
Today we use this design in order to provide a pretty efficient low-lag moving average where the amount of lag of the moving average can be increased/decreased by the user.
THE INDICATOR
length control the period of the moving average, with larger value of length returning larger filtering amount. The lag setting in the other hand control the amount of lag of the moving average, with larger value of lag returning a moving average with less lag. The lag setting can't be lower than 1 or greater than 2, but values lower than 1 and greater than 0 would just return a moving average with larger filtering amount while values greater than 2 would create crazy wild overshoots.
In blue lag = 1.8, in red lag = 1.4, when lag = 1 the moving average is equal to a simple moving average of period length. Remember that larger values of lag will return greater over/undershoots.
Approximate amplitude response of the moving average, like all low-lag moving averages you can see frequencies amplified (the ones on the left greater than 1) .
SUMMARY
We proposed a low-lag moving average based on the cumulative/change SMA design where the lag of the moving average can be controlled by the user. There are tons of low-lag moving averages already, and they don't necessarily provide different results from each others, however this one is still relatively interesting as you can switch from a simple MA from a low-lagging one, other indicators are ready using this design and will be posted soon.

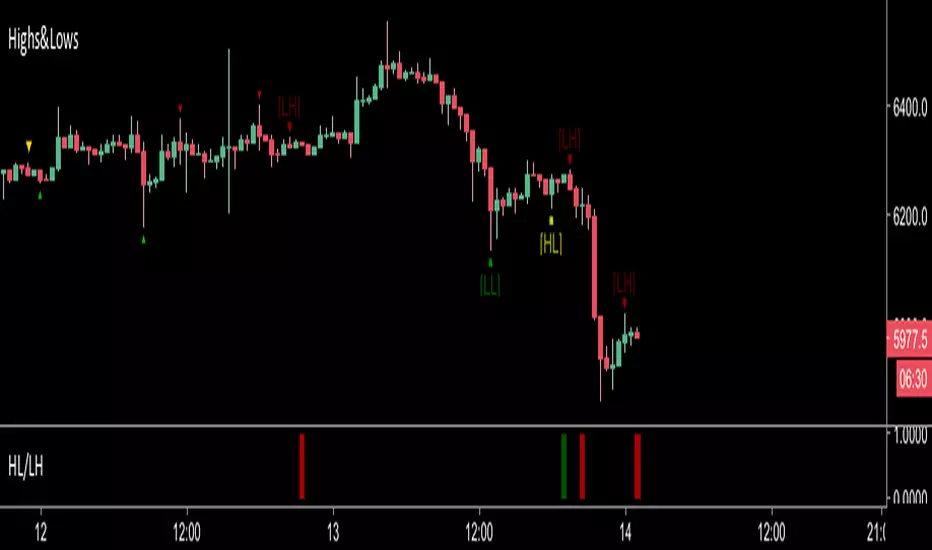
Highs&LowsShows Higher Highs, Higher Lows, Lower Lows & Lower Highs based off of Bill Williams fractals.
I use this mainly by shorting a break of the higher lows marked in yellow.
A long signal would be a candle close above a lower high (less reliable)
Alerts can be set with the secondary indicator below the chart.
Higher Lows / Lower Highs Alerts -https://www.tradingview.com/script/Ka1yXqRj-Higher-Lows-Lower-Highs-Alerts/
Code Plots - High, Low, Open, Close—Daily, Weekly, & Monthly!!!Custom Code Plots High, Low, Open, Close
Plots Today And/Or Previous Day
Daily, Weekly, & Monthly TimeFrames
Default Settings:
Green = High
Silver = Open
Fuchsia = Close
Red = Low
Current D-W-M = Circles as Plots
Previous D-W-M = Cross as Plots
By Default The Current Days High, Low, Open, Close Plots. There are Check boxes On The Inputs Tab To Turn All Options On And Off.
***Tip - For Intra-Day Trades…I Find It Useful To Plot Previous Days High, Low, Open, Close For Support/Resistance, & Breakout Levels. Plotting the Current Weekly and Monthly Levels Is Also Very Useful.
***If You Trade Daily Charts The Previous Months Levels Are Very Useful as Support/Resistance, & Breakout Levels….
Code For High, Low, Open, Close
pastebin.com
Video On Importing Custom Indicators from PasteBin:
videos.tradingview.com

Simple Market Structure Highs & Lows🟩 Simple Market Structure Highs & Lows
This indicator identifies basic swing highs and lows based on simple two-candle patterns, giving traders a clean visual view of short-term market structure shifts.
🔹 Logic
A Swing High (H) is marked when an up candle is followed by a down candle.
→ The high of the up candle (the first one) is plotted as a green triangle above the bar.
A Swing Low (L) is marked when a down candle is followed by an up candle.
→ The low of the down candle (the first one) is plotted as a red triangle below the bar.
🔹 Purpose
This tool helps visualize basic market turning points — useful for:
Spotting local tops and bottoms
Analyzing market structure changes
Identifying potential entry/exit zones
Building the foundation for BOS/CHoCH strategies
🔹 Notes
Works on any timeframe or asset.
No repainting — signals appear after the confirming candle closes.
Simple and lightweight — ideal for traders who prefer clean structure visualization.

Pivots High Low Live DetectionPivots High Low Live Detection
Identifies and visualizes swing highs and lows on the chart in real time.
Helps to observe evolving market structure by connecting confirmed or developing pivot points with lines and labels.
Using a configurable lookback, minimum deviation, and confirmation bar system, the indicator highlights new Higher Highs (HH), Higher Lows (HL), Lower Highs (LH), and Lower Lows (LL) as they form.
When “Live (repainting)” mode is enabled, the current swing leg updates dynamically with each candle, giving immediate feedback as price develops.
When disabled, only confirmed pivots are plotted, ideal for historical validation and backtesting.
+ Key Features
Detects and labels major swing points (HH, HL, LH, LL).
Works in live or confirmed (non-repainting) mode.
Adjustable parameters for lookback, deviation (in ticks), and confirmation bars.
Lightweight and compatible with any timeframe or symbol.
Includes runtime alerts for new structural pivots and direction shifts.
+ How to Use
Adjust the inputs under the “Pivots” group to control sensitivity.
Enable “Live (repainting)” to see developing swing legs, or disable it for confirmed structure only.
Use alerts to track structural changes or potential trend reversals.

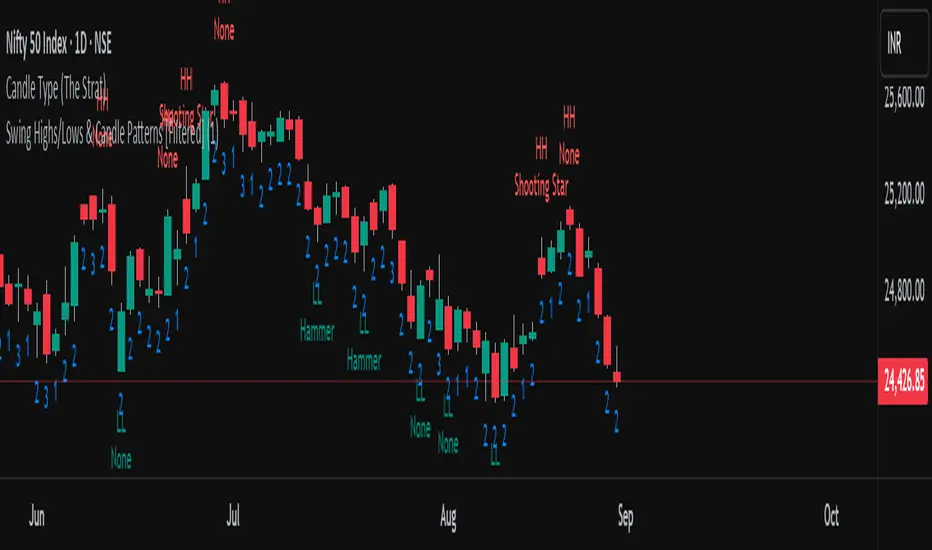
Swing Highs/Lows & Candle Patterns[LuxAlgo] [Filtered]Swing Highs/Lows & Candle Patterns - Tweaked Version
This indicator is a customized and enhanced version of LuxAlgo’s original Swing Highs/Lows & Candle Patterns indicator. It identifies and labels critical swing high and swing low points to help visualize market structure, alongside detecting key reversal candlestick patterns such as Hammer, Inverted Hammer, Bullish Engulfing, Hanging Man, Shooting Star, and Bearish Engulfing.
With added options to selectively display only Lower Highs (LH) and Higher Lows (HL), this tweaked version offers greater flexibility for traders focusing on specific market dynamics. Users can also customize the lookback length and label styling to fit their preferences.
Credit to LuxAlgo for the original concept and foundation of this powerful tool, which this script builds upon to support more tailored technical analysis. Ideal for swing traders and technical analysts seeking improved entry and exit signals through a combination of price swings and candlestick pattern recognition.
Price Heat Meter [ChartPrime]⯁ OVERVIEW
Price Heat Meter visualizes where price sits inside its recent range and turns that into an intuitive “temperature” read. Using rolling extremes, candles fade from ❄️ aqua (cold) near the lower bound to 🔥 red (hot) near the upper bound. The tool also trails recent extreme levels, tags unusually persistent extremes with a % “heat” label, and shows a bottom gauge (0–100%) with a live arrow so you can read market heat at a glance.
⯁ KEY FEATURES
Rolling Heat Map (0–100%):
The script measures where the close sits between the current Lowest Low and Highest High over the chosen Length (default 50).
Candles use a two-stage gradient: aqua → yellow (0–50%), then yellow → red (50–100%). This makes “how stretched are we?” instantly visible.
Dynamic Extremes with Time Decay:
When a new rolling High or Low is set, the script starts a faint horizontal trail at that price. Each bar that passes without a new extreme increases a counter; the line’s color gradually fades over time and fully disappears after ~100 bars, keeping the chart clean.
Persistent-Extreme Tags (Reversal Hints):
If an extreme persists for 40 bars (i.e., price hasn’t reclaimed or surpassed it), the tool stamps the original extreme pivot with its recorded Heat% at the moment the extreme formed.
• Upper extremes print a red % label (possible exhaustion/resistance context).
• Lower extremes print an aqua % label (possible exhaustion/support context).
Bottom Heat Gauge (0–100% Scale):
A compact, gradient bar renders at the bottom center showing the current Heat% with an arrow/label. ❄️ anchors the left (0%), 🔥 anchors the right (100%). The arrow adopts the same candle heat color for consistency.
Minimal Inputs, Clear Theme:
• Length (lookback window for H/L)
• Heat Color set (Cold / Mid / Hot)
The defaults give a balanced, legible gradient on most assets/timeframes.
Signal Hygiene by Design:
The meter doesn’t “call” reversals. Instead, it contextualizes price within its range and highlights the aging of extremes. That keeps it robust across regimes and assets, and ideal as a confluence layer with your existing triggers.
⯁ HOW IT WORKS (UNDER THE HOOD)
Range Model:
H = Highest(High, Length), L = Lowest(Low, Length). Heat% = 100 × (Close − L) / (H − L).
Extreme Tracking & Fade:
When High == H , we record/update the current upper extreme; same for Low == L on the lower side. If the extreme doesn’t change on the next bar, a counter increments and the plotted line’s opacity shifts along a 0→100 fade scale (visual decay).
40-Bar Persistence Labels:
On the bar after the extreme forms, the code stores the bar_index and the contemporaneous Heat% . If the extreme survives 40 bars, it places a % label at the original pivot price and index—flagging levels that were meaningfully “tested by time.”
Unified Color Logic:
Both candles and the gauge use the same two-stage gradient (Cold→Mid, then Mid→Hot), so your eye reads “heat” consistently across all elements.
⯁ USAGE
Treat >80% as “hot” and <20% as “cold” context; combine with your trigger (e.g., structure, OB, div, breakouts) instead of acting on heat alone.
Watch persistent extreme labels (40-bar marks) as reference zones for reaction or liquidity grabs.
Use the fading extreme lines as a memory map of where price last stretched—levels that slowly matter less as they decay.
Tighten Length for intraday sensitivity or increase it for swing stability.
⯁ WHY IT’S UNIQUE
Rather than another oscillator, Price Heat Meter translates simple market geometry (rolling extremes) into a readable temperature layer with time-aware extremes and a synchronized gauge . You get a continuously updated sense of stretch, persistence, and potential reversal context—without clutter or overfitting.

Script_Algo - High Low Range MA Crossover Strategy🎯 Core Concept
This strategy uses modified moving averages crossover, built on maximum and minimum prices, to determine entry and exit points in the market. A key advantage of this strategy is that it avoids most false signals in trendless conditions, which is characteristic of traditional moving average crossover strategies. This makes it possible to improve the risk/reward ratio and, consequently, the strategy's profitability.
📊 How the Strategy Works
Main Mechanism
The strategy builds 4 moving averages:
Two senior MAs (on high and low) with a longer period
Two junior MAs (on high and low) with a shorter period
Buy signal 🟢: when the junior MA of lows crosses above the senior MA of highs
Sell signal 🔴: when the junior MA of highs crosses below the senior MA of lows
As seen on the chart, it was potentially possible to make 9X on the WIFUSDT cryptocurrency pair in just a year and a half. However, be careful—such results may not necessarily be repeated in the future.
Special Feature
Position closing priority ❗: if an opposite signal arrives while a position is open, the strategy first closes the current position and only then opens a new one
⚙️ Indicator Settings
Available Moving Average Types
EMA - Exponential MA
SMA - Simple MA
SSMA - Smoothed MA
WMA - Weighted MA
VWMA - Volume Weighted MA
RMA - Adaptive MA
DEMA - Double EMA
TEMA - Triple EMA
Adjustable Parameters
Senior MA Length - period for long-term moving averages
Junior MA Length - period for short-term moving averages
✅ Advantages of the Strategy
🛡️ False Signal Protection - using two pairs of modified MAs reduces the number of false entries
🔄 Configuration Flexibility - ability to choose MA type and calculation periods
⚡ Automatic Switching - the strategy automatically closes the current position when receiving an opposite signal
📈 Visual Clarity - all MAs are displayed on the chart in different colors
⚠️ Disadvantages and Risks
📉 Signal Lag - like all MA-based strategies, it may provide delayed signals during sharp movements
🔁 Frequent Switching - in sideways markets, it may lead to multiple consecutive position openings/closings
📊 Requires Optimization - optimal parameters need to be selected for different instruments and timeframes
💡 Usage Recommendations
Backtest - test the strategy's performance on historical data
Optimize Parameters - select MA periods suitable for the specific trading instrument
Use Filters - add additional filters to confirm signals
Manage Risks - always use stop-loss and take-profit orders.
You can safely connect to the exchange via webhook and enjoy trading.
Good luck and profits to everyone!!

All-Time High/Low Levels with Dynamic Price Zones📈 All-Time High/Low Levels with Dynamic Price Zones — AlertBlake
🧠 Overview:
This powerful indicator automatically identifies and draws the All-Time High (AT.H) and All-Time Low (AT.L) on your chart, providing a clear visual framework for price action analysis. It also calculates and displays the Midpoint (50%), Upper Quartile (75%), and Lower Quartile (25%) levels, creating a dynamic grid that helps traders pinpoint key psychological levels, support/resistance zones, and potential breakout or reversal areas.
✨ Features:
Auto-Detection of All-Time High and Low:
Tracks the highest and lowest prices in the full visible historical range of the chart.
Automatically updates as new highs or lows are created.
Dynamic Level Calculation:
Midpoint (50%): Halfway between AT.H and AT.L.
25% Level: 25% between AT.L and AT.H.
75% Level: 75% between AT.L and AT.H.
Each level is clearly labeled with its corresponding value.
Labels are positioned to the right of the price for easy reading.
Color-Coded Lines (customizable)
