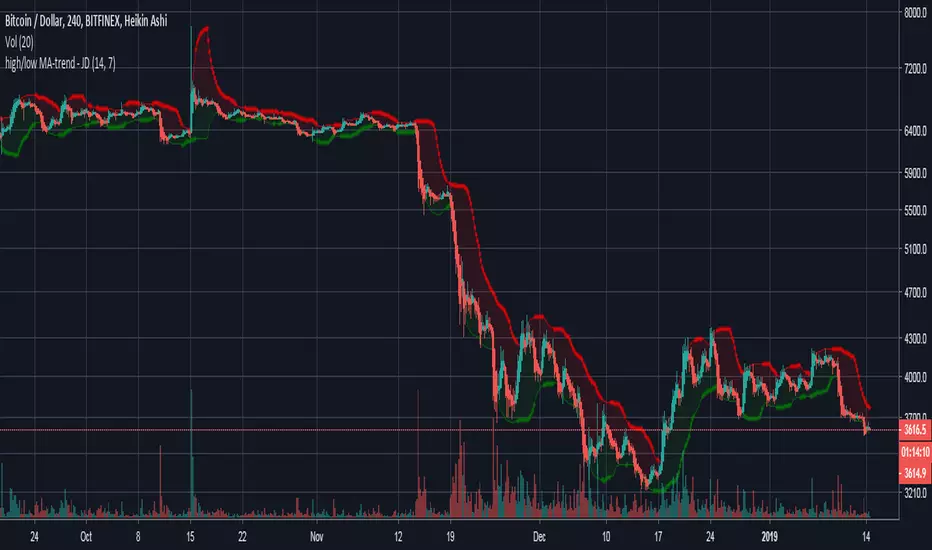
high/low MA-trend - JDShort script for trend indication taking a moving average of the highs and the lows seperately.
Lookback period for the highs/lows can be altered.
Ema length can be altered.
JD.
Search in scripts for "low"
[M]HLC PlotsHLC Plots
Draws points (lines) to high low and close. In some trading situations, this method is more convenient than candles or bars.
--------------------------------------
Рисует точки(линии) по high low и close. В некоторых ситуациях торговли такой способ бывает удобней, чем свечи или бары. На вкус и цвет все фломастеры разные =)

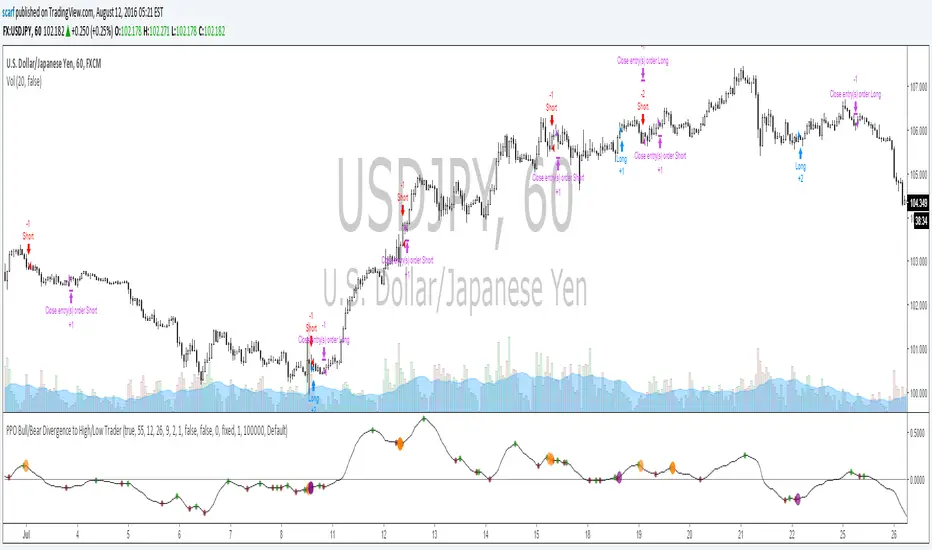
PPO Bull/Bear Divergence to High/Low StrategyA simple strategy that uses the PPO divergences to open trades and the highs/lows to close them. Credit to Pekipek for this PPO Divergence indicator (I changed the visuals a bit)
STRATEGY
Purple circle - bullish divergence - enter LONG
Orange circle - bearish divergence - enter SHORT
Green dot - high point - exit LONG
Red dot - low point - exit SHORT
That's it. Not very profitable, but I like Pekipek's indicator a lot so figured I'd see what a strategy was like. Would love to see any variations.
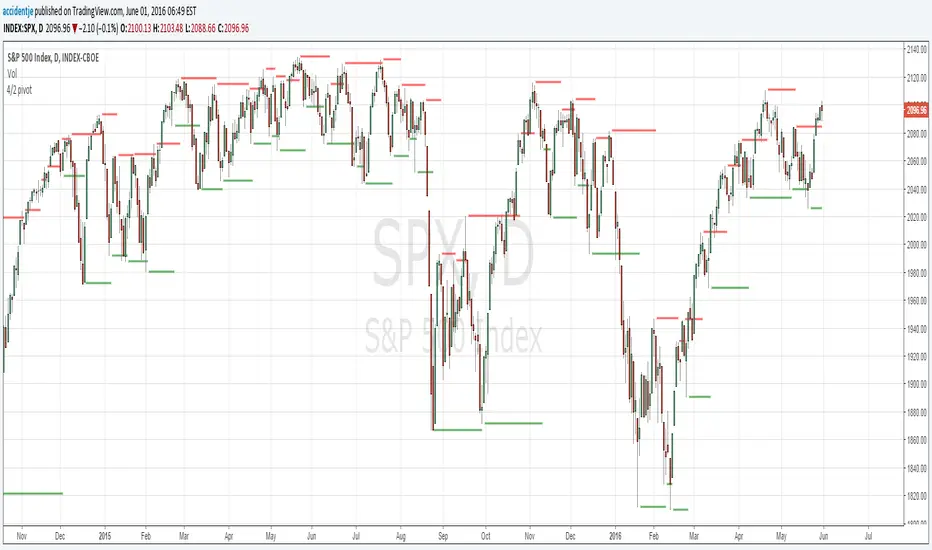
4/2 pivot levelsPlots...
Confirmed highs when 1. it's higher than the 4 prior (lower) highs AND 2. higher than the 2 following (lower) highs.
Confirmed lows when 1. it's lower than the 4 prior (higher) lows AND 2. lower than the 2 following (higher) lows.
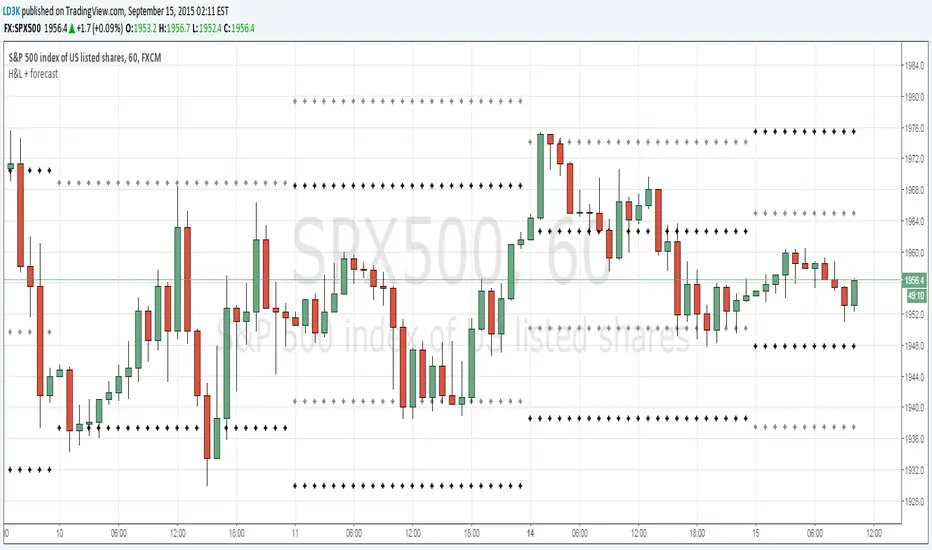
Previous H/Ls and Forecast H/LPlots the previous periods High and Lows (black crosses) and forecasts the next day's High and Lows (gray crosses)
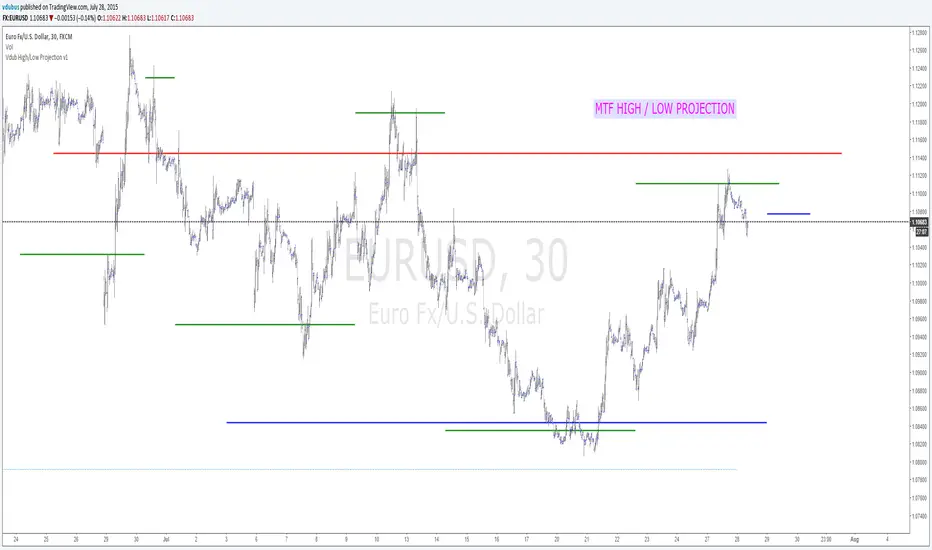
Vdub High/Low Projection v1Vdub High/Low Projection v1
Modified London Underground /
3 x MTF High/Low / projected targets Hourly, Daily, Weekly
RSI Stochastic Extreme Combo alertThis script will give you red or green columns as an indication for oversold/overbought based upon the rsi and stochastic both being at extreme levels (you set). The default oversold is at 35. If Stochastic and RSI fall below 35, you will get a green column (Both indicators at the extreme). Play with your levels to see how your stock reacts. RSI and Stochastic can both be changed along with each of the levels you would like the color change. I have set mine at RSI low: 37, RSI high: 63, Stoch low: 10, and Stoch high: 90. These levels have been working well for me on AAPL. Enjoy and don't forget to leave a comment if it helps your trading or you have other ideas about what is working for you.

Daily Weekly Monthly Highs & Lows + 50% Retracement (No Labels)previous day, week, month high and low
50% retracement on weekly and daily
First Candle High-Low (ORB Style)This indicator will
✅ Detect the first candle of each day (on any intraday timeframe),
✅ Draw two horizontal lines — one at the high and one at the low of that first candle, and
✅ Extend those lines across all candles of that same day.

Pivot Points High Low (%-Auslenkung)Marks swing highs and lows only when the price deviation between opposite pivots exceeds a user-defined percentage threshold.


Previous Week High & Low Flat Trendlines + Labels on Current weeks lower time frames which display Previous Week High & Low
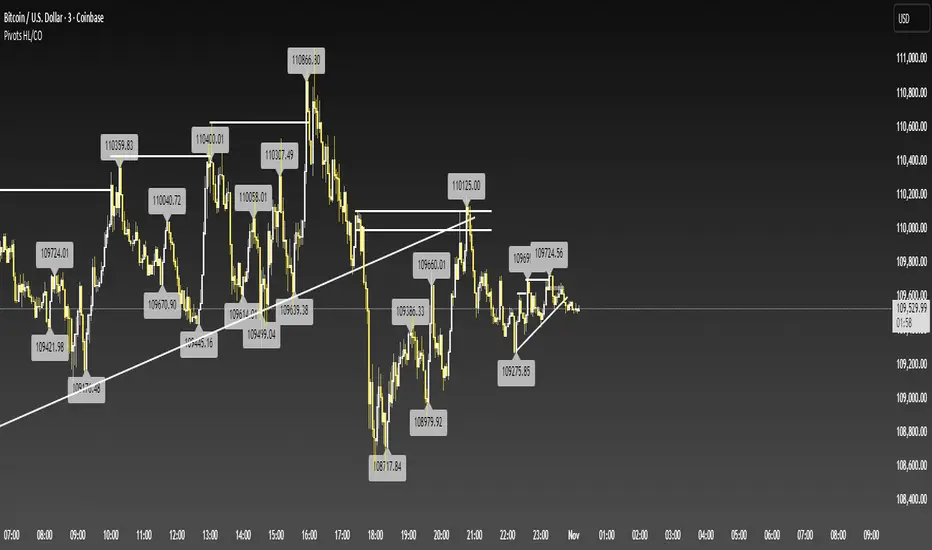
Pivot Points High Low or Close OpenStandard Pivot High Low from tradingview but you can use input close open so it uses the body instead of the wicks.
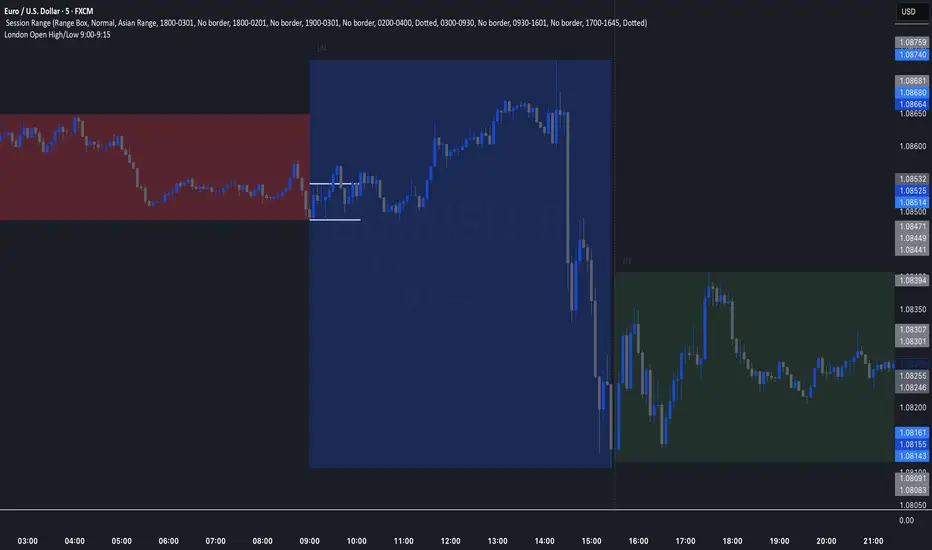
Session Highs and LowsShows the current and previous session highs and lows for the New York, London and Asian sessions

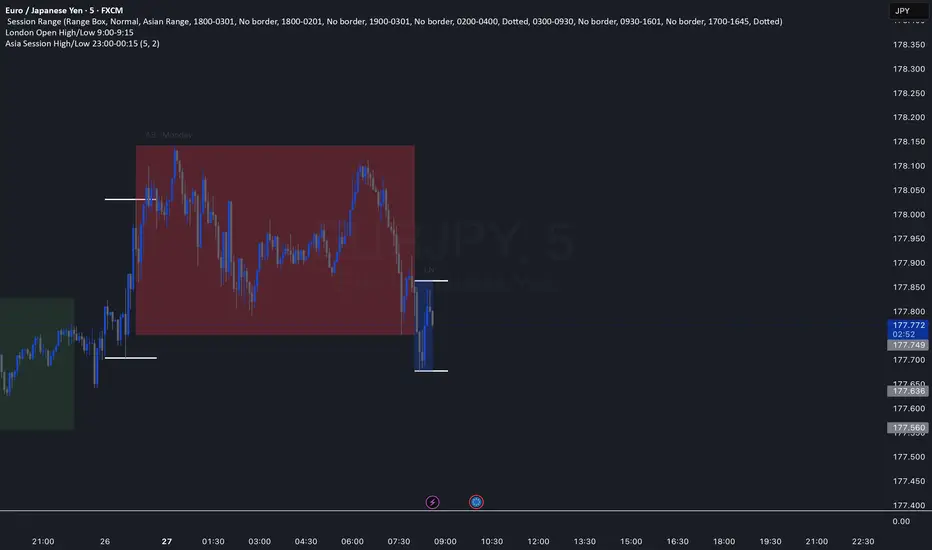
Asia Session High/Low 23:00-00:15This indicator shows highs and lows 1 hour before Asia session and the first 15min of Asia session.
NY Midnight High/Low Arrows (Auto-Show)🇺🇸 English Explanation
This indicator automatically marks the daily high and low of the New York session.
It draws arrows (▼▲) at the highest and lowest prices after New York midnight (00:00),
and can optionally display small horizontal dotted lines at those levels.
It helps traders identify daily liquidity zones and key turning points in price action.
🇸🇦 الشرح بالعربية
هذا المؤشر يحدد القمة والقاع اليومية لجلسة نيويورك بشكل تلقائي.
يرسم أسهماً (▼▲) عند أعلى وأدنى سعر بعد منتصف الليل بتوقيت نيويورك (00:00)،
ويمكنه أيضًا عرض خطوط أفقية منقطة صغيرة عند تلك المستويات.
يساعد المتداول في معرفة مناطق السيولة اليومية ونقاط الانعكاس المهمة في حركة السعر.

Previous Period High/Low LevelsThis indicator plots the previous day, week, and month high and low levels to highlight key liquidity levels.
Perfect for traders using market structure, liquidity, or SMC concepts.
Features:
Auto-plots PDH/PDL, PWH/PWL, and PMH/PML
Adjustable line styles, widths, and label sizes
Toggle price display on or off
Accurate UTC offset handling

London Open High/Low 9:00-9:15indicator marks out high and low of the first 15 minutes of the London session.
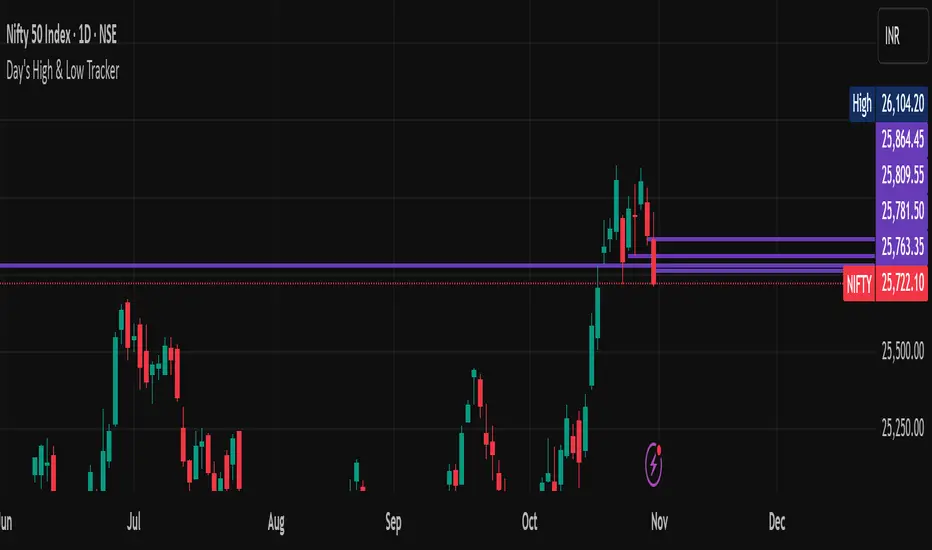
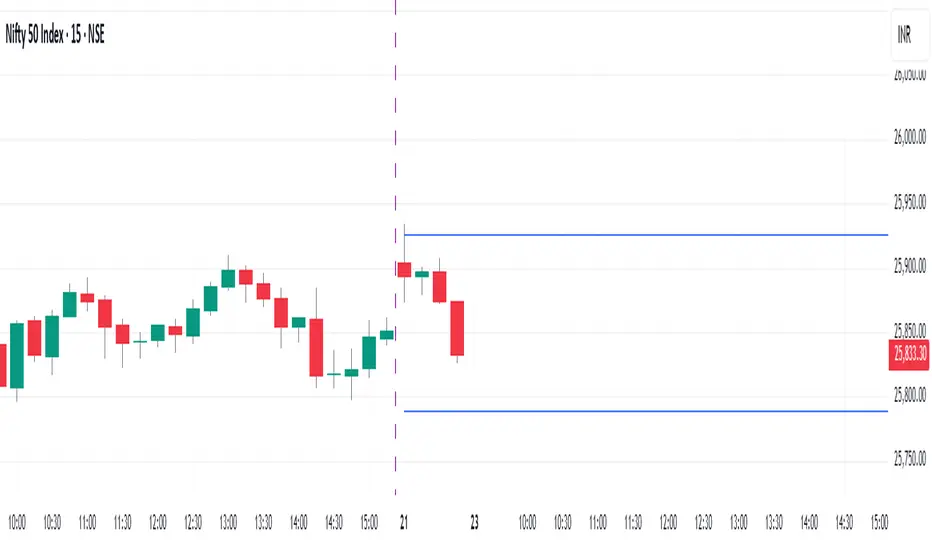
Previous day high lowThis script Identifies and draw Previous day High low on 15 min Intra day chart
Daily Close Cross Above SMA 20 (Low)Daily closing price crosses above SMA 20 low, signals a bullish trend.

Previous Day High-LowIt will show Previous Day High-Low. This will create two horizontal lines automatically updated each day, marking yesterday’s high and low levels clearly on any intraday chart.