Search in scripts for "low"

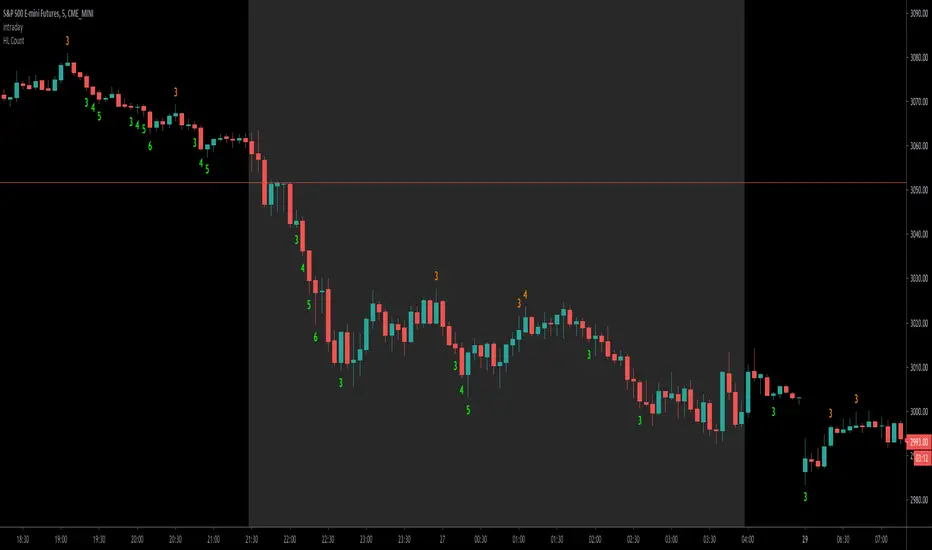
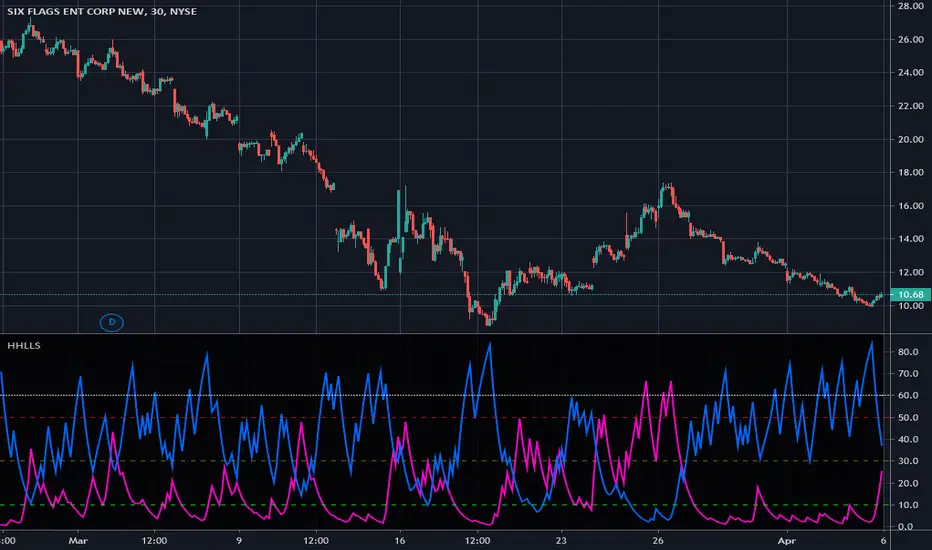
Higher High and Lower Low Bar CountThe importance of counting HH&LL is to find the possible extreme of the current leg and the potential reversal.
This script helps you count the number of bars which are constantly higher or lower than the previous ones.
I set the script to count from the first one, but only display the number from the third, in order to eliminate too much noise.
Note : I have loosened the criteria of HH and LL.
Let's take "higher high" as an example, I will count the number If the current bar's low is higher than the previous one's and its high is higher or equal to the previous one's , and vice versa.
If you prefer the strict definition of HH or LL, you can modify the code as you wish.
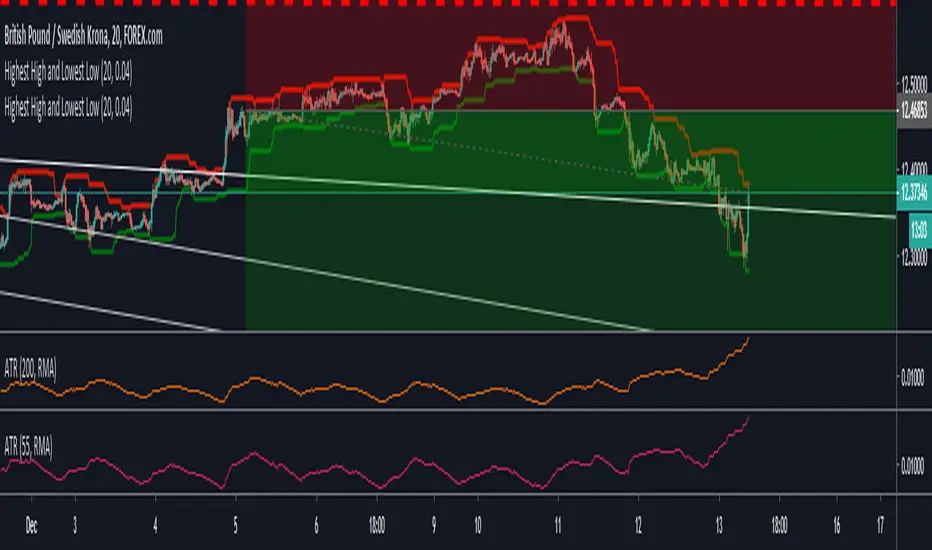
EMA of Highs/Lows with 3 day lookback colour change, by CanUK101Forms a key part of a trend following trading system.
Shows a channel formed by 2 EMA lines that use the highs and lows as inputs.
The 3 day look-back changes the colour of the line to denote rising and falling EMA .

High-Low BandsThis is a simple but powerful indicator. It calculates (selectable) moving averages separately from high , low and close .
It can be used as support-resistance, trend or volatility indicator.

Show ATR and 1st hour high+low1. Shows TR at daily bars
2. Shows ATR lines intraday: 100% and 75% (customizable)
3. Shows hint with ATR for current day and percent passed
4. Show high and low of the 1st hour

Major Event Price Indicators (Coronavirus Lows)This very simple script adds a corridor for two low price ranges, where Corona started to hit. Useful to visualize where a stock currently trades at, relative to the Corona / Covid-19 crisis.
Can easily be adjusted for different dates regarding any major events, crashes. Useful when you run out of Alarms and just want to see "is that still below or above where it was before ?".
Add as many dates as you want, just alter the names of each indicator.
Built upon the script of vitvlkv.

Higher Highs & Lower Lows Stochastics - Vitali ApirineThis is my modified "Higher Highs & Lower Lows Stochastics" employing PSv4.0, originally formulated by Vitali Apirine for TASC - February 2016 Traders Tips. Reading through a TASC magazine of mine, behold, I found a little known indicator that I can't find anywhere on all of Tradingview. That was a tragedy I felt I had to resolve... This indicator is best described as a dual momentum indicator, being helpful with anticipating reversals, spotting emerging trends, and defining correction periods. I felt it worthy of justice to unveil this for all TV members to utilize and also learn from. It's uniqueness is beyond past due for the honor it deserves on Tradingview.
As always, I have included advanced Pine programming techniques that conform to proper "Pine Etiquette". For those of you who are newcomers to Pine Script, this code release may also help you comprehend the "Power of Pine" by employing advanced programming techniques while exhibiting code utilization in a most effective manner. This script's uniqueness displays that we can now override built-in Pine functions. Firstly, you may have noticed that I replaced ema(), sma(), highest(), and lowest(). If you weren't aware of this Pine capability, well, here is a prime example... Now you know! Just heed caution when doing so to ensure your replacement algorithms are 100% sound. Lastly, I also added an additional "Median" line where the companion stochastics seemingly appear to gravitate within a central zone.
NOTICE: You may have observed, there is highest(), lowest(), ema(), and sma() custom functions overwriting Pine built-ins, some of which are audaciously used in ternary. "IF" you are planning to use Pine Script v4.0 functions in ternary, be forewarned, they WILL NOT operate as expected in most scenarios. The reason why I legitimately used them here in ternary is because they are ONLY manually controlled by an input(). If these were dynamically controlled with bar-to-bar dynamic conditional logic, you would most certainly run into serious unexpected programming issues, potentially resulting in hours of frustrations and guaranteed loss of hair. That's my lesson for this release, so never ever forget this when utilizing the full potential of the "Power of Pine". For more information concerning these potential dilemmas, please consult "Execution of Pine functions and historical context inside function blocks" in the "Pine Script v4 User Manual".
Features List Includes:
Dark Background - Easily disabled in indicator Settings->Style for "Light" charts or with Pine commenting
AND much, much more... You have the source!
The comments section below is solely just for commenting and other remarks, ideas, compliments, etc... regarding only this indicator, not others. When available time provides itself, I will consider your inquiries, thoughts, and concepts presented below in the comments section, should you have any questions or comments regarding this indicator. When my indicators achieve more prevalent use by TV members, I may implement more ideas when they present themselves as worthy additions. As always, "Like" it if you simply just like it with a proper thumbs up, and also return to my scripts list occasionally for additional postings. Have a profitable future everyone!
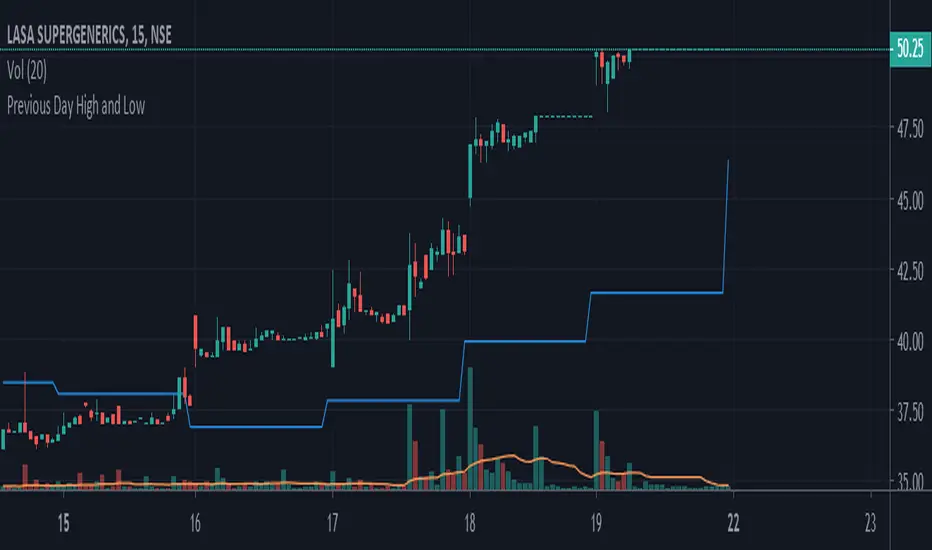
Previous Week high & lowIt indicates the previous week high and low.
When overlaid on the daily chart, it give buy and sell signals (in the understanding you have made a trade setup). Buy when the price crosses the previous week high, sell when it crosses the previous week low.

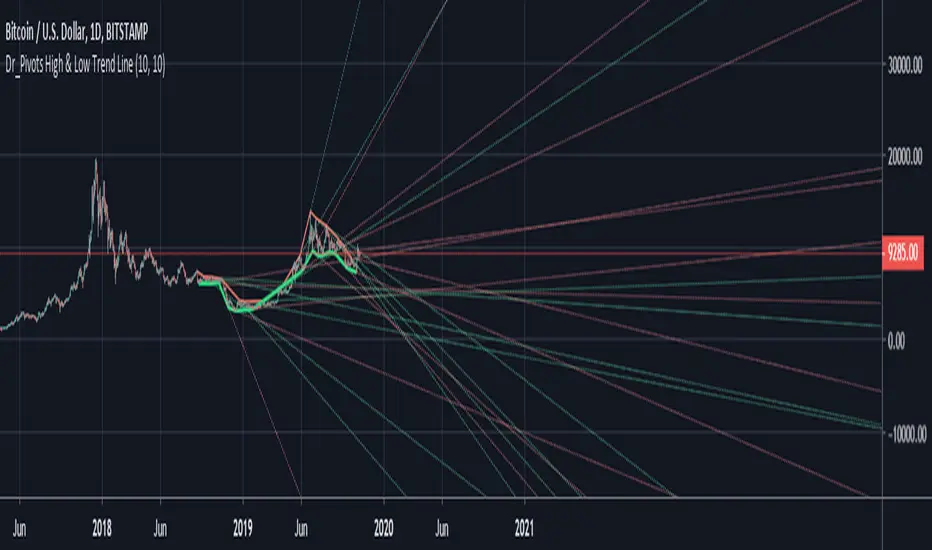
Yearly OHLplots Yearly Open, High, Low levels
Interesting interactions to note at previous yearly opens

New Low/High DetectorDemonstrates the detection of new lows/highs within an amount of bars (when above an amplitude threshold)

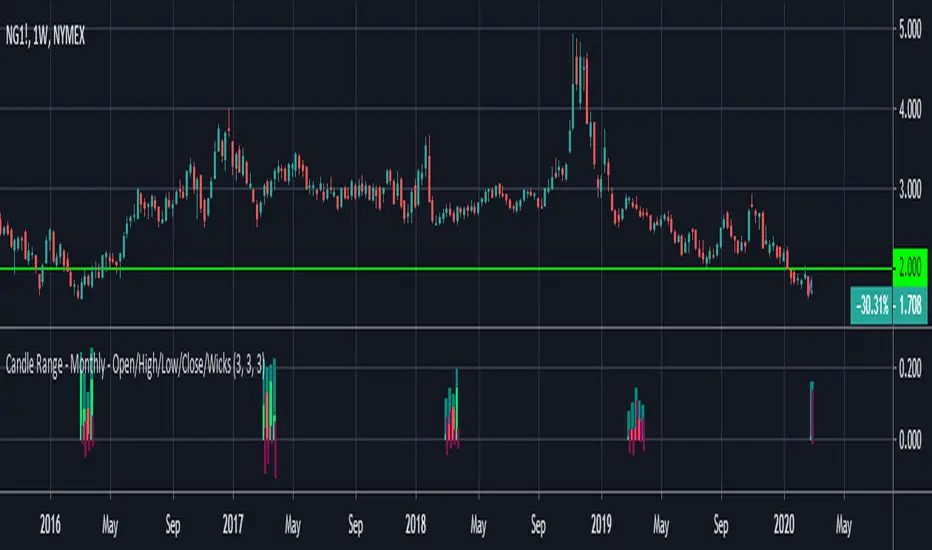
Candle Range - Monthly - Open/High/Low/Close/Wicks (Oldinvestor)This candle range comparison is similar to my original script Candle Range Compare .
This script is to compares the size of open/close high/low and wick size side by side. This version of the script allows you to only show a chosen month of each year to compare. I hadn't even thought to try and vanish the part of the chart I'm not looking at. I'll consider that later (may never happen, I am limited on time).
I have also included check boxes to turn on/off certain candles. This part is pretty self explanatory. For example: if you wish to not see wicks in front of the open/close, go to the settings for the study and uncheck the box for "Show Wicks".
Warning: The script does not work so well on monthly candles? Some of the candles are missing...
Good luck
Oldinvestor

Custom Time ranges. Daily price ranges.Addition to previous time range script, now containing daily ranges. You can select a day of the week, and have it show the high, low, mid, and open of that day.
For the time bands:
Monday = 2
Tuesday = 3
Wednesday = 4
Thursday = 5
Friday = 6
Saturday = 7
Sunday = 1
Example 1:
1500-1800:2
This will colour the background between 3pm and 6pm on Mondays.
Example 2:
0000-0600:247
This will colour the background between midnight and 6am on Mondays, Wednesdays, and Saturdays.
For the Daily price ranges:
Just select the tick-box forthe day, and then the price levels you'd like to see.
I want to add specific weekly levels to this, for example: week 06 of year 2020, but I've not figured out how to do it yet. If anyone knows, I'd appreciate it if you let me know. I'll then update this script.
As always, any questions you may have, please leave in comments below and I'll respond when I have time.
If you notice anything good with this indicator, let me know. We are all in this to make money after all! ;)

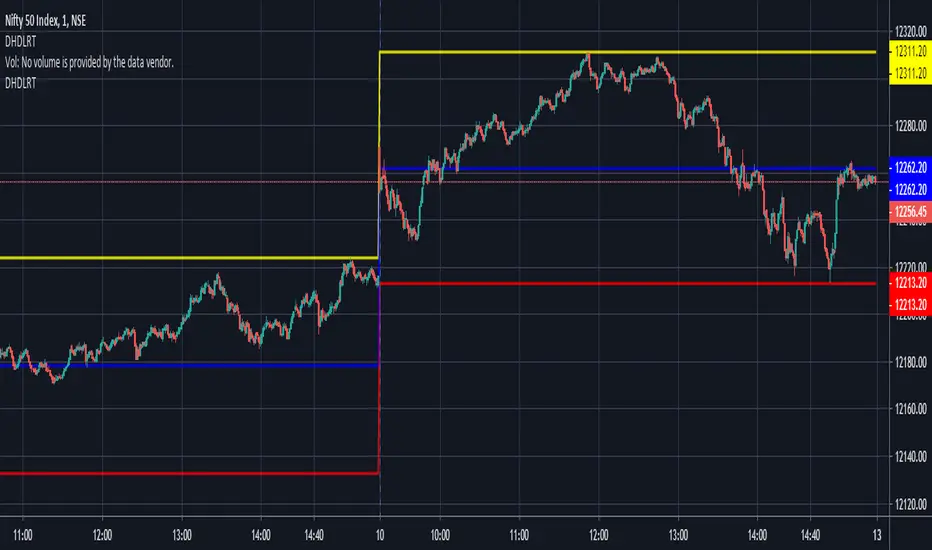
Monthly/Weekly/Daily/High-LowsThis indicator provides the drawings Monthly, before last week, last week, and last day high and low's

CCI Low/High DivergencesThis CCI Divergences indicator uses the candle low values to find bullish divergences and candle high values to find bearish divergences.

4h and 1h High/LowThis is a simple script to easily view the High and Low of previous 4h and 1h candles on lower timeframes.

Intraday High Low & RetracementThis script is specifically designed to plot intraday high and intraday low on the chart. This also plots a retracement level which is found at the mod of daily high and low.
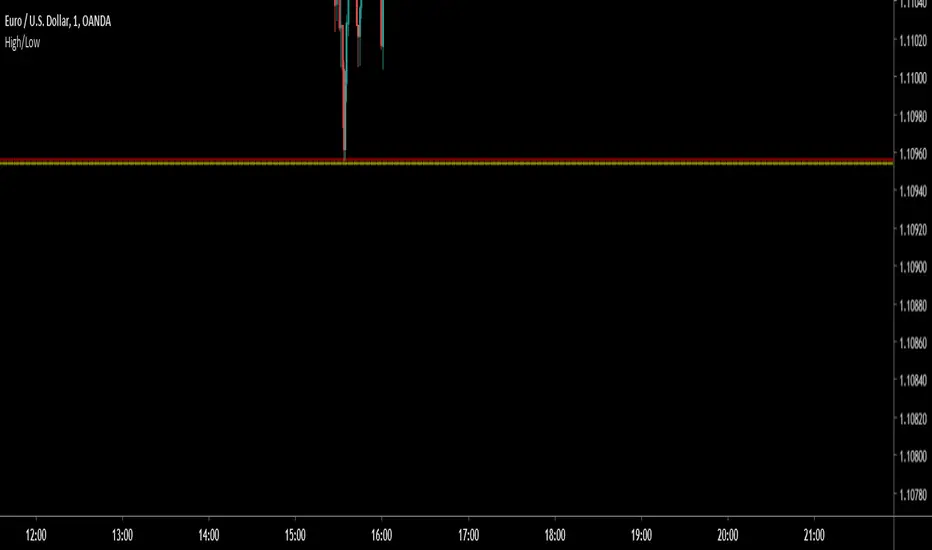
Premarket High/LowThe script draws the high and low of the premarket session and based on these levels the ATR is added and also displayed on the chart as lines.
You can change:
- The Session Timeframe
- The ATR Multiple
- If the Aftermarket Session should be included

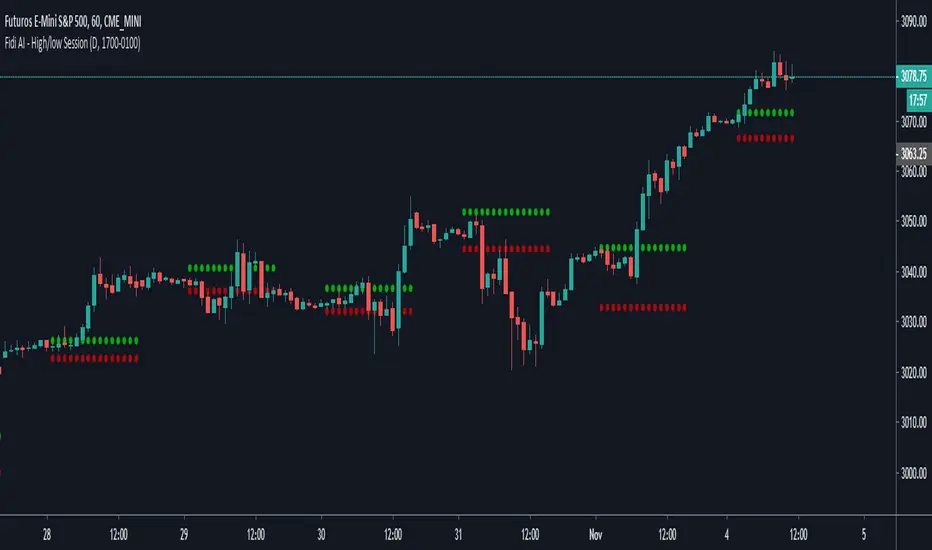
Fide AI - High/low SessionDraw the high and low of the specific session until the start the session again.