Search in scripts for "macd"

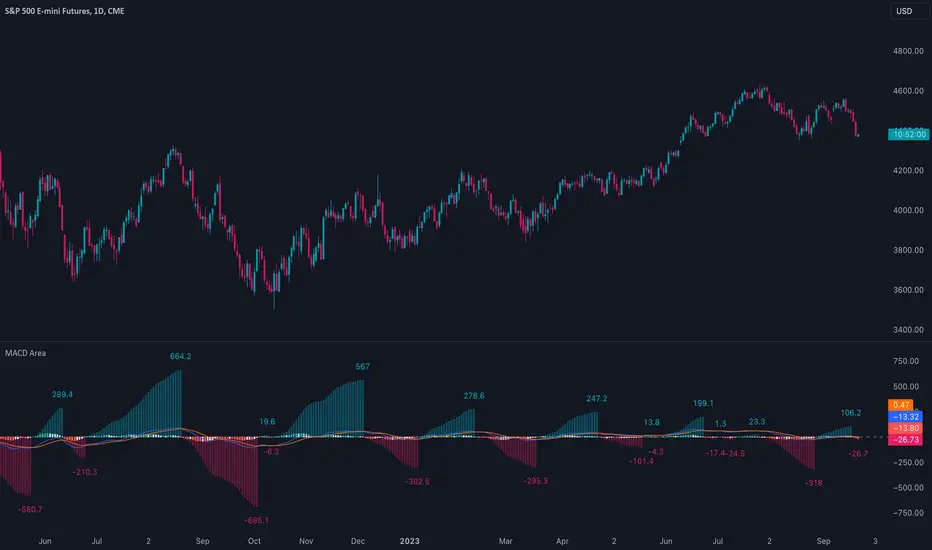
MACD AreaThis indicator calculates and displays the cumulative area for each region above and below the zero line in the MACD histogram. This area measurement serves as a momentum metric, where larger cumulative areas indicate stronger momentum. Divergences between the area and price can also potentially indicate an impending reversal. For example, when the stock price makes a higher high but the area makes a lower high, the current momentum may be unsustainable.
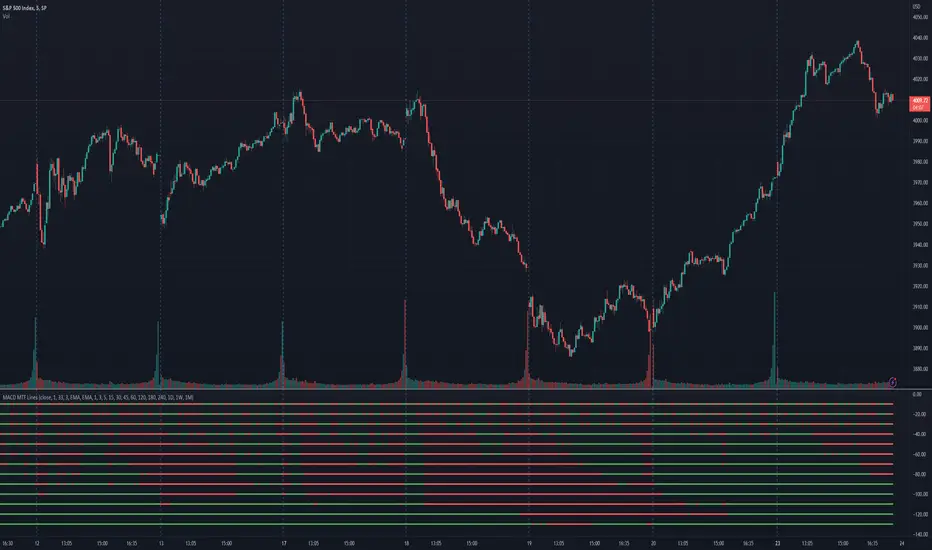
MACD MTF LinesThe indicator shows the MACD histogram sign (positive or negative) for several timeframes at once. You can see at a glance how the price is trending across higher and lower timeframes.
The code uses recursive calculations for the SMA and EMA to avoid lookahead errors and repainting on higher timeframes.
Note that, for lower timeframes, the line becomes yellow to the left because history is limited and there are not enough bars to calculate.
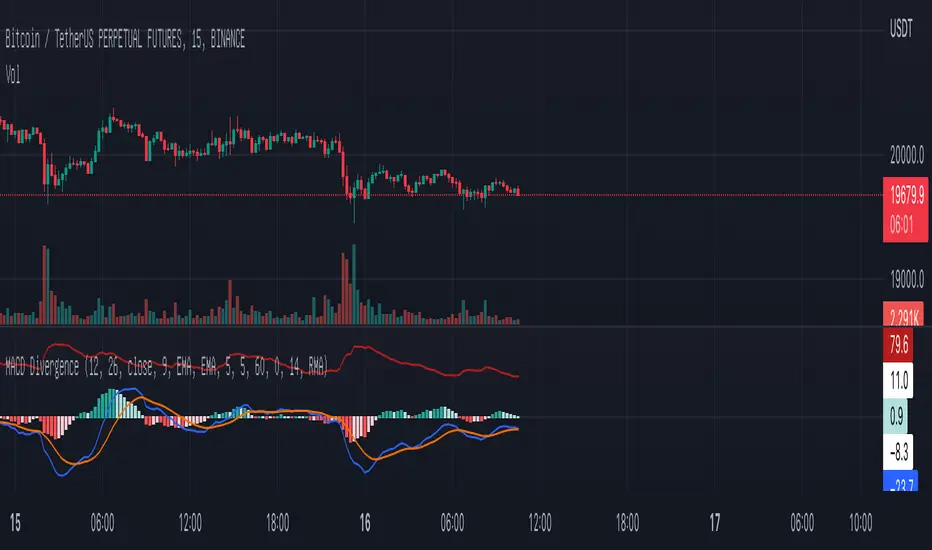
MACD DivergenceA simple MACD divergence indicator
It highlights the lack of strength on the buy side when the market rises.
The lack of strength on the sell side when the market is falling.
I hope you can have fun with it!
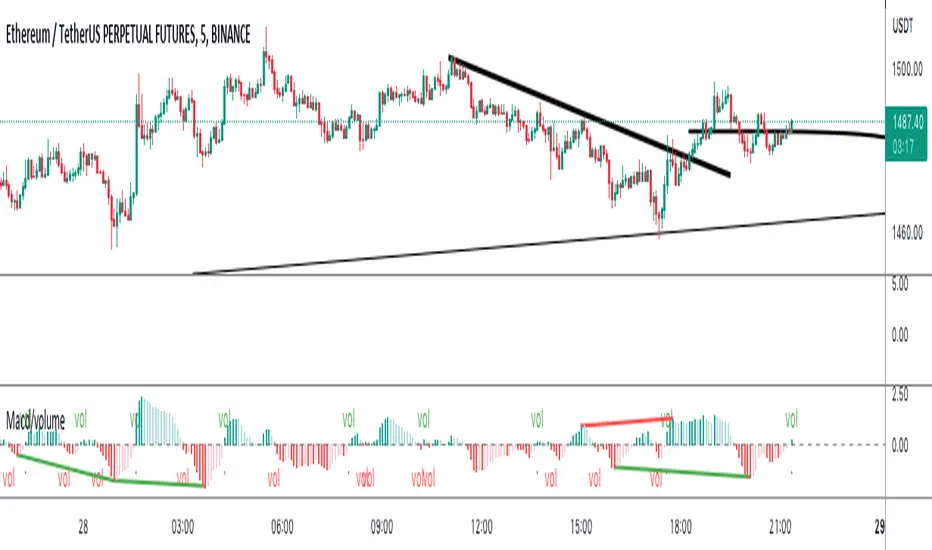
macd volume and divergence - papamallisIdicator the spots macd histogram divergence and filter macd signals based on volume percentage
MACD DivergencesUpdate of MACD indicator which shows the most recent, and developing, price action divergences with the histogram.

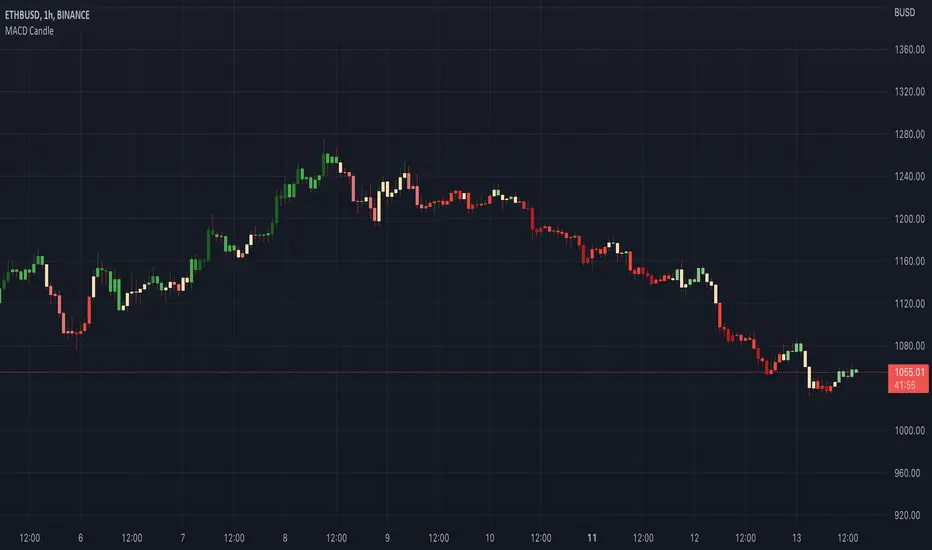
MACD CandleInstead of viewing MACD from a separate chart (histogram), this indicator will plot a candle based on the MACD value. It is easy to summarize trends and make your technical analysis charting less complex.
MACD Indicator for 5 Min ScalpThis Indicator merges the 1 min MACD with BollingerBands to dedect a bigger than avarage tick on the Macd for the 5 min Scalping Strategy
You can change the length of the bollinger bands for the upper and lower channel individually so that you can get better signals
if a tick is bigger than avarage it will be colored, else it would be gray
this is the same indicator i used to get entrys in my 5 min scalping statagy, but i wouldnt just go in a trade when there is a bigger than usual tick. You have to look at other things to

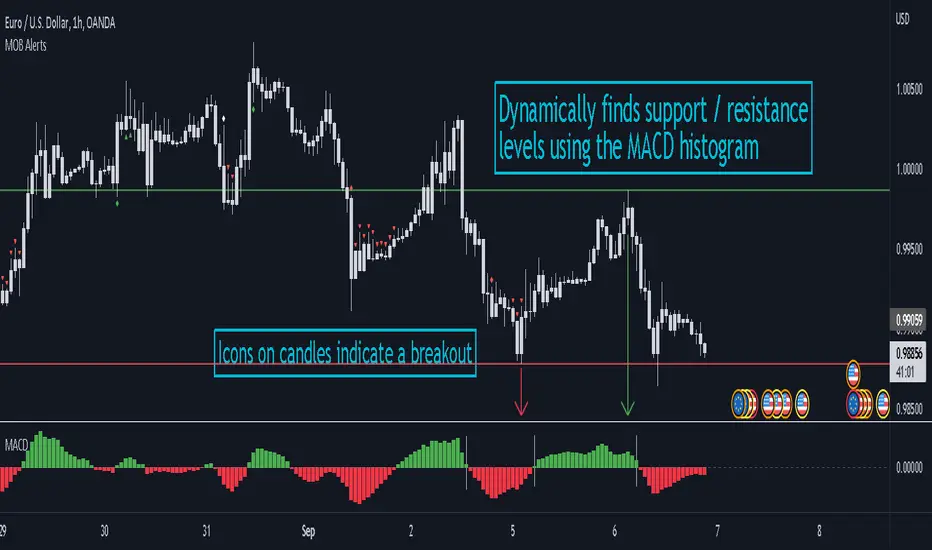
MACD Objective Breakouts + AlertsFinds the most recent support and resistance level as confirmed by the MACD . These level are detected dynamically and the lines will be updated as new levels form.
Alerts can be toggled on or off in the settings but will not work if the alert is not added to your chart. Alerts can be added by selecting the "Alert" button on TradingView then selecting "MOB Alerts" as the condition
Alerts will trigger when price closes above or below the indicated levels.
Please let me know if you find any bugs!
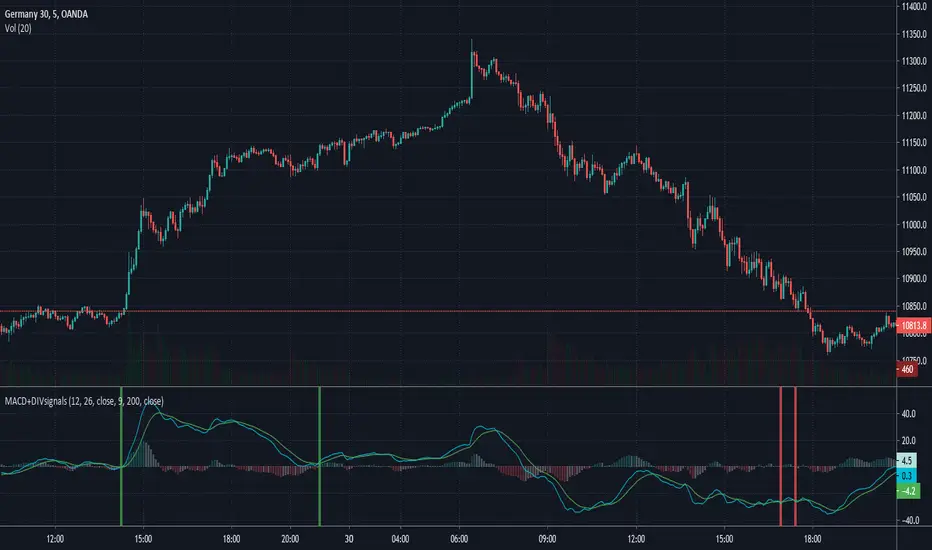
MACD + Divergence + Line █ OVERVIEW
Here's the classic MACD with some simples features in plus.
█ CONCEPTS
4 features
1 — Classic MACD histogram, with 4 different colors such as above or below 0, and above or below the previous bar
2 — Display option to disable EMA
3 — A signal line that show the exact point, because the histogram view might be hard to be precise
4 — Looking for previous Divergences, Bullish, Bearish and Hidden Bullish and Bearish but I don't like Hidden divergences
█ OTHER SECTIONS
An oscillator is good to know where we are in the trends, but it's not enough to run a small business of trading, you need to learn how to use it.
What is a divergence ?
Thanks to The rational investor for teaching me how to use this indicator.
MACD MTF Table Indicator MACD MTF Table Provide you Indicator Value for MTF 5,15,30,45,60,120,D,W,M in table format
user can also able to change value of Fast Length, slow length, Smoothing Line as per users requirement
also provided ATR Value for same timeframe NSE:NIFTY NSE:BANKNIFTY

MACD oscillator with EMA alert version 4HThis is the study/indicator alert version of the macd + ema strategy.
The strategy details are the following :
Is a simple, yet efficient strategy, which is made from a combination of an oscillator and a moving average.
Its setup for 4h candles with the current settings, however it can be adapted to other different timeframes.
It works nicely ,beating the buy and hold for both BTC and ETH over the last 3 years.
As well with some optimizations and modifications it can be adapted to futures market, indexes(NASDAQ, NIFTY etc), forex( GBPUSD ), stocks and so on.
Components:
MACD
EMA
Time condition
Long/short option
For long/exit short we enter when we are above the ema , histogram is positive and current candle is higher than previous.
For short /exit long , when close below ema , histo negative and current candles smaller than previous
If you have any questions please let me know !

MACD VWAP IndicatorThis indicator uses a combination of the VWAP, EMA 9 and parts of the MACD in order to detect a bullish or bearish trend.
How to trade it:
Set SL either below or above the VWAP line (orange) and TP to 1:1.5 ratio (depending on last few candles, of course).
If EMA200 is close by then place SL either below or above EMA200 (blue) and TP to 1:1.5 ratio
Important:
Best traded in 15M, 30M => Intraday.
Have fun! :)


MACD with divergence signalsIts an MACD indicator which highlights places where macd and signal line cross and hidden divergence ocures.
Logic behind it is to check if we have hidden divergence when crossing of that two lines and if above EMA200 (signal for BUY - green) or if below EMA200 (signal for SELL - red).
You can change lenght of EMA but i think 200 is a simpliest trend indicator.
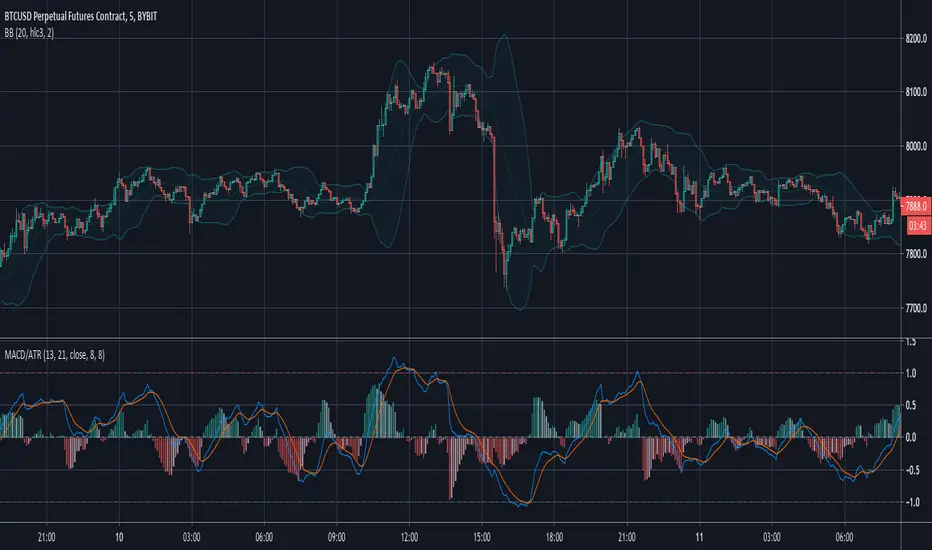
MACD/ATRThis indicator is a restricted MACD .
I reached this with a little trick: I devided it by ATR . This way it is most of the time inside the -1..1 range. It depends on the length of the ATR's period. If it is greater, the probability of outliers is greater.
With this indicator you can use cerain levels of MACD and its histogram as a trigger.
Share with me if you found it useful.
MACD + RSI Robert's VersionCombination of MACD and RSI to see how they work together, its meant for any market and any condition

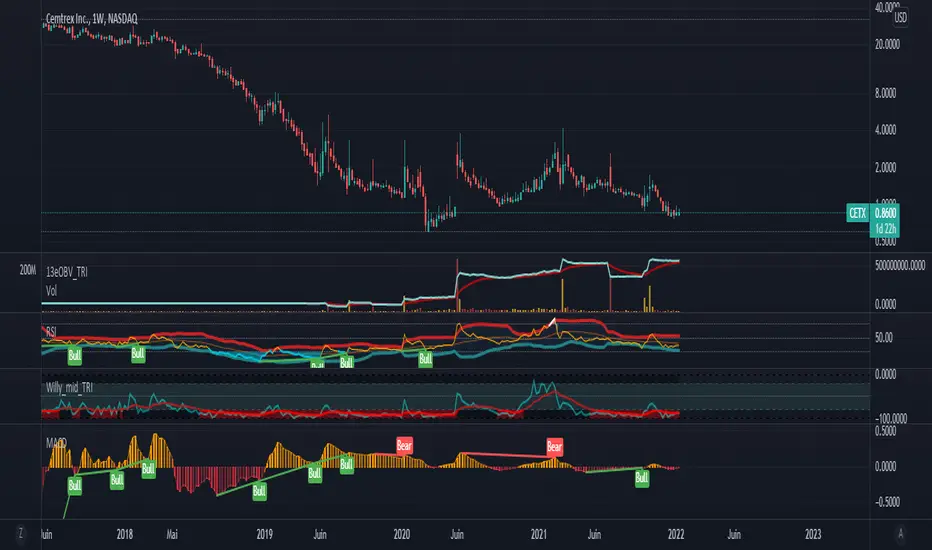
MACD & Mayer multpile Crypto-EmbassyThis is a combination of two indicators MACD & The Mayer Multiple.
MACD = Short for moving average convergence/divergence. It is designed to reveal changes in the strength, direction, momentum, and duration of a trend in a stock's price.
You will find the normal histogram and also a generated trend line (green = bullish , red = bearish )
The Mayer Multiple = The Mayer Multiple was created by Trace Mayer as a way to analyse the price of Bitcoin in a historical context. The Mayer Multiple is the multiple of the current price over the 200-days moving average.
"It does NOT tell whether to buy, sell or hold" but it gives you a pretty good idea of where we are at.
Basically
🔵Blue = Please buy🙏
🟢Light green = Looking for good entries 👀
🟢Green = Buy if you wish
🟡Yellow = This is starting to take off
🟠Orange = Looking for good exit 👀
🔴Red = You should get out of this
🔴Dark Red = You have balls, now please sell🙏

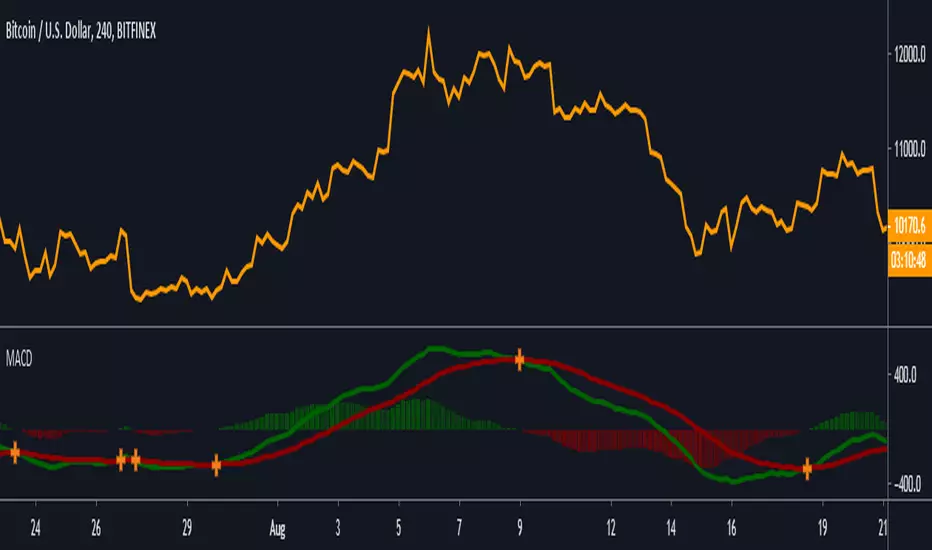
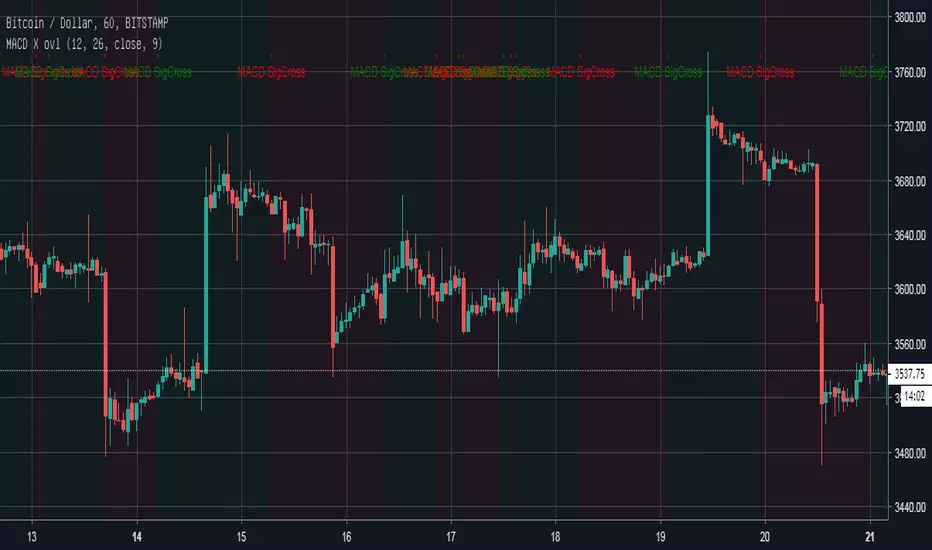
MACD [Gu5]Extremely popular indicator MACD (Moving Average Convergence/Divergence)
Same design of my previous indicators
Show Cross Line for a better visualization
```
Setting recommended for BTC
"Fast Length" = 21
"Slow Length" = 55
"Signal Smoothing" = 14
Other markets try
"Fast Length" = 12
"Slow Length" = 26
"Signal Smoothing" = 9
```
--
El MACD (Convergencia/Divergencia de Medias Móviles) es uno de los mas populares indicadores
Continuando con el mismo estilo de diseño de mis anteriores indicadores
Destaca el cruce de medias para una mejor visualización
MACD phi³Esse script possui 6 MACD configurados com o Phi³ e um sistema para encontrar as divergências em cada linha sendo impresso na vela o H1, H2, H3, H4, H5 e H6, os tempos de 17 velas até 610, já ajustado para mostrar em 72 minutos, pode por em qualquer tempo, mas tempos menores ele irá duplicar a impressão dos dados, ex: se por em 17 ou 15 minutos, irá aparecer 4 velas com os avisos, pois irá dividir o tempo.
Foi testado com o BTCUSD, não sei a eficiência com outras moedas, fiquem a vontade pra comentar e criticar.
OBS: Não me responsabilizo por eventuais falhas do script ou perdas, é uma ferramenta em fase de teste.

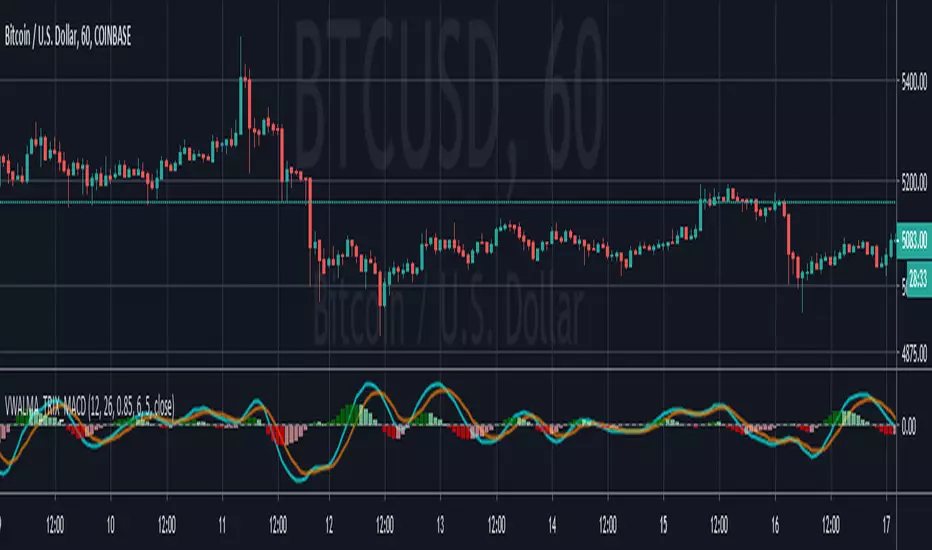
Volume Weighted ALMA TRIX MACDMACD constructed using volume weighted(optional) ALMA TRX
---------------------------------------
If you find it useful please consider a tip/donation :
BTC - 3BMEXEDyWJ58eXUEALYPadbn1wwWKmf6sA
MACD RVI [Le Soleil]Recalculation MACD with RVI. This application provides better results than combination of moving averages, MACD, RVI.
