Volume Weighted MACDThis is just like the normal MACD indicator, except that the values are Volume Weighted and the Histogram changes colour depending on the positive or negative value
Search in scripts for "macd"
Multi-Functional Fisher Transform MTF with MACDL TRIGGERWhat this indicator gives you is a true signal when price is exhausted and ready for a fast turnaround. Fisher Transform is set for multi-time frame and also allows the user to change the length. This way a user can compare two or more time spans and lengths to look for these MACDL divergent triggers after a Fisher exhaustion. With so many indicators, it's probably best to merge these indicators and change the Fisher and Trigger colors so you can still have a look at price action (remember to scale right after merger). I've noticed from time to time when you have Fisher 34 100 and 300 up and running on two different time frames such as 5 and 15 min charts, with MACDL triggers on the 100/300 or 34/100 you get a high probability trade trigger. However, there are rare exceptions such as when price moves in a parabolic state up or down for a long period where this indication does not work. Ideally this indicator works best in a sideways market or slow rising/descending moving market.
This indicator was worked on by Glaz, nmike and myself
LazyBear also introduced the MACDL indicator

MIT MACD • Filled/Hollow Momentum HistogramThe MIT MACD • Filled/Hollow Momentum Histogram is an enhanced version of the classic MACD.
- Dual-style histogram (filled for acceleration, hollow for deceleration).
- Customizable colors for bars, MACD/Signal lines, and background.
- Background highlight when the slow line crosses the zero-line.
- Fully adjustable parameters, keeping TradingView defaults.
此脚本是经典 MACD 的进阶版,支持实心/空心动能柱体,零轴背景高亮,参数与配色可自由调整,更直观捕捉趋势与动能变化。
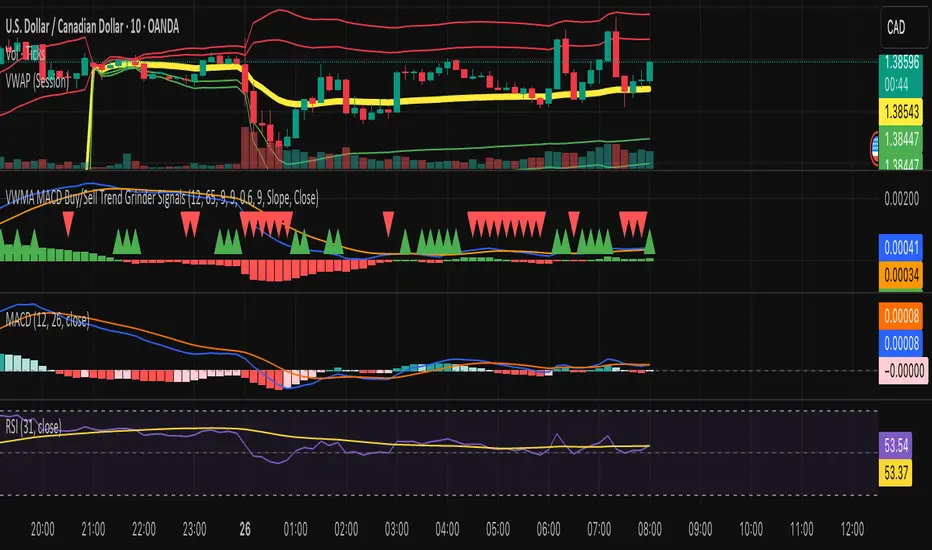
VWMA MACD Trend Grinder Buy/Sell SignalsDescription:
This indicator combines a VWMA-based MACD with volume and trend filters to reduce false buy and sell signals.
It is designed to give more reliable entry and exit points in trending markets while avoiding low-volume noise.
Features:
1. VWMA MACD:
- MACD is calculated using Volume-Weighted Moving Averages (VWMA) instead of standard EMAs.
- Histogram shows the difference between MACD and its signal line.
2. Volume Filter:
- Signals are only triggered when current volume exceeds a multiple of its moving average.
- Reduces false signals in low-volume periods.
3. Trend Filter:
- Only triggers buy signals when price is above a long-term VWMA (uptrend).
- Only triggers sell signals when price is below the long-term VWMA (downtrend).
- Helps avoid counter-trend trades.
4. Plots:
- MACD (blue), Signal (orange), Histogram (green/red)
- Trend VWMA (purple)
- Buy and Sell arrows in the indicator pane (green/red)
5. Alerts:
- Configurable alerts for buy and sell signals filtered by volume and trend.
Inputs:
- Fast Length: VWMA period for the fast MACD line (default 12)
- Slow Length: VWMA period for the slow MACD line (default 26)
- Signal Length: EMA period for the MACD signal line (default 9)
- Volume MA Length: Length for volume moving average filter (default 20)
- Volume Threshold Multiplier: Multiplier for volume filter (default 1.2)
- Trend VWMA Length: Period for long-term trend VWMA (default 50)
- Price Source: Close, HL2, HLC3, OHLC4
Usage:
- Use as a confirmation tool along with other analysis techniques.
- Buy when the green triangle appears (MACD crossover, above trend VWMA, sufficient volume).
- Sell when the red triangle appears (MACD crossunder, below trend VWMA, sufficient volume).
- Trend VWMA helps visually confirm the market trend.
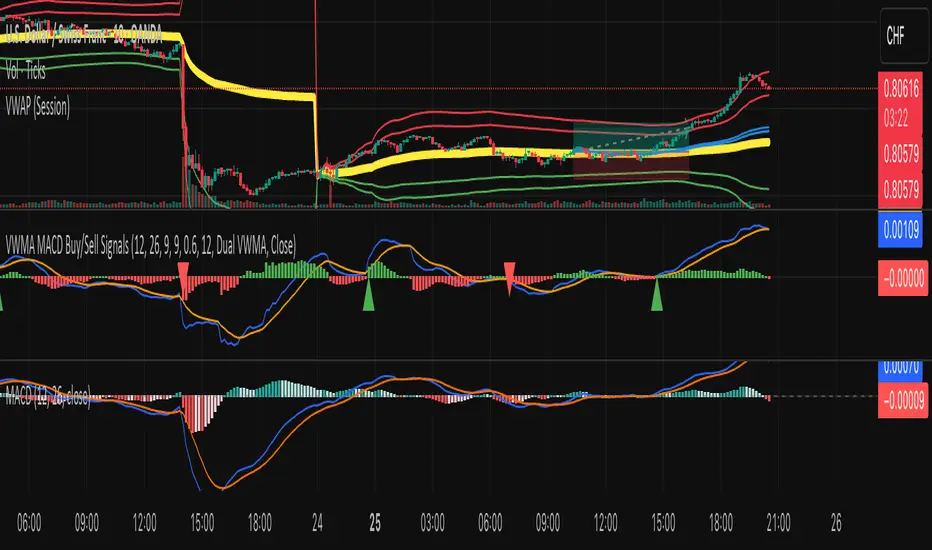
VWMA MACD Amanita Buy/Sell Signals VWMA MACD Amanita Buy/Sell Signals – Volume-Weighted Momentum Indicator
A twist on the classic MACD: this indicator uses Volume Weighted Moving Averages (VWMA) instead of EMAs, giving more weight to price moves backed by higher volume.
Features:
VWMA-based MACD line & signal line
Histogram highlights bullish/bearish momentum
Color-coded for easy visualization
Quick Guide:
MACD above Signal → bullish
MACD below Signal → bearish
Rising histogram → strengthening trend
Falling histogram → weakening trend
Perfect for traders who want momentum confirmed by volume.
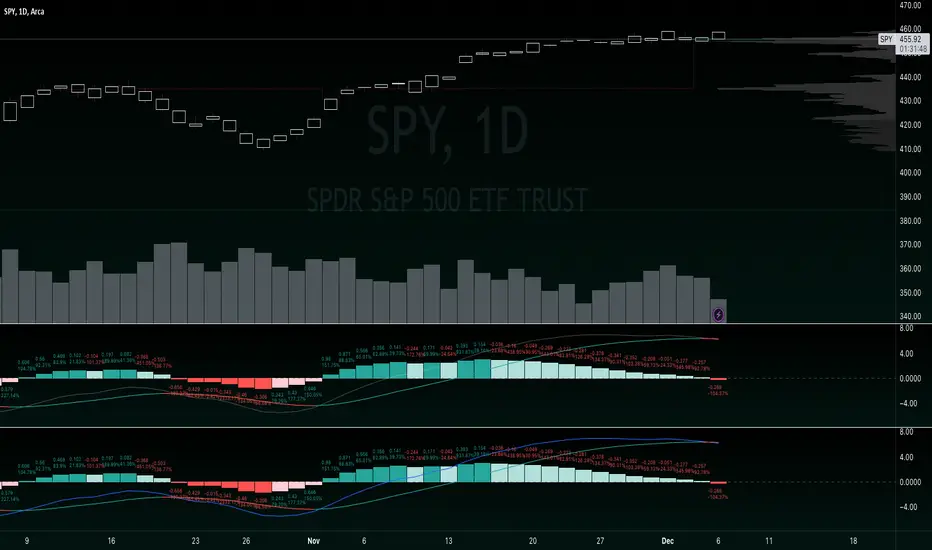
Institutional MACD (Z-Score Edition) [VolumeVigilante]📈 Institutional MACD (Z-Score Edition) — Professional-Grade Momentum Signal
This is not your average MACD .
The Institutional MACD (Z-Score Edition) is a statistically enhanced momentum tool, purpose-built for serious traders and breakout hunters . By applying Z-Score normalization to the classic MACD structure, this indicator uncovers statistically significant momentum shifts , enabling cleaner reads on price extremes, trend continuation, and potential reversals.
💡 Why It Matters
The classic MACD is powerful — but raw momentum values can be noisy and relative , especially on volatile assets like BTC/USD . By transforming the MACD line, signal line, and histogram into Z-scores , we anchor these signals in statistical context . This makes the Institutional MACD:
✔️ Timeframe-agnostic and asset-normalized
✔️ Ideal for spotting true breakouts , not false flags
✔️ A reliable tool for detecting momentum divergence and exhaustion
🧪 Key Features
✅ Full Z-Score normalization (MACD, Signal, Histogram)
✅ Highlighted ±Z threshold bands for overbought/oversold zones
✅ Customizable histogram coloring for visual momentum shifts
✅ Built-in alerts for zero-crosses and Z-threshold breaks
✅ Clean overlay with optional display toggles
🔁 Strategy Tip: Mean Reversion Signals with Statistical Confidence
This indicator isn't just for spotting breakouts — it also shines as a mean reversion tool , thanks to its Z-Score normalization .
When the Z-Score histogram crosses beyond ±2, it marks a statistically significant deviation from the mean — often signaling that momentum is overstretched and the asset may be due for a pullback or reversal .
📌 How to use it:
Z > +2 → Price action is in overbought territory. Watch for exhaustion or short setups.
Z < -2 → Momentum is deeply oversold. Look for reversal confirmation or long opportunities.
These zones often precede snap-back moves , especially in range-bound or corrective markets .
🎯 Combine Z-Score extremes with:
Candlestick confirmation
Support/resistance zones
Volume or price divergence
Other mean reversion tools (e.g., RSI, Bollinger Bands)
Unlike the raw MACD, this version delivers statistical thresholds , not guesswork — helping traders make decisions rooted in probability, not emotion.
📢 Trade Smart. Trade Vigilantly.
Published by VolumeVigilante

[F.B]_ZLEMA MACD ZLEMA MACD – A Zero-Lag Variant of the Classic MACD
Introduction & Motivation
The Moving Average Convergence Divergence (MACD) is a standard indicator for measuring trend strength and momentum. However, it suffers from the latency of traditional Exponential Moving Averages (EMAs).
This variant replaces EMAs with Zero Lag Exponential Moving Averages (ZLEMA), reducing delay and increasing the indicator’s responsiveness. This can potentially lead to earlier trend change detection, especially in highly volatile markets.
Calculation Methodology
2.1 Zero-Lag Exponential Moving Average (ZLEMA)
The classic EMA formula is extended with a correction factor:
ZLEMA_t = EMA(2 * P_t - EMA(P_t, L), L)
where:
P_t is the closing price,
L is the smoothing period length.
2.2 MACD Calculation Using ZLEMA
MACD_t = ZLEMA_short,t - ZLEMA_long,t
with standard parameters of 12 and 26 periods.
2.3 Signal Line with Adaptive Methodology
The signal line can be calculated using ZLEMA, EMA, or SMA:
Signal_t = f(MACD, S)
where f is the chosen smoothing function and S is the period length.
2.4 Histogram as a Measure of Momentum Changes
Histogram_t = MACD_t - Signal_t
An increasing histogram indicates a relative acceleration in trend strength.
Potential Applications in Data Analysis
Since the indicator is based solely on price time series, its effectiveness as a standalone trading signal is limited. However, in quantitative models, it can be used as a feature for trend quantification or for filtering market phases with strong trend dynamics.
Potential use cases include:
Trend Classification: Segmenting market phases into "trend" vs. "mean reversion."
Momentum Regime Identification: Analyzing histogram dynamics to detect increasing or decreasing trend strength.
Signal Smoothing: An alternative to classic EMA smoothing in more complex multi-factor models.
Important: Using this as a standalone trading indicator without additional confirmation mechanisms is not recommended, as it does not demonstrate statistical superiority over other momentum indicators.
Evaluation & Limitations
✅ Advantages:
Reduced lag compared to the classic MACD.
Customizable signal line smoothing for different applications.
Easy integration into existing analytical pipelines.
⚠️ Limitations:
Not a standalone trading system: Like any moving average, this indicator is susceptible to noise and false signals in sideways markets.
Parameter sensitivity: Small changes in period lengths can lead to significant signal deviations, requiring robust optimization.
Conclusion
The ZLEMA MACD is a variant of the classic MACD with reduced latency, making it particularly useful for analytical purposes where faster adaptation to price movements is required.
Its application in trading strategies should be limited to multi-factor models with rigorous evaluation. Backtests and out-of-sample analyses are essential to avoid overfitting to past market data.
Disclaimer: This indicator is provided for informational and educational purposes only and does not constitute financial advice. The author assumes no responsibility for any trading decisions made based on this indicator. Trading involves significant risk, and past performance is not indicative of future results.

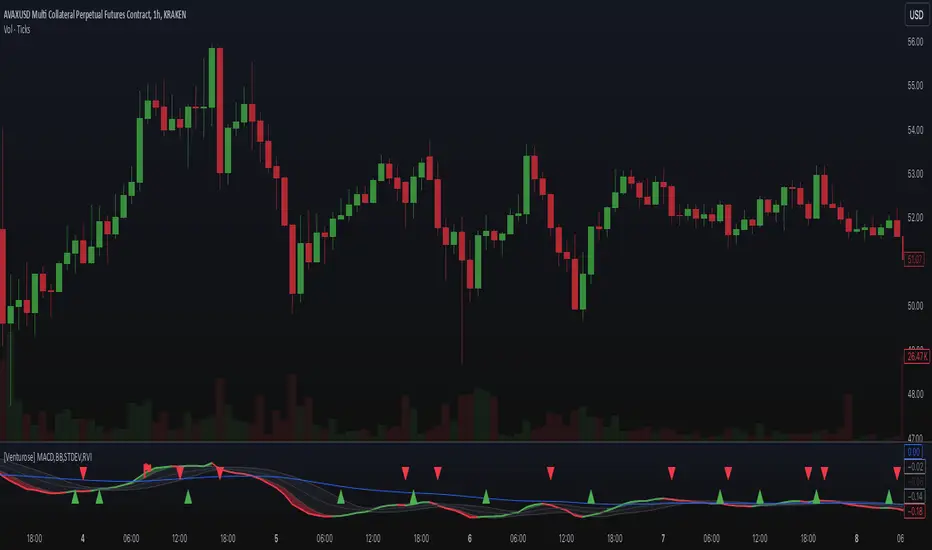
[Venturose] MACD x BB x STDEV x RVIDescription:
The MACD x BB x STDEV x RVI combines MACD, Bollinger Bands, Standard Deviation, and Relative Volatility Index into a single tool. This indicator is designed to provide insights into market trends, momentum, and volatility. It generates buy and sell signals, by analyzing the interactions between these components. These buy and sell signals are not literal, and should be used in combination with the current trend.
How It Works:
MACD: Tracks momentum and trend direction using customizable fast and slow EMA periods.
Bollinger Bands: Adds volatility bands to MACD to identify overextension zones.
Standard Deviation: Dynamically adjusts the Bollinger Band width based on MACD volatility.
RVI (Relative Volatility Index): Confirms momentum extremes with upper and lower threshold markers.
Custom Logic: Includes a trigger system ("inside" or "flipped") to adapt signals to various market conditions and an optional filter to reduce noise.
Key Features:
Combines MACD and Bollinger Bands with volatility and momentum confirmations from RVI.
Dynamic color-coded plots for identifying bullish, bearish, and neutral trends.
Customizable parameters for tailoring the indicator to different strategies.
Optional signal filtering to refine buy and sell triggers.
Alerts for buy and sell signals based on signal logic.
Why It’s Unique:
This indicator combines momentum (MACD), volatility (Bollinger Bands and Standard Deviation), and confirmation signals (RVI thresholds) into a unified system. It introduces custom "inside" and "flipped" triggers for adaptable signal generation and includes signal filtering to reduce noise. The addition of RVI-based hints helps identify early overbought or oversold conditions, providing an extra layer of insight for decision-making. The dynamic integration of these components ensures a comprehensive yet straightforward analysis tool for various market conditions.
Bimmeresty's MACDImproved MACD with labels on histogram and color change feature on signal line.
Labels on histogram help gauge how strong the change is rather than visually comparing heights.
example: "histogram just put in its first rising candle, but its only rising by 0.01 therefore i should be suspicious of it and possibly wait for a second rising candle for further confirmation of reversal"
Color change on signal slope is better for gauging the directional bias and spotting reversals.
example: "slope is red, so negative, so i should prioritize shorts"
example: "slope just turned green, so positive, so we might be reversing bias here"
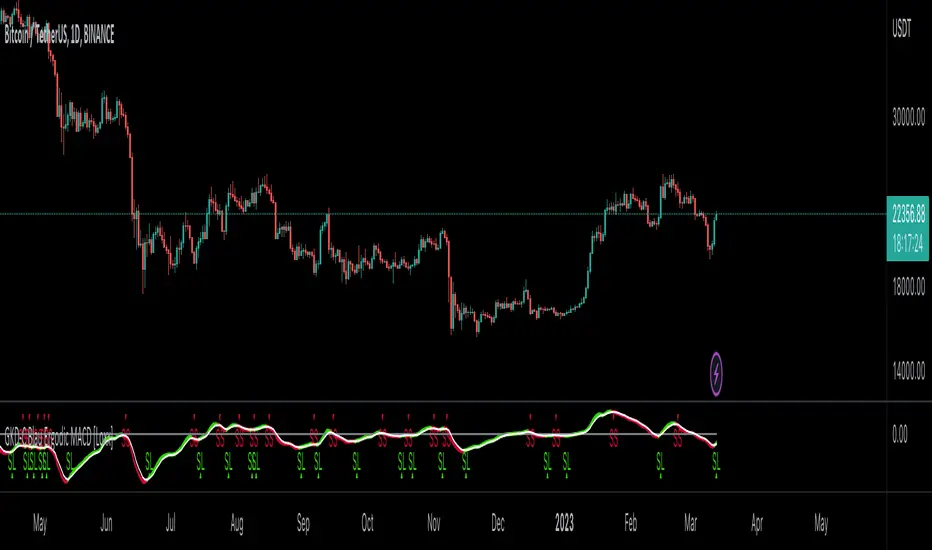
GKD-C Blau Ergodic MACD [Loxx]Giga Kaleidoscope GKD-C Blau Ergodic MACD is a Confirmation module included in Loxx's "Giga Kaleidoscope Modularized Trading System".
█ Giga Kaleidoscope Modularized Trading System
What is Loxx's "Giga Kaleidoscope Modularized Trading System"?
The Giga Kaleidoscope Modularized Trading System is a trading system built on the philosophy of the NNFX (No Nonsense Forex) algorithmic trading.
What is the NNFX algorithmic trading strategy?
The NNFX (No-Nonsense Forex) trading system is a comprehensive approach to Forex trading that is designed to simplify the process and remove the confusion and complexity that often surrounds trading. The system was developed by a Forex trader who goes by the pseudonym "VP" and has gained a significant following in the Forex community.
The NNFX trading system is based on a set of rules and guidelines that help traders make objective and informed decisions. These rules cover all aspects of trading, including market analysis, trade entry, stop loss placement, and trade management.
Here are the main components of the NNFX trading system:
1. Trading Philosophy: The NNFX trading system is based on the idea that successful trading requires a comprehensive understanding of the market, objective analysis, and strict risk management. The system aims to remove subjective elements from trading and focuses on objective rules and guidelines.
2. Technical Analysis: The NNFX trading system relies heavily on technical analysis and uses a range of indicators to identify high-probability trading opportunities. The system uses a combination of trend-following and mean-reverting strategies to identify trades.
3. Market Structure: The NNFX trading system emphasizes the importance of understanding the market structure, including price action, support and resistance levels, and market cycles. The system uses a range of tools to identify the market structure, including trend lines, channels, and moving averages.
4. Trade Entry: The NNFX trading system has strict rules for trade entry. The system uses a combination of technical indicators to identify high-probability trades, and traders must meet specific criteria to enter a trade.
5. Stop Loss Placement: The NNFX trading system places a significant emphasis on risk management and requires traders to place a stop loss order on every trade. The system uses a combination of technical analysis and market structure to determine the appropriate stop loss level.
6. Trade Management: The NNFX trading system has specific rules for managing open trades. The system aims to minimize risk and maximize profit by using a combination of trailing stops, take profit levels, and position sizing.
Overall, the NNFX trading system is designed to be a straightforward and easy-to-follow approach to Forex trading that can be applied by traders of all skill levels.
Core components of an NNFX algorithmic trading strategy
The NNFX algorithm is built on the principles of trend, momentum, and volatility. There are six core components in the NNFX trading algorithm:
1. Volatility - price volatility; e.g., Average True Range, True Range Double, Close-to-Close, etc.
2. Baseline - a moving average to identify price trend
3. Confirmation 1 - a technical indicator used to identify trends
4. Confirmation 2 - a technical indicator used to identify trends
5. Continuation - a technical indicator used to identify trends
6. Volatility/Volume - a technical indicator used to identify volatility/volume breakouts/breakdown
7. Exit - a technical indicator used to determine when a trend is exhausted
What is Volatility in the NNFX trading system?
In the NNFX (No Nonsense Forex) trading system, ATR (Average True Range) is typically used to measure the volatility of an asset. It is used as a part of the system to help determine the appropriate stop loss and take profit levels for a trade. ATR is calculated by taking the average of the true range values over a specified period.
True range is calculated as the maximum of the following values:
-Current high minus the current low
-Absolute value of the current high minus the previous close
-Absolute value of the current low minus the previous close
ATR is a dynamic indicator that changes with changes in volatility. As volatility increases, the value of ATR increases, and as volatility decreases, the value of ATR decreases. By using ATR in NNFX system, traders can adjust their stop loss and take profit levels according to the volatility of the asset being traded. This helps to ensure that the trade is given enough room to move, while also minimizing potential losses.
Other types of volatility include True Range Double (TRD), Close-to-Close, and Garman-Klass
What is a Baseline indicator?
The baseline is essentially a moving average, and is used to determine the overall direction of the market.
The baseline in the NNFX system is used to filter out trades that are not in line with the long-term trend of the market. The baseline is plotted on the chart along with other indicators, such as the Moving Average (MA), the Relative Strength Index (RSI), and the Average True Range (ATR).
Trades are only taken when the price is in the same direction as the baseline. For example, if the baseline is sloping upwards, only long trades are taken, and if the baseline is sloping downwards, only short trades are taken. This approach helps to ensure that trades are in line with the overall trend of the market, and reduces the risk of entering trades that are likely to fail.
By using a baseline in the NNFX system, traders can have a clear reference point for determining the overall trend of the market, and can make more informed trading decisions. The baseline helps to filter out noise and false signals, and ensures that trades are taken in the direction of the long-term trend.
What is a Confirmation indicator?
Confirmation indicators are technical indicators that are used to confirm the signals generated by primary indicators. Primary indicators are the core indicators used in the NNFX system, such as the Average True Range (ATR), the Moving Average (MA), and the Relative Strength Index (RSI).
The purpose of the confirmation indicators is to reduce false signals and improve the accuracy of the trading system. They are designed to confirm the signals generated by the primary indicators by providing additional information about the strength and direction of the trend.
Some examples of confirmation indicators that may be used in the NNFX system include the Bollinger Bands, the MACD (Moving Average Convergence Divergence), and the Stochastic Oscillator. These indicators can provide information about the volatility, momentum, and trend strength of the market, and can be used to confirm the signals generated by the primary indicators.
In the NNFX system, confirmation indicators are used in combination with primary indicators and other filters to create a trading system that is robust and reliable. By using multiple indicators to confirm trading signals, the system aims to reduce the risk of false signals and improve the overall profitability of the trades.
What is a Continuation indicator?
In the NNFX (No Nonsense Forex) trading system, a continuation indicator is a technical indicator that is used to confirm a current trend and predict that the trend is likely to continue in the same direction. A continuation indicator is typically used in conjunction with other indicators in the system, such as a baseline indicator, to provide a comprehensive trading strategy.
What is a Volatility/Volume indicator?
Volume indicators, such as the On Balance Volume (OBV), the Chaikin Money Flow (CMF), or the Volume Price Trend (VPT), are used to measure the amount of buying and selling activity in a market. They are based on the trading volume of the market, and can provide information about the strength of the trend. In the NNFX system, volume indicators are used to confirm trading signals generated by the Moving Average and the Relative Strength Index. Volatility indicators include Average Direction Index, Waddah Attar, and Volatility Ratio. In the NNFX trading system, volatility is a proxy for volume and vice versa.
By using volume indicators as confirmation tools, the NNFX trading system aims to reduce the risk of false signals and improve the overall profitability of trades. These indicators can provide additional information about the market that is not captured by the primary indicators, and can help traders to make more informed trading decisions. In addition, volume indicators can be used to identify potential changes in market trends and to confirm the strength of price movements.
What is an Exit indicator?
The exit indicator is used in conjunction with other indicators in the system, such as the Moving Average (MA), the Relative Strength Index (RSI), and the Average True Range (ATR), to provide a comprehensive trading strategy.
The exit indicator in the NNFX system can be any technical indicator that is deemed effective at identifying optimal exit points. Examples of exit indicators that are commonly used include the Parabolic SAR, the Average Directional Index (ADX), and the Chandelier Exit.
The purpose of the exit indicator is to identify when a trend is likely to reverse or when the market conditions have changed, signaling the need to exit a trade. By using an exit indicator, traders can manage their risk and prevent significant losses.
In the NNFX system, the exit indicator is used in conjunction with a stop loss and a take profit order to maximize profits and minimize losses. The stop loss order is used to limit the amount of loss that can be incurred if the trade goes against the trader, while the take profit order is used to lock in profits when the trade is moving in the trader's favor.
Overall, the use of an exit indicator in the NNFX trading system is an important component of a comprehensive trading strategy. It allows traders to manage their risk effectively and improve the profitability of their trades by exiting at the right time.
How does Loxx's GKD (Giga Kaleidoscope Modularized Trading System) implement the NNFX algorithm outlined above?
Loxx's GKD v1.0 system has five types of modules (indicators/strategies). These modules are:
1. GKD-BT - Backtesting module (Volatility, Number 1 in the NNFX algorithm)
2. GKD-B - Baseline module (Baseline and Volatility/Volume, Numbers 1 and 2 in the NNFX algorithm)
3. GKD-C - Confirmation 1/2 and Continuation module (Confirmation 1/2 and Continuation, Numbers 3, 4, and 5 in the NNFX algorithm)
4. GKD-V - Volatility/Volume module (Confirmation 1/2, Number 6 in the NNFX algorithm)
5. GKD-E - Exit module (Exit, Number 7 in the NNFX algorithm)
(additional module types will added in future releases)
Each module interacts with every module by passing data between modules. Data is passed between each module as described below:
GKD-B => GKD-V => GKD-C(1) => GKD-C(2) => GKD-C(Continuation) => GKD-E => GKD-BT
That is, the Baseline indicator passes its data to Volatility/Volume. The Volatility/Volume indicator passes its values to the Confirmation 1 indicator. The Confirmation 1 indicator passes its values to the Confirmation 2 indicator. The Confirmation 2 indicator passes its values to the Continuation indicator. The Continuation indicator passes its values to the Exit indicator, and finally, the Exit indicator passes its values to the Backtest strategy.
This chaining of indicators requires that each module conform to Loxx's GKD protocol, therefore allowing for the testing of every possible combination of technical indicators that make up the six components of the NNFX algorithm.
What does the application of the GKD trading system look like?
Example trading system:
Backtest: Strategy with 1-3 take profits, trailing stop loss, multiple types of PnL volatility, and 2 backtesting styles
Baseline: Hull Moving Average
Volatility/Volume: Damiani Volatmeter
Confirmation 1: Blau Ergodic MACD as shown on the chart above
Confirmation 2: Williams Percent Range
Continuation: Fisher Transform
Exit: Rex Oscillator
Each GKD indicator is denoted with a module identifier of either: GKD-BT, GKD-B, GKD-C, GKD-V, or GKD-E. This allows traders to understand to which module each indicator belongs and where each indicator fits into the GKD protocol chain.
Giga Kaleidoscope Modularized Trading System Signals (based on the NNFX algorithm)
Standard Entry
1. GKD-C Confirmation 1 Signal
2. GKD-B Baseline agrees
3. Price is within a range of 0.2x Volatility and 1.0x Volatility of the Goldie Locks Mean
4. GKD-C Confirmation 2 agrees
5. GKD-V Volatility/Volume agrees
Baseline Entry
1. GKD-B Baseline signal
2. GKD-C Confirmation 1 agrees
3. Price is within a range of 0.2x Volatility and 1.0x Volatility of the Goldie Locks Mean
4. GKD-C Confirmation 2 agrees
5. GKD-V Volatility/Volume agrees
6. GKD-C Confirmation 1 signal was less than 7 candles prior
Continuation Entry
1. Standard Entry, Baseline Entry, or Pullback; entry triggered previously
2. GKD-B Baseline hasn't crossed since entry signal trigger
3. GKD-C Confirmation Continuation Indicator signals
4. GKD-C Confirmation 1 agrees
5. GKD-B Baseline agrees
6. GKD-C Confirmation 2 agrees
1-Candle Rule Standard Entry
1. GKD-C Confirmation 1 signal
2. GKD-B Baseline agrees
3. Price is within a range of 0.2x Volatility and 1.0x Volatility of the Goldie Locks Mean
Next Candle:
1. Price retraced (Long: close < close or Short: close > close )
2. GKD-B Baseline agrees
3. GKD-C Confirmation 1 agrees
4. GKD-C Confirmation 2 agrees
5. GKD-V Volatility/Volume agrees
1-Candle Rule Baseline Entry
1. GKD-B Baseline signal
2. GKD-C Confirmation 1 agrees
3. Price is within a range of 0.2x Volatility and 1.0x Volatility of the Goldie Locks Mean
4. GKD-C Confirmation 1 signal was less than 7 candles prior
Next Candle:
1. Price retraced (Long: close < close or Short: close > close )
2. GKD-B Baseline agrees
3. GKD-C Confirmation 1 agrees
4. GKD-C Confirmation 2 agrees
5. GKD-V Volatility/Volume Agrees
PullBack Entry
1. GKD-B Baseline signal
2. GKD-C Confirmation 1 agrees
3. Price is beyond 1.0x Volatility of Baseline
Next Candle:
1. Price is within a range of 0.2x Volatility and 1.0x Volatility of the Goldie Locks Mean
3. GKD-C Confirmation 1 agrees
4. GKD-C Confirmation 2 agrees
5. GKD-V Volatility/Volume Agrees
█ GKD-C Blau Ergodic MACD
The Blau Ergodic MACD (Moving Average Convergence Divergence) is a technical analysis indicator that was developed by William Blau. It is a modification of the traditional MACD indicator, designed to provide a smoother and more responsive moving average calculation. The Blau Ergodic MACD incorporates the concept of Ergodicity, which is a mathematical concept that describes the long-term behavior of a system. The Ergodicity principle is used to filter out market noise and provide a clearer representation of the underlying trend.
The Blau Ergodic MACD consists of two lines, the Blau line and the signal line. The Blau line is calculated as the difference between two exponential moving averages (EMAs) that are smoothed using the Ergodicity principle. The signal line is a moving average of the Blau line. When the Blau line crosses above the signal line, it is considered a bullish signal, while a bearish signal is generated when the Blau line crosses below the signal line.
The Blau Ergodic MACD is a useful tool for traders and investors to identify potential trend reversals and to make informed trading decisions. It is particularly useful in volatile markets, where traditional technical indicators may be less effective.
This indicator includes both the Blau Ergodic MACD and the Blau MACD. The regular MACD is a zero-line cross, the Ergodic version is described above.
Requirements
Inputs
Confirmation 1 and Solo Confirmation: GKD-V Volatility / Volume indicator
Confirmation 2: GKD-C Confirmation indicator
Outputs
Confirmation 2 and Solo Confirmation Complex: GKD-E Exit indicator
Confirmation 1: GKD-C Confirmation indicator
Continuation: GKD-E Exit indicator
Solo Confirmation Simple: GKD-BT Backtest strategy
Additional features will be added in future releases.
SUPER MACD📈 MACD Indicator Update - Version 2
🔹 New Features and Improvements:
1️⃣ New MACD Calculation Options:
Users can now choose from various Moving Averages to calculate the MACD. The default options are SMA (Simple Moving Average) and EMA (Exponential Moving Average), but there are 14 other versions available to experiment with:
SMA (Simple Moving Average)
EMA (Exponential Moving Average)
WMA (Weighted Moving Average)
RMA (Smoothed Moving Average)
HMA (Hull Moving Average)
JMA (Jurik Moving Average)
DEMA (Double Exponential Moving Average)
TEMA (Triple Exponential Moving Average)
LSMA (Least Squares Moving Average)
VWMA (Volume-Weighted Moving Average)
SMMA (Smoothed Moving Average)
KAMA (Kaufman’s Adaptive Moving Average)
ALMA (Arnaud Legoux Moving Average)
FRAMA (Fractal Adaptive Moving Average)
VIDYA (Variable Index Dynamic Average)
2️⃣ Improved Input Visibility and Organization:
We’ve reorganized the inputs so that the most commonly used ones are now placed at the beginning for quicker and more convenient configuration.
3️⃣ Bug Fixes and Code Improvements:
Minor bugs have been fixed, and the code has been optimized for better stability and performance. The code is now cleaner and fully functional in version 6.
4️⃣ Cometreon Public Library Integration:
To lighten the code and improve its modularity, we’ve integrated the Cometreon public library. This makes the code more efficient and reduces the need to duplicate common functions.
☄️ With this update, the MACD indicator becomes even more versatile and user-friendly, offering a wide range of calculation methods and an improved interface!

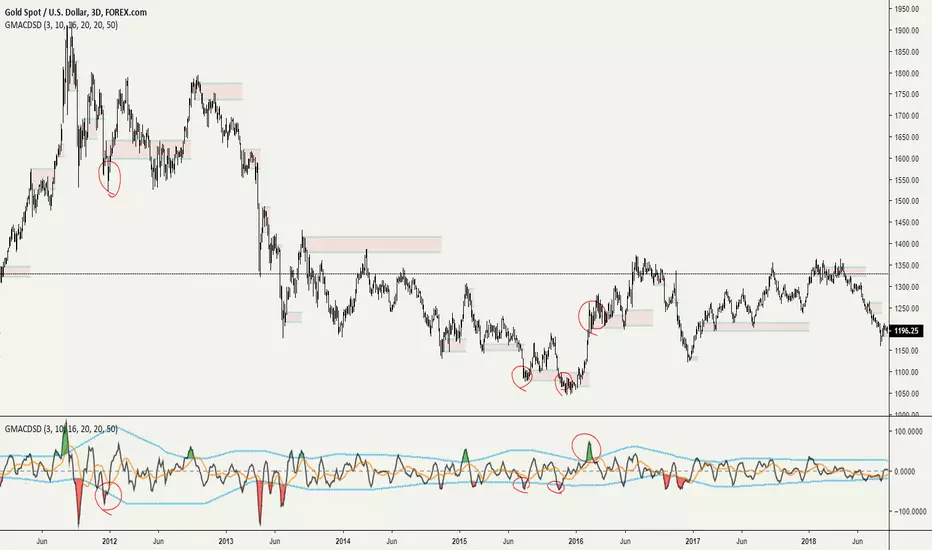
Fisher Transform of MACD w/ Quantile Bands [Loxx]Fisher Transform of MACD w/ Quantile Bands is a Fisher Transform indicator with Quantile Bands that takes as it's source a MACD. The MACD has two different source inputs for fast and slow moving averages.
What is Fisher Transform?
The Fisher Transform is a technical indicator created by John F. Ehlers that converts prices into a Gaussian normal distribution.
The indicator highlights when prices have moved to an extreme, based on recent prices. This may help in spotting turning points in the price of an asset. It also helps show the trend and isolate the price waves within a trend.
What is Quantile Bands?
In statistics and the theory of probability, quantiles are cutpoints dividing the range of a probability distribution into contiguous intervals with equal probabilities, or dividing the observations in a sample in the same way. There is one less quantile than the number of groups created. Thus quartiles are the three cut points that will divide a dataset into four equal-size groups (cf. depicted example). Common quantiles have special names: for instance quartile, decile (creating 10 groups: see below for more). The groups created are termed halves, thirds, quarters, etc., though sometimes the terms for the quantile are used for the groups created, rather than for the cut points.
q-Quantiles are values that partition a finite set of values into q subsets of (nearly) equal sizes. There are q − 1 of the q-quantiles, one for each integer k satisfying 0 < k < q. In some cases the value of a quantile may not be uniquely determined, as can be the case for the median (2-quantile) of a uniform probability distribution on a set of even size. Quantiles can also be applied to continuous distributions, providing a way to generalize rank statistics to continuous variables. When the cumulative distribution function of a random variable is known, the q-quantiles are the application of the quantile function (the inverse function of the cumulative distribution function) to the values {1/q, 2/q, …, (q − 1)/q}.
What is MACD?
Moving average convergence divergence ( MACD ) is a trend-following momentum indicator that shows the relationship between two moving averages of a security’s price. The MACD is calculated by subtracting the 26-period exponential moving average ( EMA ) from the 12-period EMA .
Included:
Zero-line and signal cross options for bar coloring, signals, and alerts
Alerts
Signals
Loxx's Expanded Source Types
35+ moving average types

MACD-EDT "EMA DEMA TEMA" [DM]Greetings to all colleagues
Today I share a MACD with the EMA , DEMA , TEMA variants.
The aim is that they can see how the signals vary from a normal MACD to one with the averages created by Patrick Mulloy (1994)
Variables of this MACD:
EMA = Exponential Moving Average
DEMA = Double Exponential Moving Average
TOPIC = Triple Exponential Moving Average
He also has in the arsenal:
SMA Simple Moving Average
WMA Weighted Moving Average
Plus...:
Volume-weighted variant in all of them
Visual options:
Points at the crossroads
Shadows on the body of the signals
All colors are customizable
Histogram and shadow are gradients at 15 steps
It has switches for:
Shadow
Histogram
Macd and signal
Crosses
Some minor details remain to be incorporated in the next few days.
Pre-cross calculation.
Alerts
Bar color
Enjoy!!! ;-)

Pumpkin Soup MACD Profit CandlesMACD-based Relative Stock Price Candle
It was a mixture of MACD and a combined centered oscillator, indicating relative stock bar movement.
It moves approximately between 200 and -200, adding a divergence.
In addition to Hidden Diversions and Normal Diversions, I added the Long Short Diversions and the Preview Diversions that I analyzed.
It would be convenient if you think of it as a mix of general stochastic and MACD.
/////
MACD 기반 상대 주가봉 캔들
MACD와 종합 센터드 오실레이터의 혼합형으로 상대적인 주가봉 움직임을 나타내었습니다.
대략적으로 200 ~ -200 구간에서 움직이며, 다이버전스를 넣었습니다.
히든 다이버전스, 일반 다이버전스 외 제가 분석한 롱 숏 다이버전스와 예고 다이버전스도 첨가하였습니다.
일반적인 스톡캐스틱와 MACD의 혼합형이라고 생각하시면 편하실듯합니다.

MACD+ Alerts [SystemAlpha]This is the alert companion of the MACD+ Strategy . Instead of using just the normal crossovers, we use trend filters, trailing stop loss and take profit targets. This strategy was developed for crypto, forex and stocks on daily timeframe but feel free to experiment on 15 minutes or higher using heikin ashi or normal candles.
In this alert you have a choice of:
Trend Filters:
- Average Directional Index ( ADX ) – buy when price is trend is up and sell when trend is down.
- Moving Average (MA) – buy when price close above the defined moving average and sell when price close below moving average
- Parabolic SAR – buy when SAR is above price is above price and sell when SAR is below price.
- All - Use ADX , MA and SAR as filters
For MA Filter , you can use the “TF MA Type” and "TF MA Period" parameter to select Simple or Exponential Moving Average and length.
Stop Loss:
- Average True Range (ATR) – ATR % stop as trailing stop loss.
- Parabolic SAR ( SAR ) – Parabolic SAR adapted as trailing stop loss.
For ATR , you can use the “ATR Trailing Stop Multiplier” parameter to set an initial offset for trailing stop loss.
Take Profit Target:
- Average True Range (ATR) – ATR % stop as trailing stop loss.
- Standard % – Percent as target profit
For ATR , you can use the “ATR Take Profit Multiplier” parameter to set an initial offset for trailing stop loss.
Additional feature include:
- Regular and Hidden Divergence display and alerts
Alerts:
When creating alerts use “Once Per Bar Close” parameter for Long and Short and “Once Per Bar” for Close, Trailing Stop, Take Profit and Divergence.
TradingView Links:
Strategy:
MACD:
How to use:
1. Apply the script by browsing through Indicators --> Invite-Only scripts and select the indicator
2. Once loaded, click the gear (settings) button to select/adjust the parameters based on your preference.
3. Wait for the next BUY or SELL signal to enter the trade!
Disclaimer:
The indicator and signals generated do not constitute investment advice; are provided solely for informational purposes and therefore is not an offer to buy or sell a security; are not warranted to be correct, complete or accurate; and are subject to change without notice.

Schaff Trend Cycle w/ MACD HistogramWhat Is Schaff Trend Cycle? (Reference from Investopedia)
The Schaff Trend Cycle (STC) is a charting indicator that is commonly used to identify market trends and provide buy and sell signals to traders. Developed in 1999 by noted currency trader Doug Schaff, STC is a type of oscillator and is based on the assumption that, regardless of time frame, currency trends accelerate and decelerate in cyclical patterns.
How STC Works
Many traders are familiar with moving average convergence/divergence (MACD) charting tool, which is an indicator that is used to forecast price action and is notorious for lagging due to its slow responsive signal line . By contrast, STC’s signal line enables it to detect trends sooner. In fact, it typically identifies up and downtrends long before MACD indicator.
While STC is computed using the same exponential moving averages as MACD, it adds a novel cycle component to improve accuracy and reliability. While MACD is simply computed using a series of moving average, the cycle aspect of STC is based on time (e.g. number of days).
It should also be noted that, although STC was developed primarily for fast currency markets, it may be effectively employed across all markets, just like MACD. It can be applied to intraday charts, such as five minutes or one hour charts, as well as daily, weekly, or monthly time frames.
What's included the indicator?
Zero MACD lag algorithm (can be enabled/disabled)
MACD Histogram (has a different calculation to show the trend clearly. Can revert to original algo but will not truly reflect the current trend.)
Histogram peaks
STC pivots
How to use this indicator?
Use the STC overbought/oversold to determine trend strength.
Use the MACD zeroline crossover to determine the trend if bull/bear
For risky trades:
Long or cover when STC shows a bullish pivot. Exit or short on STC bear pivots
For conservative trades:
Long when MACD histogram crosses above midline. Exit or short on STC bear pivots
Settings:
Default is Fast - 5, Slow - 20. You can turn it up to Fast - 10, Slow - 30.
You can enable or disable certain features if you dont like to see them.

Modified Stochastic MACD Oscillator - Vitali ApirineFor all MACD enthusiasts out there, hot off the press, I present this next generation "Modified Stochastic MACD Oscillator" employing PSv4.0, originally formulated by Vitali Apirine for TASC - November 2019 Traders Tips. Just when you may have thought it was the end of the evolutionary line for MACD technology, it's not! Basically it's a NEW hybridization of a MACD and stochastic rolled into one, maintaining scale symmetry to support overbought/oversold defined levels across time frames and assets, unlike the ordinary MACD. On the ordinary MACD, this is virtually impossible to do properly, and trust me, I have tried with zero success. My less than 40 line implementation, at initial release, is a heavily modified version of the original indicator using novel techniques, surpassing not only Apirine's original intended design, but also the "contemporary MACD" provided by TV, visible on the bottom of the chart.
Utilizing the "Power of Pine", I included the maximum amount of features I could surmise in an ultra small yet powerful package. I provided an abundance of control over each feature as an attempt to create another heavenly MACD experience in an open source package, only rivaled by my "Ultimate MACD Super Pack". Configurations are displayed above in multiple scenarios that should be suitable for most traders. Of notable mention, I rescaled the oscillator more towards a zero mean unity scale, while still leaving the waveforms completely intact.
Features List Includes:
Dark Background - Easily disabled in indicator Settings->Style for "Light" charts or with Pine commenting
AND much, much more... you have the source!
For those of you who are new to Pine Script, this script also may help you understand advanced programming techniques in Pine and how they may be utilized in a most effective manner. I would like to see Tradingview become the go to platform for the best MACD indicators attainable with this contribution to the TV community. This is commonly what my dense intricate code looks like behind the veil, and if you are wondering why there is no notes, that's because the notation is in the variable naming. If you wish to contribute additional ideas, please do so below in the comments about all things MACD in Pine.
NOTICE: Copy pasting bandits who may be having nefarious thoughts, DO NOT attempt this, because this may violate Tradingview's terms, conditions and/or house rules. "WE" are always watching the TV community vigilantly for mischievous behaviors and actions that exploit well intended authors for the purpose of unscrupulously increasing brownie points in reputation scores. Hiding behind a "protected" wall may not protect you from investigation and account penalization by TV staff. Be respectful, and don't just throw a meaningless feature in there branding it as "your" gizmo. Fair enough? Alrighty then... I firmly believe in "innovating" future state-of-the-art indicators, and please contact me if you wish to do so.
The comments section below is solely just for commenting and other remarks, ideas, compliments, etc... regarding only this indicator, not others. When available time provides itself, I will consider your inquiries, thoughts, and concepts presented below in the comments section if you do have any questions or comments regarding this indicator. When my indicators achieve more prevalent use by TV members, I may implement more ideas when they present themselves as worthy additions. As always, "Like" it if you simply just like it with a proper thumbs up, and also return to my scripts list occasionally for additional postings. Have a profitable future everyone!

MACD Price Divergence indicatorIndicator for divergence between MACD trend and price trends. Try it out and let me know what you think!

Grimes Modified MACD Supply DemandA follower of mine asked me if I could make a version of my www.tradingview.com script using the MACD. Well it just so happens I was making a few modifications to my MACD script: just as this question came up so I went ahead and threw this together.
The MACD that triggers the SR zones is pictured below, with key trigger points encircled to illustrate how it works.
CCV MA with MACDThis is a moving average script where the color of the moving average is based on MACD.
Pink MA = Negative and falling MACD
Red MA = Negative and rising MACD
Aqua MA = Positive and rising MACD
Blue MA = Positive and falling MACD
Additionally this marks pivot highs and lows on the MACD as well as divergence points with those pivots. Black triangles will mark new highs or lows, a blue circle indicates bullish divergence formed, a red circle indicates bearish divergence formed.

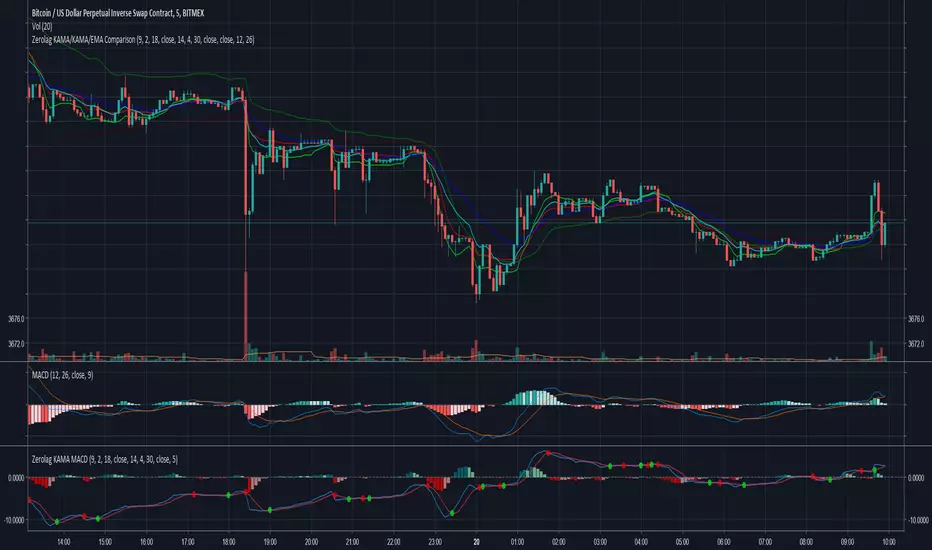
Zerolag KAMA MACDExperimental Zero Lag Adjusted KAMA based MACD.
Uses Kaufman's Adaptive Moving Average (KAMA) instead of the standard EMAs to calculate the MACD with an optional application of the zero lag adjustment.
Significant differences in momentum changes (zero line crossovers), often earlier signal line crossovers and differences in divergences.
Chart displays :
Top : Zero lag adjusted KAMA based MACD
Middle : Unadjusted KAMA based MACD
Bottom : Standard MACD
MACD Divergence added in CM_MacD_Ult_MTFYou must have missed some trading opportunities of MACD Divergence due to oversight. So I create and share this script to help u seize the chances.
This indicator is based on CM_MacD_Ult_MTF created by ChrisMoody.

Gunbot MACDgenOk this is just some strat based on MACD, checking for a few conditions until giving buy/sell signals to Gunbot via alerts.
It is generalized but if you want to go play with the values. I will continue to develop this further and am happy to receive feedback.
Notations are coming.
Usage notes:
-ONLY use this with TV_GAIN: 0.6 because on downtrends it is supposed to double up to pull down the average bought price!
-Use "buying condition" and "selling condition" for alerts, trigger on close and I suggest you use 3 min intervals but try what looks good to you
-Use this on pairs that are curvy and have atleast 0.6% gain between buy/sell triggers. This is also general advise when you want to take microprofits.
-Don't be confused with sell arrows, it will only trigger the bot sell on gain when you've set TV_GAIN
