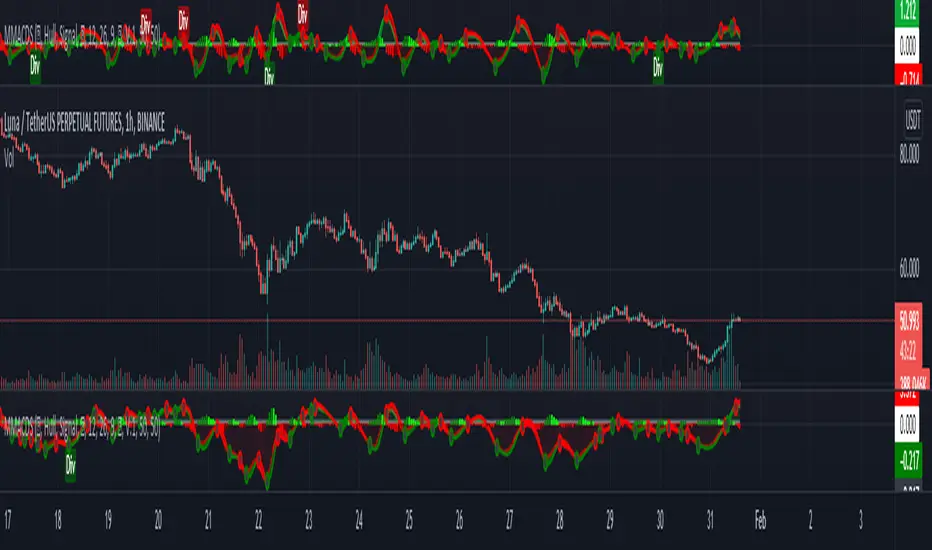
Koby's HMA MACDThis my custom MACD based on Hull Moving Average for our SNS group.
I will add other features later.
Search in scripts for "macd"

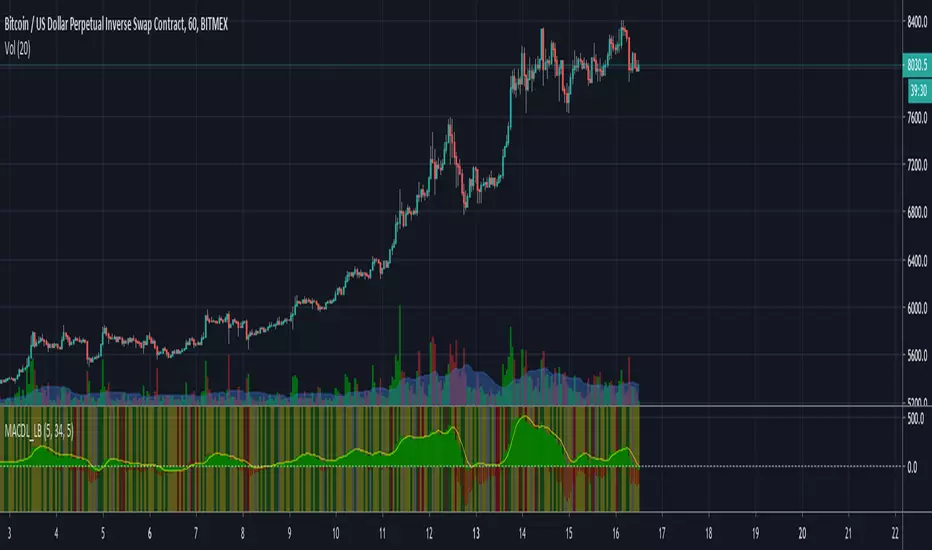
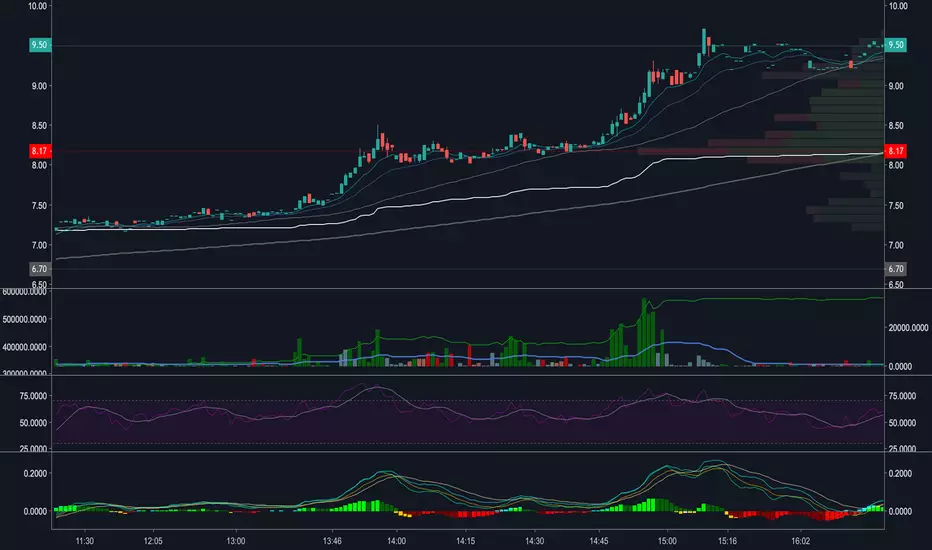
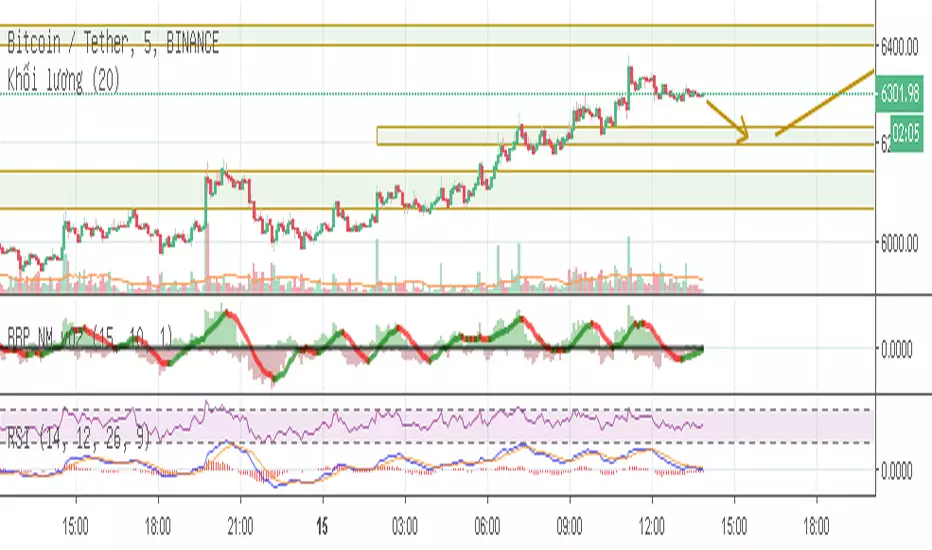
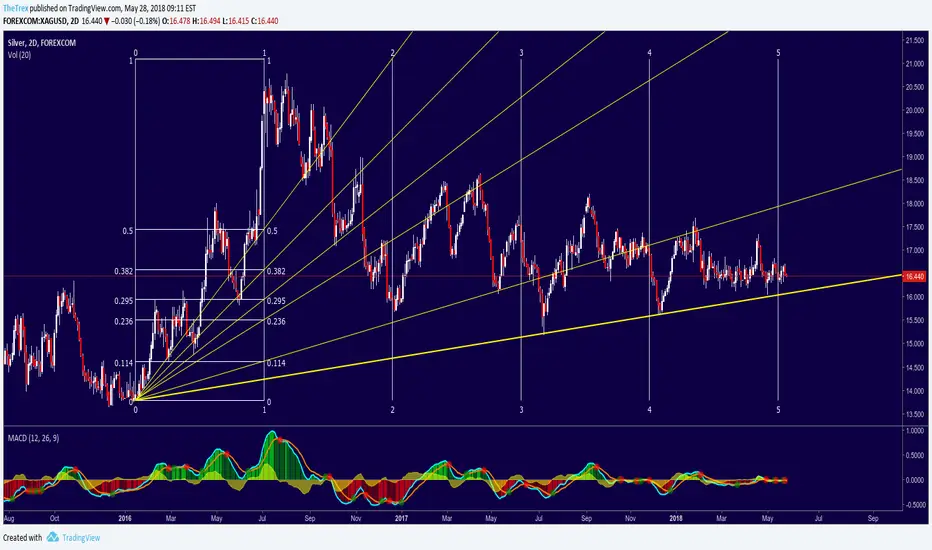
MACD LB MFIThis script includes MACD histogram plus MFI in four states
All backgrounds are compared to previous bar in +/- 10%
1. Green (green) + Volume + Range (++)
2. Fading (yellow) - Volume - Range (--)
3. False (gray) - Volume + Range (-+)
4. Crouching (red) + Volume - Range (+-)
Improved MACDImproved MACD with 12 filter to chose from including sine wave , zero lag, hull ,regression and similar . Designed for better and smoother signal generation and flexibility
Improved Multi-Timeframe (MTF) MACD - plots same as live dataThis multi-timeframe MACD uses an improved calculation to accurately calculate the indicator's value with every new bar on the time frame your chart is set to. Previously the indicator only recalculated with every new update on the timeframe used in its security function. This means that this improved script plots the real, current value of your indicator across your chosen timeframes on your chart's resolution and no longer only plots only the indicator's monthly/weekly/daily/4 hour/ect closing value on the your chart.
Input values are fixed to their default (close,12,26) configuration to make this indicator's improved calculation possible.
When using "Plot Higher Timeframe?" the script will set the indicator to only plot its value in closest larger timeframe. This option overrides the two following options. For example, when using the daily resolution, only the weekly value will plot, or when using the one hour (60m) resolution, only the 4 hour (240m) value will plot.
The "Omit Higher Timeframes?" option will set the indicator to only plot starting from the 1/2/3/4/5/6/7th closest larger timeframe. For example, when using the daily resolution and this option set to 0, all values from the weekly resolution and up will plot, but if set to 1, all values from the monthly resolution and up will plot instead.
The "Plot Yearly/Quarterly/Monthly/Weekly/Daily/4 Hour/1 Hour/15 Minute/5 Minute?" options allow enabling/disabling a specific timeframe. All are enabled by default. For example, if you do not want the yearly value of the indicator to ever plot, you can disable the "Plot Yearly?" option.
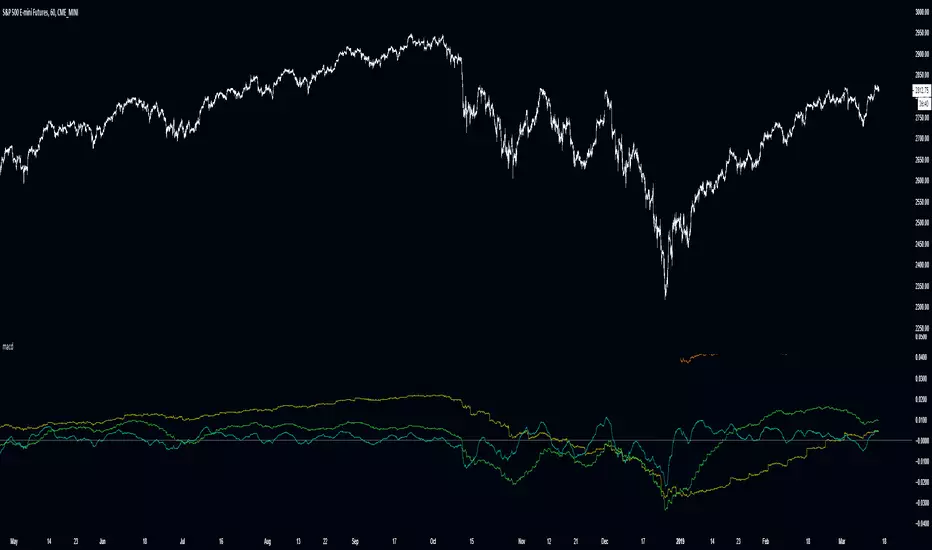
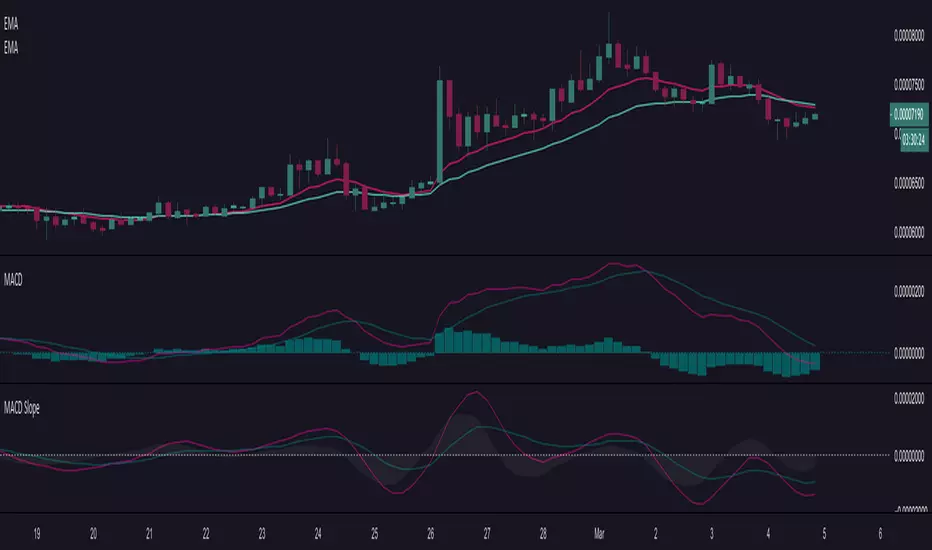
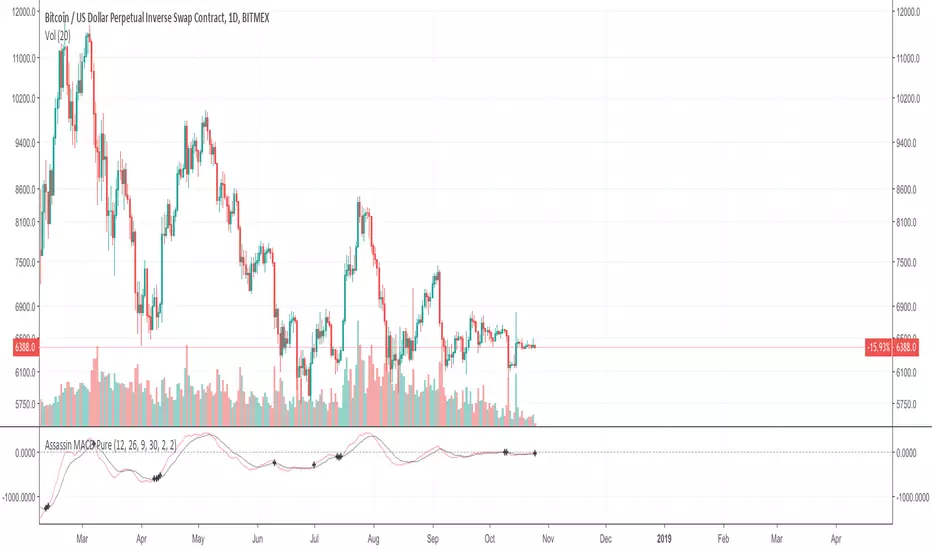
MACD SlopeShows slopes of macd line, signal line and histogram. A negative and rising slope shows improvement within a downtrend. A positive and falling slope shows deterioration within an uptrend.
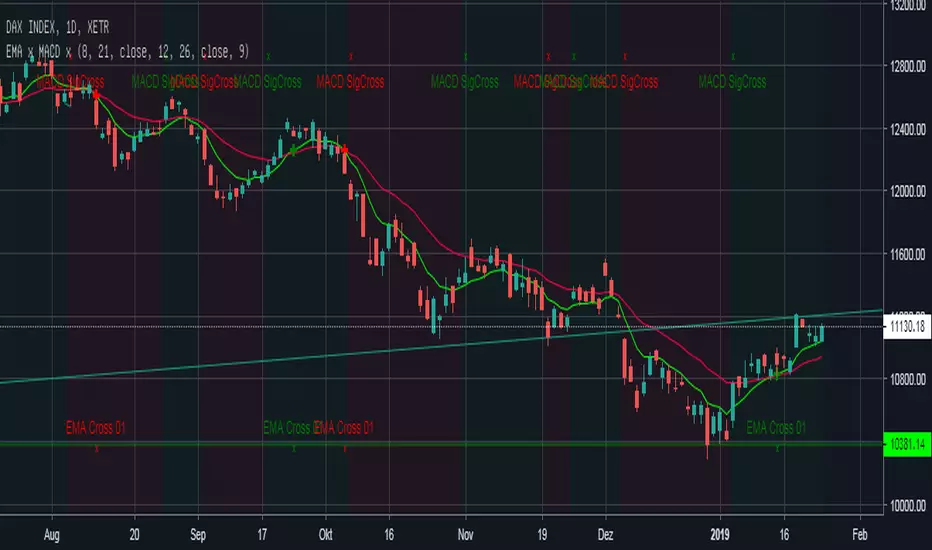
EMA Cross + MACD Signal Cross overlay Einfacher EMA-Cross Indikator mit Indikation der Crosses auf EMA-Linie und am Chart-Bottom +
MACD-Cross wird default an: location.top angezeigt zusätzlich zeigt die Hintergrundfarbe an ob der MACD über (grün) oder unter (rot) seinem Signal liegt.

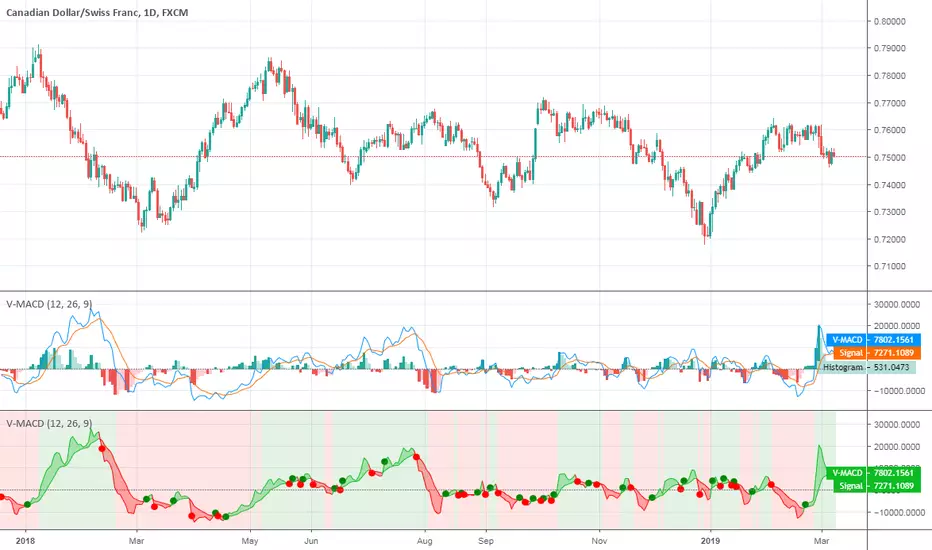
V-MACDHello traders!
This is a variation of classical MACD that uses volume instead of price.
Like and follow for more cool indicators!
Happy Trading!
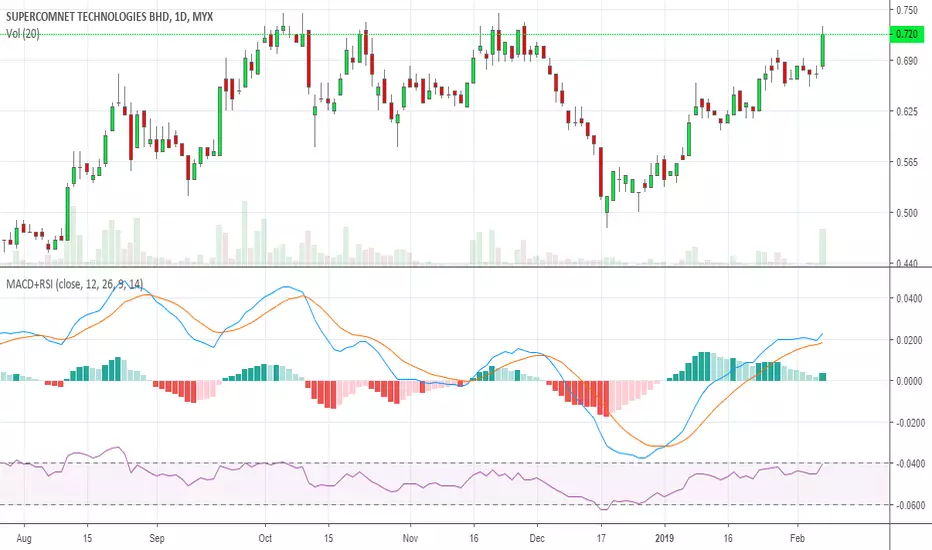
Dual MACDI like the Dual MACD for detecting moves a bit earlier. I use the standard MACD for actual confirmation.
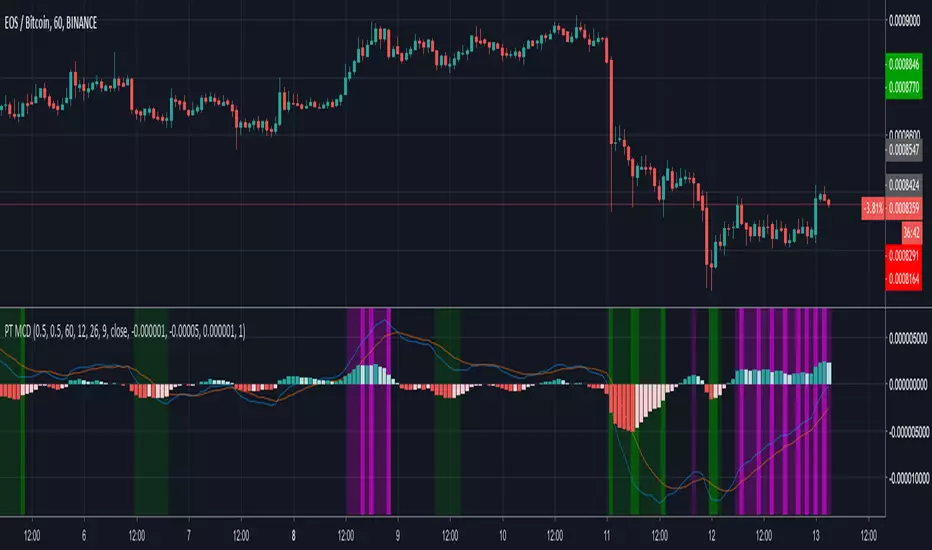
[ProfitTrailer] MACD StudyProfitTrailer buy/sell study for MACD strategy.
The script highlights the region where trailing is most likely to succeed.

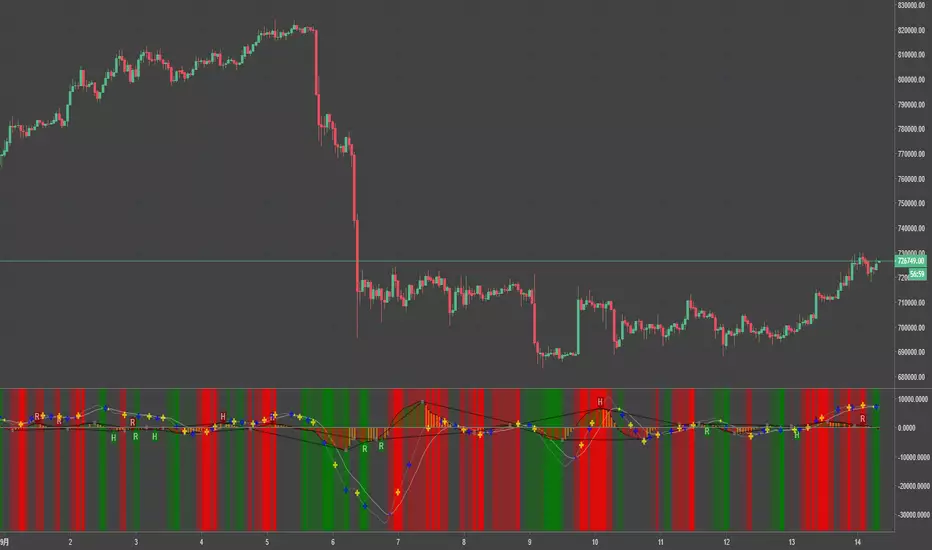
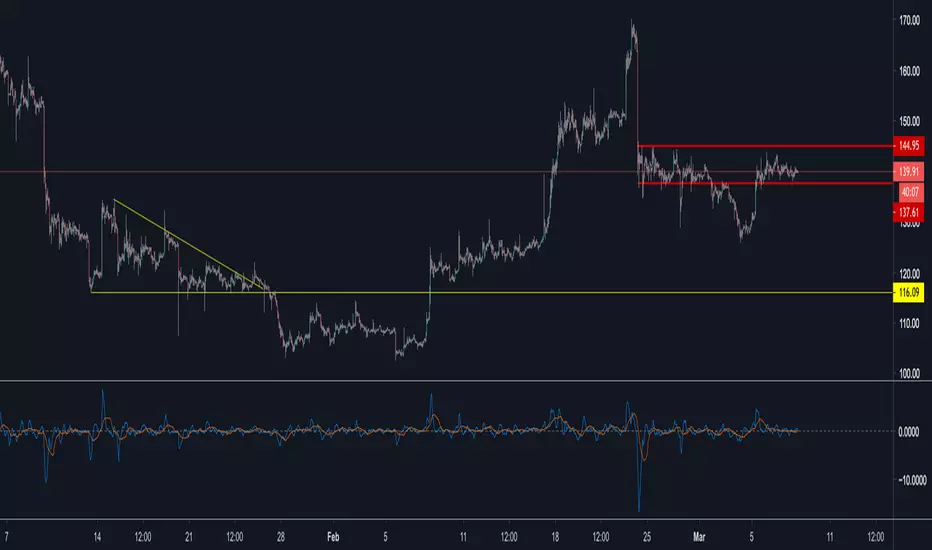
MACD/Histogram Divergence ToolThis MACD/Histogram indicator helps me to identify divergences and crosses without much effort.
The MACD line is green during a positive cross, and red during a negative.
My favourite feature is the following: when the histogram changes direction, the histogram bars become yellow, which should help you locate divergences without straining yourself.
Example: Upticking (Green) histogram begins to downtick, turns Yellow. Downticking (Red) histogram begins to uptick, turns Yellow as well.

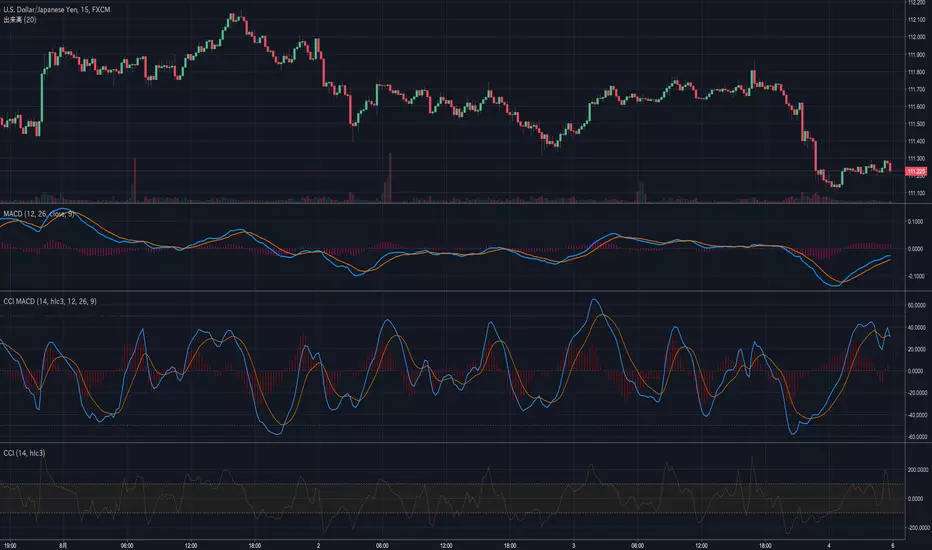
CCI MACDWe usually use closing prices for MACD calculations.
However, this indicator is calculated using CCI.
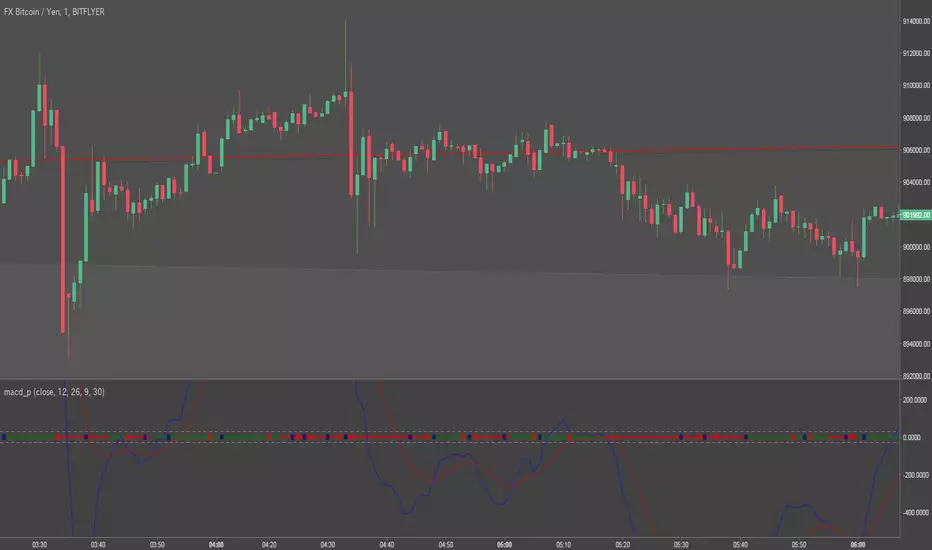
macd penpenplot macd top/bottom(red/navy circles on 0 line)
you can change filter line on config
default filter 30
0 line's color is HIST
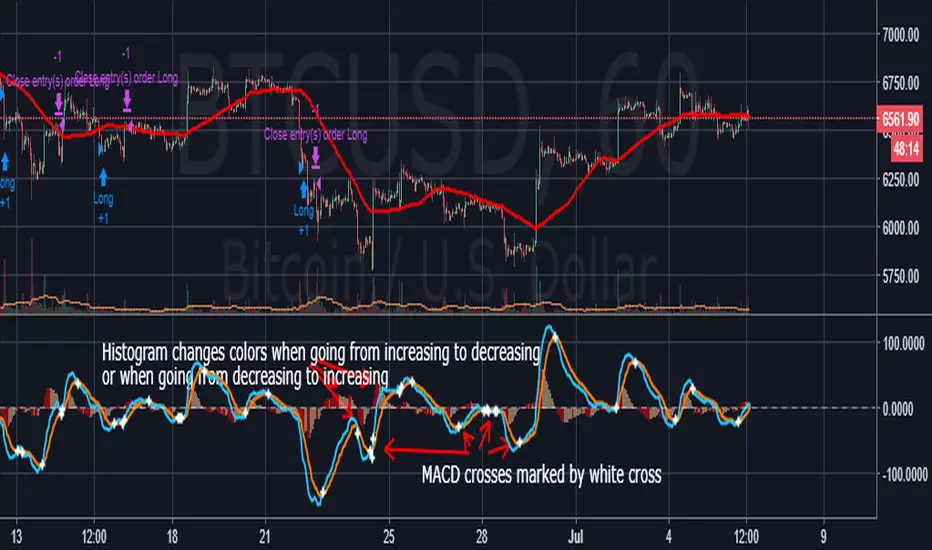
Better MACD with clearer cross and histogram signalsSimple but much needed visual improvements to the default MACD script. First, every time the MACD and signal cross, a white cross is placed on he chart, which lets you quickly identify the crosses. Second, whenever the histogram goes from increasing to decreasing or from increasing to decreasing, a color change occurs. Colors can be customized under "Style" tab under settings.

MacD with Bollinger BandsAnother MacD indicator with Bollinger Bands, this version includes the histogram, and you can enable/disable the breach, and I advise unchecking the upper/lower boxes for the Bollinger Bands, as this creates a crush effect on the bands of the MacD and the signal
