Search in scripts for "macd"

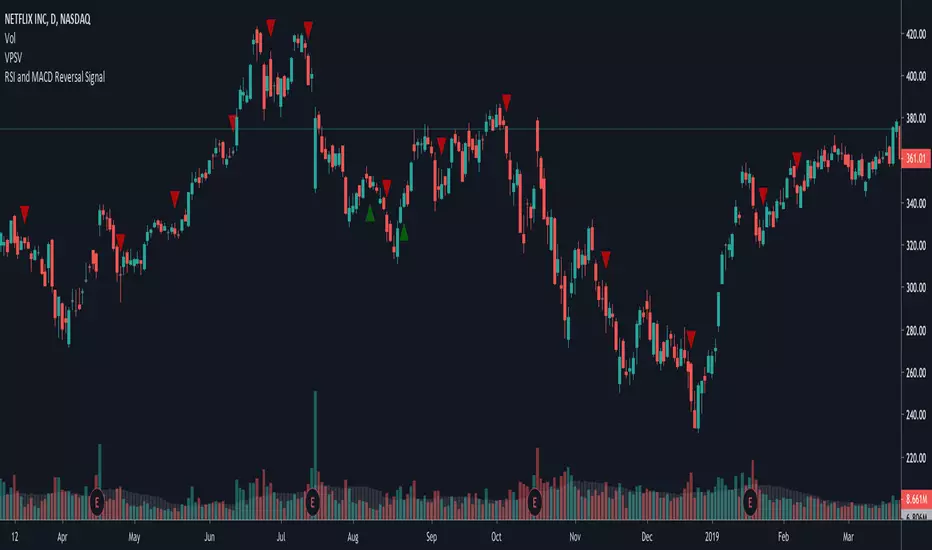
~RMCF~ RSI and MACD Reversal SignalFor AkibaDeep. Checks if RSI < 30 recently and if MACD diverges, placing a buy signal. Then, places a sell signal when MACD converges back.

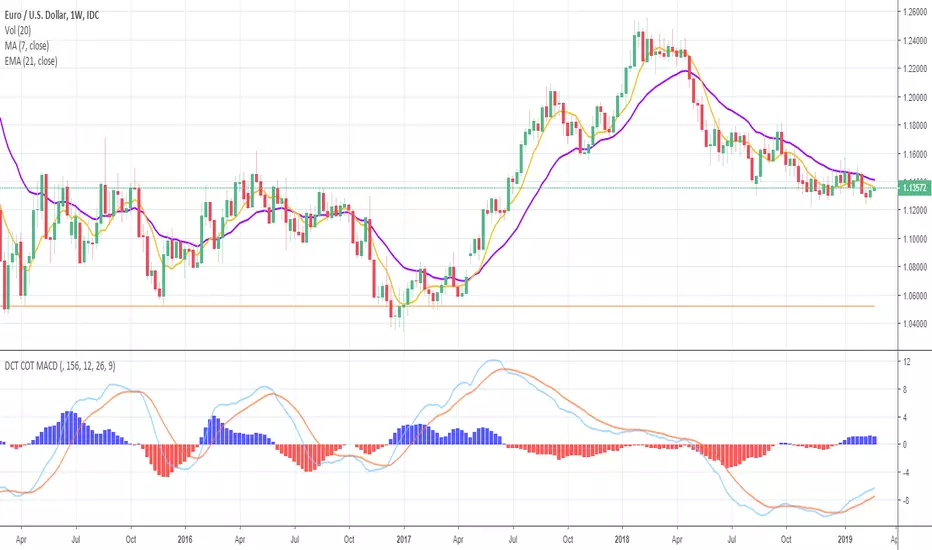
Deckchair Trader COT MACDPlots the COT MACD from the legacy report data from Quandl. Plots the commercial, non commercial and non reportables. Each plot can be hidden as needed.
I've tried to capture the basic dollar based currencies and the futures such as corn , wheat , rice, oil , hogs etc. The symbols required a little translation to match what Quandl is expecting but I think I got most of them. Please let me know of any issues with these.
Part of a suite of COT related indicators based on the excellent book "the commitment of traders bible" by Stephen Briese.
Feb 26, 2018
Release Notes: Quandl have changed their codes :( now they seem to be using the CFTC Id's where are numeric (and can be found in the dump you get from them)
So whereas before for example, GBPUSD was mapped to BP it is now mapped to 096742.
I have gone through the various dumps and tried to map all the symbols I was using, the currency were the easy ones, the wheat, corn etc a little harder to trade down due to variations.
Please let me know if different
Thanks
Tim Titchmarsh
DeckchairTrader
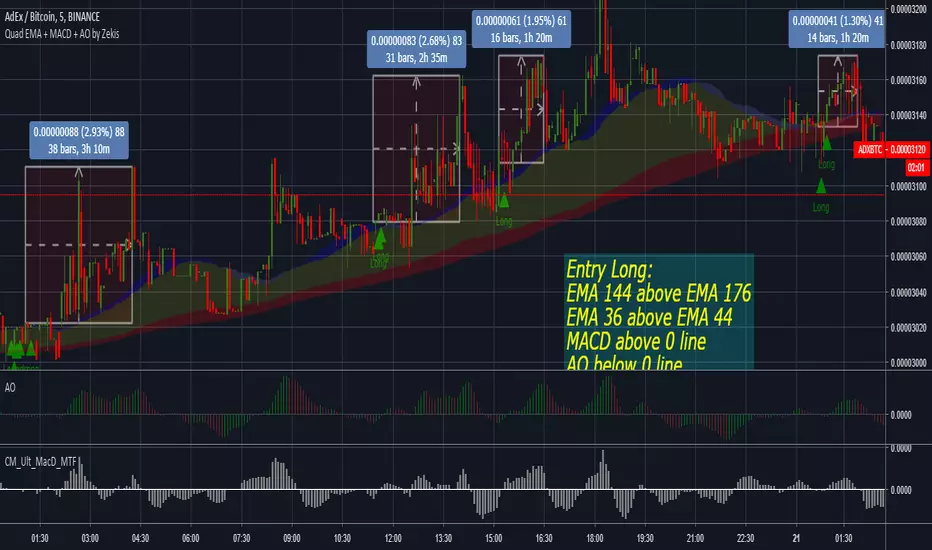
Quadruple EMA + MACD + Awesome Oscillator by ZekisThis strategy is based on quadruple EMAs, MACD and Awesome Oscillator, developed by Nenad Kerkez and simplified by me.
Scalping strategy (lower time frames)
Entry Position
Before we take a buy trade the two above criteria must be met. The 144 EMA must be above the 176 EMA and the 36 EMA must be above the 44 EMA. We then wait for AO to fall below the 0. The final „trigger‟ to the entry is when the MACD closes above the 0 line.
Sell trade is vice versa. 36 EMA must be below 44 EMA and 144 EMA must be below 176 EMA.
TAKE PROFIT and STOP LOSS
10-40 pips. Pivot Point targets.
STOP LOSS above/below last highest high
Enjoy!
@Zekis
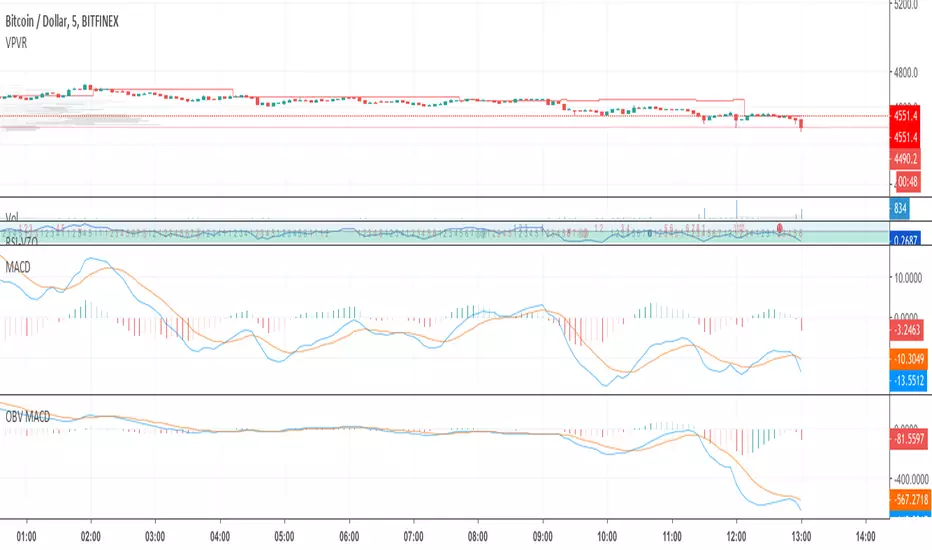
OBV MACDOBV MACD paints a different picture from traditional MACD on low and high (not intermediate) timeframes.
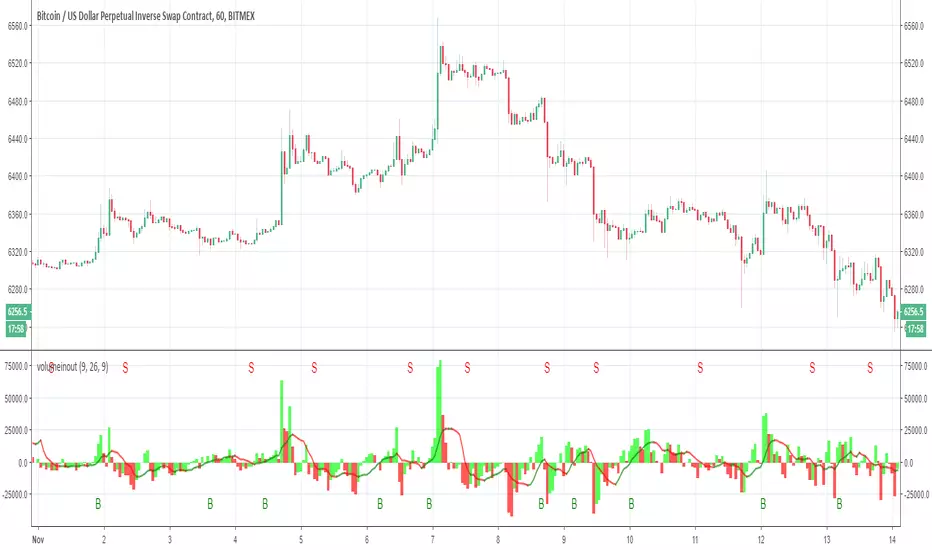
Volume in out as MACD with alerts Lets make the Volume in out as MACD
with alerts (B =buy) S=sell
have fun
BNG MACD / Blue and Green MACDJust publish it again so it's easier to search this indicator.
Just inspired from macd 4c.
I changed it to blue and green color so it's looks better.

MACD Volume Weighted and LeaderMACD+Leader MACD+Volume Weighted MACD
price tend to follow the leader/volume, look at price history to get an idea how it's works.
//all credits go to Lazybear,ChrisMoody.

RSI-cumulative net volume as MACDSo here in this model I take the RSI-cumulative net volume and convert it to MACD
I think it look nicer then original but it just idea:)
for different time frame just change setting:)
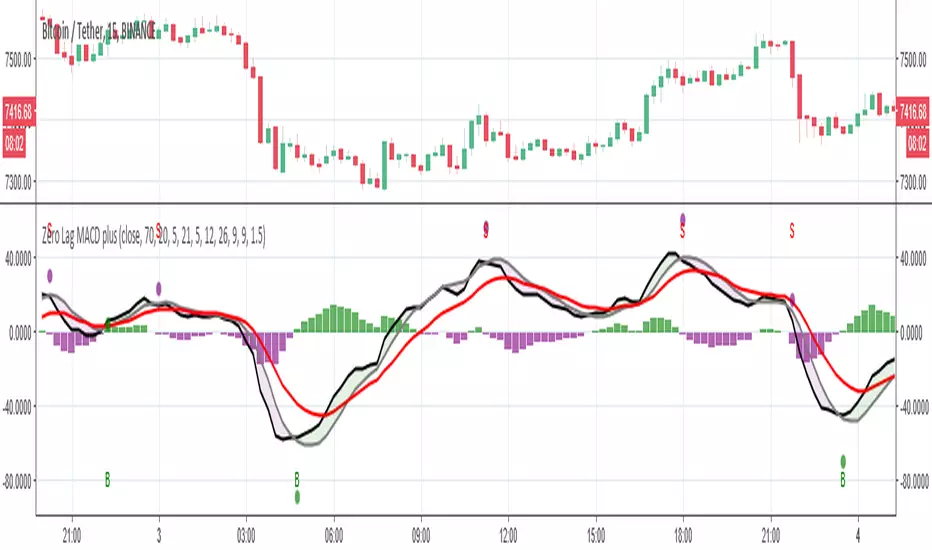
Zero Lag MACD plus
using Alberto Carlos Zero lag MACD we can make it much more better with the volume indicator
alerts inside
have fun
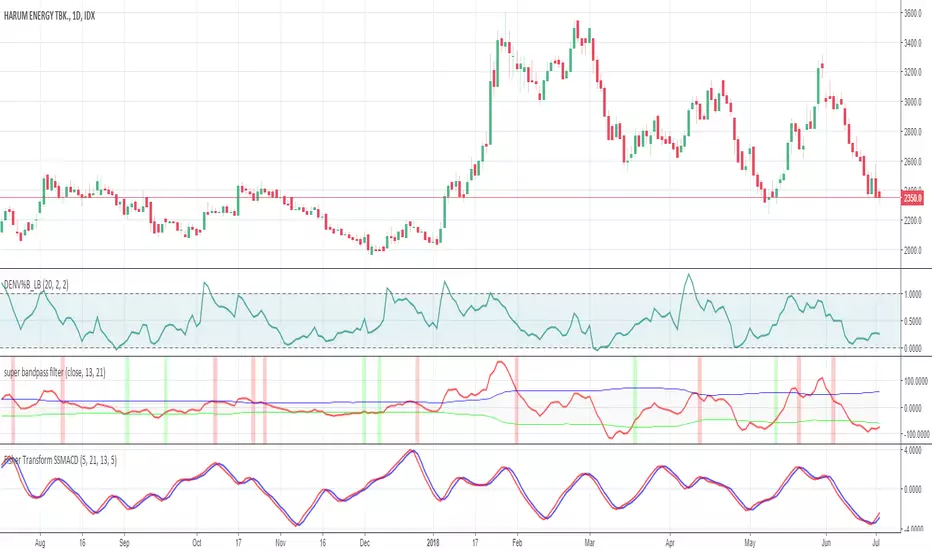
Fisher Transform SuperSmoothed MACD // This is a modification of Supersmoothed MACD (created by KIVANC using EHLERS' SUPER SMOOTHER FILTER) and sharpenned with Ehler fisher transform
//all lengths and parameters are completely configurable, tune the length according to your instrument
//give me what you think
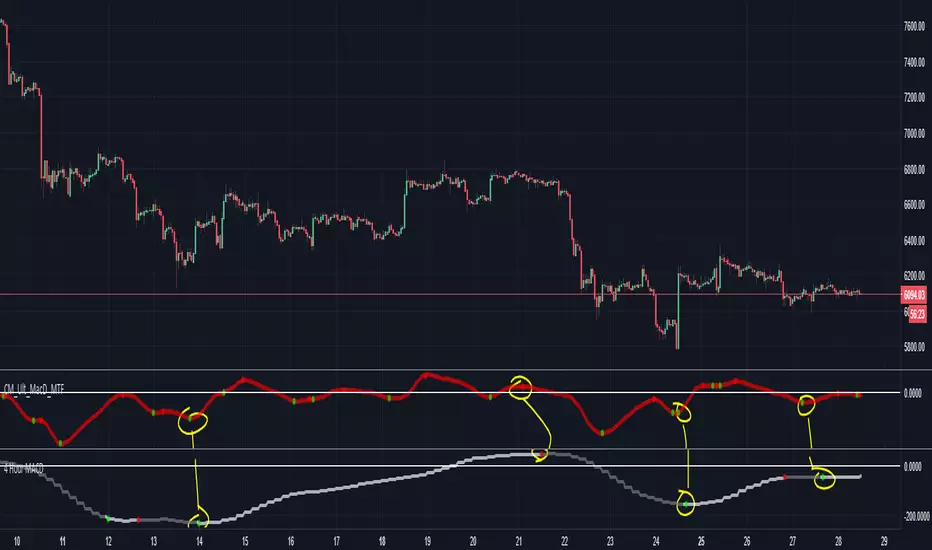
4 Hour MACD, Signal Line OnlyI call this my "anchor line" to show me the general direction of where bitcoin -0.51% is going on any given day.
Whether you are trading on 5m, 30m, 1h, this can provide you reinforcement for your directional bias (bullish/bearish)
I like to use this in place of a 50EMA or 200EMA to find the general direction of the trend, because it more precisely captures the fast rallies and dumps
Goes hand in hand with my "Dual Time Frame Momentum Strategy"
Disable the MACD line once you turn it on
Original credits go to ChrisMoody
stoch RSI-plus-macdThis stoch rsi plus , signal are based on rsi crossing at specific moments (green up) and sell based on stoch cross down (in red ) plus MACD to show the validity of the buy or sell points

MACD [Moving Average Convergence/Divergence]MACD rendered as candles to make it easier on the eyes. Candles are hollow when the MACD line moves opposite direction of the trend, which can signal a weakening trend.

BD 4EMA RSI/MACD SIGNAL V1this chart allows 4 moving averages and gives a signal for macd cross over up and down as well as RSI oversold - purple - and overbought -yellow - all in 1 indicator.

Cryptocurrents MACD w/ Bollinger BandsThis indicator shows MACD and its Bollinger Bands. By default divergence and Bollinger Band width is also displayed.
To display only MACD, its signal line and Bollinger Bands, go to this indicator's "Settings" > "Style" and untick all unwanted features.
MACD DEMA with signalsMACD sinyal üretirken 10-15 dakikalık bir delay'e sahip. Hayırsever bir vatandaş MACD ile DEMA'yı birleştirerecek bu gecikmeyi nötr hale getirmiş. Ben de sinyalleri gösteren küçük noktalar ekledim
www.tradeciety.com
stockcharts.com

MACD DEMA with signalsMACD sinyal üretirken 10-15 dakikalık bir delay'e sahip. Hayırsever bir vatandaş MACD ile DEMA'yı birleştirerecek bu gecikmeyi nötr hale getirmiş. Ben de sinyalleri gösteren küçük noktalar ekledim
www.tradeciety.com
stockcharts.com

Ultra MACD [DW]This is a variation of Gerald Appel's MACD with seven moving average source types to choose from.
The MA types I've included in this script are:
- Kaufman's Adaptive Moving Average
- Geometric Moving Average
- Hull Moving Average
- Volume Weighted Moving Average
- Least Squares Moving Average
- Arnaud Legoux Moving Average
- Exponential Moving Average
Custom bar color scheme is included with two different colorization methods - one based on the MACD, and the other based on the histogram.

MACD represent up/down by green/red bars. MACD modified macd line to histogram and show up/down momentum by use green and red color.
