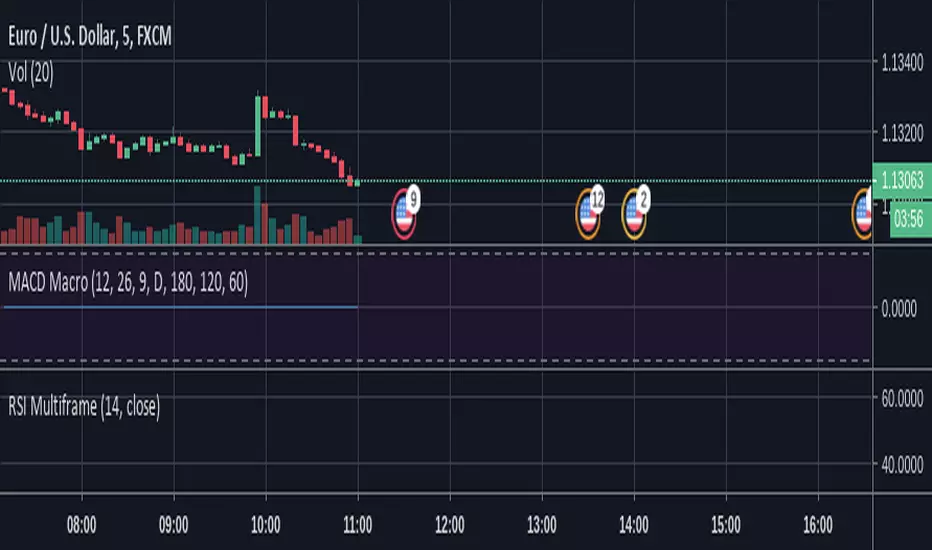
Rob RSI Stoch MACD Combo Alert//Created by Robert Nance on 5/28/16. Additional credit to vdubus.
//This was a special request from rich15stan. It combines my original RSI Stoch extremes with vdubus’ MACD VXI.
//This script will give you red or green columns as an indication for oversold/overbought,
//based upon the rsi and stochastic both being at certain levels. The default oversold is at 35.
//If Stochastic and RSI fall below 35, you will get a green column. Play with your levels to see how
//your stock reacts. It now adds the MACD crossover, plotted as a blue circle.
Search in scripts for "macd"
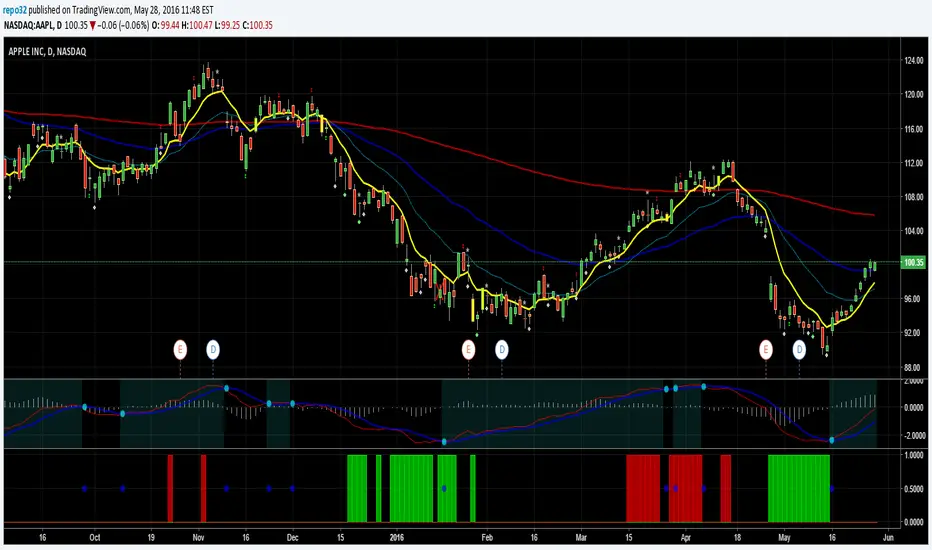
[RS]MACD Divergence V0EXPERIMENTAL:
MACD Divergence detection.
looks like macd is more prone for missing the extremes in price then the rsi due to lag.

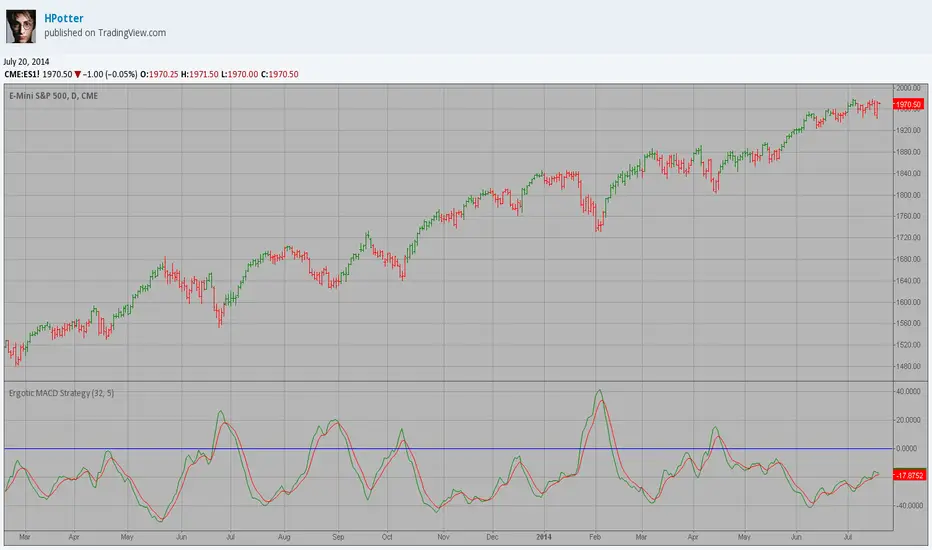
Ergotic MACD Strategy This is one of the techniques described by William Blau in his book
"Momentum, Direction and Divergence" (1995). If you like to learn more,
we advise you to read this book. His book focuses on three key aspects
of trading: momentum, direction and divergence. Blau, who was an electrical
engineer before becoming a trader, thoroughly examines the relationship
between price and momentum in step-by-step examples. From this grounding,
he then looks at the deficiencies in other oscillators and introduces some
innovative techniques, including a fresh twist on Stochastics. On directional
issues, he analyzes the intricacies of ADX and offers a unique approach to help
define trending and non-trending periods.
Blau`s indicator is like usual MACD, but it plots opposite of meaningof
stndard MACD indicator.
Ergotic MACD This is one of the techniques described by William Blau in his book
"Momentum, Direction and Divergence" (1995). If you like to learn more,
we advise you to read this book. His book focuses on three key aspects
of trading: momentum, direction and divergence. Blau, who was an electrical
engineer before becoming a trader, thoroughly examines the relationship
between price and momentum in step-by-step examples. From this grounding,
he then looks at the deficiencies in other oscillators and introduces some
innovative techniques, including a fresh twist on Stochastics. On directional
issues, he analyzes the intricacies of ADX and offers a unique approach to help
define trending and non-trending periods.
Blau`s indicator is like usual MACD, but it plots opposite of meaningof
stndard MACD indicator.

MACD Divergence SystemMACD Divergence SystemMACD Divergence SystemMACD Divergence SystemMACD Divergence System

MACD 4H Cross Above Zero AlertMACD 4H Cross the signal line to screen for stocks across a wide demo list

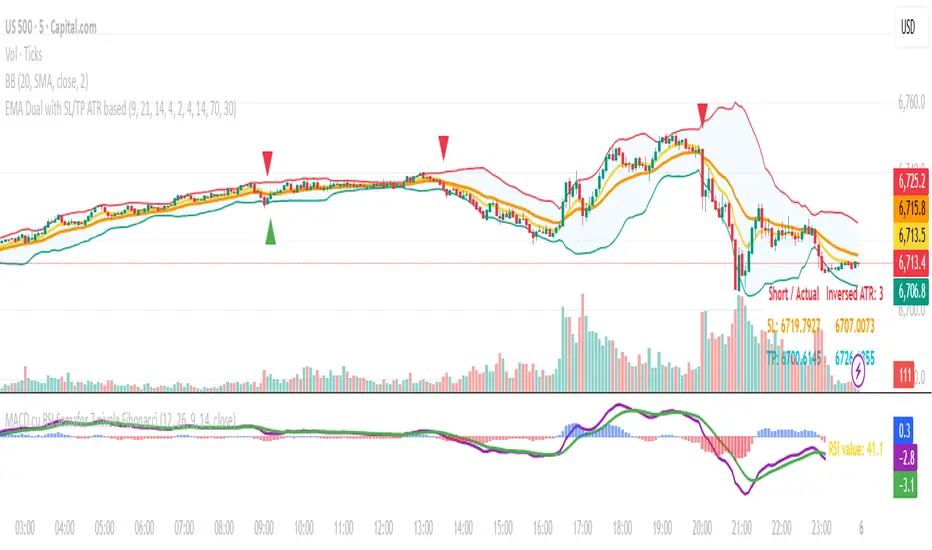
MACD cu RSI 7 Fibonacci color levelsMACD with RSI info
The RSI is display as value with changing color as Fibonacci levels.
MACD with RSI color 7 Fibonacci levelsMACD that contain RSI info
The color of RSI is change accordingly with Fibonacci levels, from red till green

MACD + Supertrend + VWAP (Filtered with Background)MACD + Supertrend + VWAP (Filtered with Background)

Macd 6 timeframes ( include chart time with histogram) AboSary 15min, 1h, 4h, D, W, (chart time) + Histogram
All can be show or hide by you and change colors :)
ماكد يشمل 6 فواصل زمنية 15د، 1ساعة، 4ساعات, يوم، اسبوع بالاضافة الى مكاد للفاصل المستخدم بالشارت ايضاً هيستوغرام لنفس الفاصل المعروض في الشارت
مثال لو وضعت نصف ساعة تجد مكاد نص ساعة والهستوغرام كذلك نصف ساعة
جميع الخيارات يمكنك اغلاق اي منها وتغيير الوانها
MACD RibbonMACD Ribbon is created from my personal observation to XAUUSD price movement in very small timeframes such as M1 or M5.
It is used to indicate possible price reversal point.

MACD+RSI by NiksMACD and RSI combined in one indicator. This is to allow you to add more than 3 indicators in free version of Trading view


macZLSMAMacd that shows instantaneous trend using ZLSMA. This crossover has the ability to reveal trend directions before it happens.


MACD Luckscout versionMACD Luckscout version
How to use :
We should look for divergence and/or convergence.