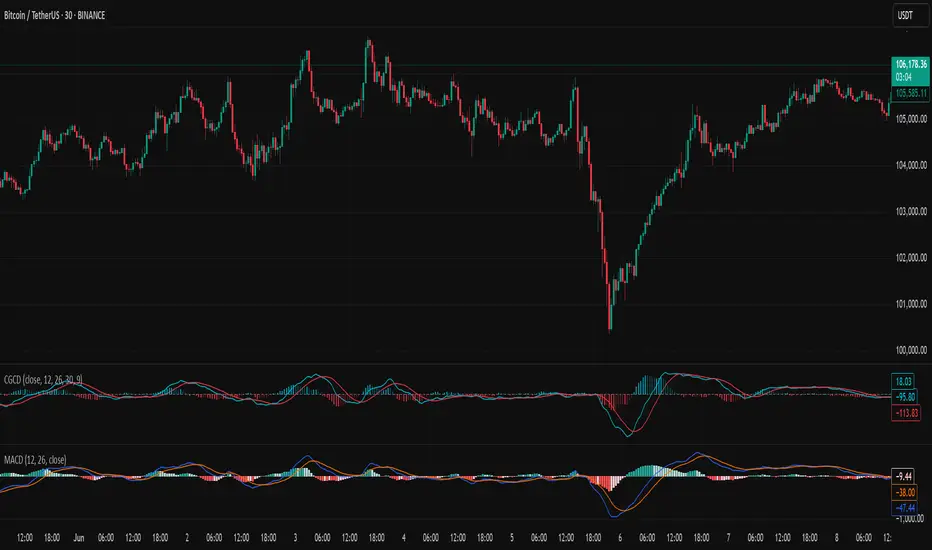
Chebyshev-Gauss Convergence DivergenceThe Chebyshev-Gauss Convergence Divergence is a momentum indicator that leverages the Chebyshev-Gauss Moving Average (CG-MA) to provide a smoother and more responsive alternative to traditional oscillators like the MACD. For more information see the moving average script:
How it works:
It calculates a fast CG-MA and a slow CG-MA. The CG-MA uses Gauss-Chebyshev quadrature to compute a weighted average, which can offer a better trade-off between lag and smoothness compared to simple or exponential MAs.
The Oscillator line is the difference between the fast CG-MA and the slow CG-MA.
A Signal Line, which is a simple moving average of the Oscillator line, is plotted to show the average trend of the oscillator.
A Histogram is plotted, representing the difference between the Oscillator and the Signal Line. The color of the histogram bars changes to indicate whether momentum is strengthening or weakening.
How to use:
Crossovers: A buy signal can be generated when the Oscillator line crosses above the Signal line. A sell signal can be generated when it crosses below.
Zero Line: When the Oscillator crosses above the zero line, it indicates upward momentum (fast MA is above slow MA).When it crosses below zero, it indicates downward momentum.
Divergence: Like with the MACD, look for divergences between the oscillator and price action to spot potential reversals.
Histogram: The histogram provides a visual representation of the momentum. When the bars are growing, momentum is increasing. When they are shrinking, momentum is fading.
Search in scripts for "macd"
Moonhub Cycle IndexMoonhub Cycle Index is a composite index derived from three popular technical analysis indicators: Moving Average Convergence Divergence (MACD), Schaff Trend Cycle (STC), and Detrended Price Oscillator (DPO). The indicator is designed to help identify potential trends and market sentiment by combining the unique characteristics of each indicator.
Key components of the indicator include:
Input Parameters:
COEMA Length (len_DIema): The length of the Exponential Moving Average (EMA) applied to the Custom Index. Default is set to 9.
COSMA Length (len_DIsma): The length of the Simple Moving Average (SMA) applied to the Custom Index. Default is set to 30.
Indicators:
MACD: A momentum oscillator that shows the relationship between two moving averages of a security's price. It is calculated using the difference between the 12-period and 26-period EMA, and a 9-period EMA (signal line) of the MACD.
STC: A cyclic indicator that identifies cyclical trends in the market. It is calculated using the Stochastic oscillator formula applied to the close, high, and low prices over a 10-period lookback window.
DPO: A price oscillator that eliminates the trend from price data to focus on underlying cycles. It is calculated using a custom function that shifts the price by half the length and subtracts the SMA from the shifted price.
Custom Index: The composite index is calculated by taking the average of the MACD line, STC, and DPO.
COEMA and COSMA: Exponential and Simple Moving Averages applied to the Custom Index using the lengths specified by the input parameters (len_DIema and len_DIsma).
Plots: The Custom Index, COEMA, and COSMA are plotted with different colors and line widths to visualize their interaction and provide insights into potential market trends.
This Custom Index Indicator can be useful for traders who want to analyze the market using a combination of these indicators to make more informed decisions. It can also help identify potential trends and market sentiment by combining the unique characteristics of each indicator.

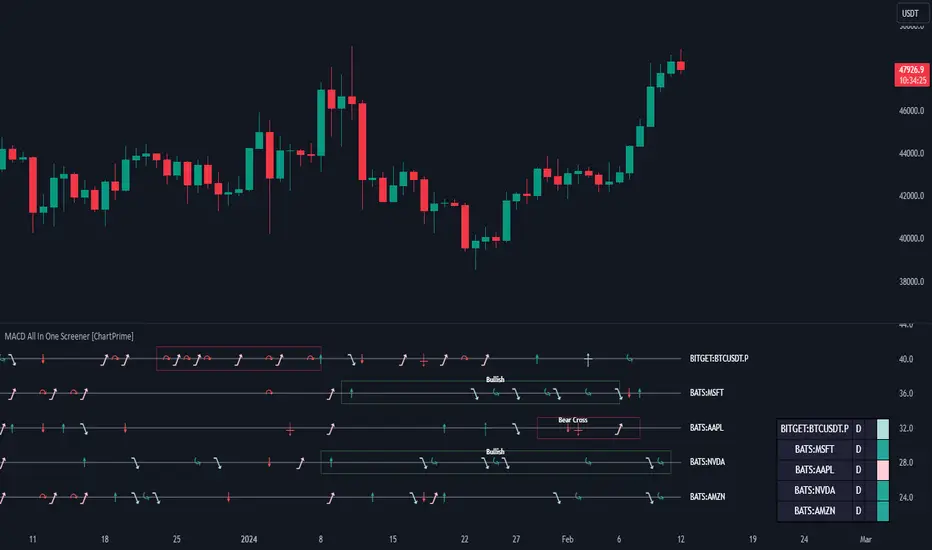
MACD All In One Screener [ChartPrime]INTRODUCTION
MACD All In One Screener (ChartPrime) is a multi instrument, multi timeframe indicator designed to provide traders with a comprehensive solution to monitoring the market. This indicator is designed to be easy to use and visually appealing while also being highly flexible and feature rich. Users can pick up to 10 symbols not including the chart's symbol and set up alerts for many different signals that the MACD produces. One standout feature of this indicator is its ability to display not only each symbol individually as a MACD but you can also view its chart from within this indicator. This removes the need to flip between symbols to see the price action for your basket.
On top of that we have designed this indicator to be friendly with "indicator on indicator" by providing outputs for all of the standards of price that users may want. Included is an overview section that shows all of the symbols signals symbolically over time. Additionally we have included a table for easy monitoring. This table includes the symbol, its timeframe, the current alert, and its histogram state. To make things as user friendly as possible we have also included rich error handling that tells you exactly what is wrong with your configuration.
HOW TO USE
To use this indicator, simply add it to your chart and navigate to the settings. From there select the symbols you want to monitor and the timeframes you want to use. Next you want to navigate down to the alerts section to select the what alerts you want to receive, and what symbols you want to get alerts for. Finally, you wan to create your alert using "Any alert() function call". Now your screener is all set up!
OVERVIEW OF INPUTS
View allows you to select what the indicator currently displays. You can pick from any one of the selected symbols, an overview of all of the symbols, or simply nothing. If you want to only use the table, "None" is provided so you can move the indicator into the chart panel.
View Toggle lets you pick from displaying the MACD for the selected symbol or the Price Action as a candle chart. To see your "indicator on indicator" you will have to select a symbol from the view list. There is a bug where if you select "Overview" while you are using "indicator on indicator" your added indicator will see the last symbol you viewed. To fix this, simply change the setting of your overlaid indicator and it will correct its self.
History Length is the number of historical bars to calculate over. This feature is here to prevent the indicator from breaking due to uneven historical data between the symbols.
Show Price Line toggles a dotted line that follows the current symbols closing price when "Price" is selected under the "View Toggle" dropdown.
Show Symbol Label toggles a label that displays the current symbols name and timeframe. This only impacts the single symbol view.
Overview Label Color adjusts the color of the symbol labels for both overview and single symbol view.
MA Type lets you pick what kind of moving average you want to use for the oscillator or signal. You can pick from the standard SMA or EMA.
Fast Length is a standard input for MACD. This lets you pick the period of the fast MA.
Slow Length , just like Fast Lenght, is a standard input for MACD. This lets you pick the period of the slow MA.
Signal Length is another standard input for MACD. This lets you configure the period of the signal MA.
MACD Cross Overlay Icon is a toggle to display MACD crosses when viewing a single symbol's MACD. When the MACD has a bullish cross it will plot a bullish dot, and when it has a bearish cross it will plot a bearish dot. This is purely visual.
Regular Bullish and Bearish toggles the visual display of the divergences on the single symbol view. This does not effect the indicators ability do send alerts.
Divergence Look Right adjusts the number of bars into the future to look for confirmation of a signal. This directly impacts lag but enhances stability.
Divergence Look Left adjusts the number of bars into the past to check for a signal. A longer period will filter out smaller moves
Maximum Lookback adjusts the maximum size of a divergence.
Minimum Lookback adjusts the minimum size of a divergence.
Divergence Drawings picks how you want to visualize the divergence. You can pick from displaying it as a line, a label, or both.
Enable Table toggles the overview table. When enabled it will show you the enabled symbols and their current state. From left to right: symbol name, timeframe, current alert, and histogram state.
Position picks where on the chart you want the table to be.
Text Color adjusts the text color of the table.
BG Color adjusts the background color of the table.
Frame Color adjust the frame color of the table.
Current Symbol Time Frame adjusts the timeframe of the chart's symbol.
Symbol 1 - 10 pick "Symbol's" symbol and timeframe. To use higher timeframes, the symbol's have to be the same type. You can't have a crypto and a stock using HTF at the same time as they don't have the same sessions and will result in an error. You can use unsafe mode (as described below) to potentially get around this.
Enable Symbol when enabled it will give you alerts for the symbol. This also enables the symbol in the overview. If this is disabled it won't send alerts, and it will not show up in overview, or the table.
Wait for Close enables waiting for the bar to close before printing an alert.
Alert Symbol Size picks what size you want the overview symbols to be.
Enable Cross Over 0 Alert: MACD crosses over the 0 line.
Enable Cross Under 0 Alert: MACD crosses under the 0 line.
Enable MACD Cross Bullish Alert: Bullish MACD cross.
Enable MACD Cross Bearish Alert: Bearish MACD cross.
Enable Histogram Bullish Turn Alert: MACD begins to turn bullish but hasn't crossed.
Enable Histogram Bearish Turn Alert: MACD begins to turn bearish but hasn't crossed.
Enable Histogram Bullish Continuation Alert: MACD is in a bullish cross state and it was declining but began rising again.
Enable Histogram Bearish Continuation Alert: MACD is in a bearish cross state and it was rising but began falling again.
Enable Bullish/Bearish Divergence Alert enables divergence alerts. Divergences are lagging, especially on a higher timeframe. These alerts will also tell you the time in the past when the divergence occurred.
Color Section is provided to allow for personalization of the indicator. Everything can be adjusted here.
Disable Error Checking: Only enable this if you want to bypass the built in error checking. This will enable 'Safe Requesting'. Safe Requesting will only request enabled symbols and you will not be able to view symbols that are not enabled in this mode. Only use this if you want to mix symbol types and you know it will work. (An example would be viewing stocks and SPY at the same time.)
CONCLUSION
The MACD All In One Screener (ChartPrime) is a versatile indicator designed to monitor multiple symbols across various timeframes. The flexibility in customization, from MACD settings to visual alerts and table presentations, allows users to tailor the screener to their needs and preferences. We hope you find this as useful and interesting as we do and wish you good luck in the market!
Enjoy
MACD VisualA quick way to visualize the status of the MACD: positive or negative, rising or falling. Also plots a projection of the next candle's EMA values for the MACD. This is only an estimate and will only be finalized upon candle close. You can also extend the lines to see where they may cross based on current trajectories.

MACD Multi-Timeframe K2Indicator Description: MACD Multi-Timeframe K2
Important! it works best when all timeframes except 1M and 1W on the daily chart are included.
Review
"MACD Multi-Timeframe K2" is a Pine Script v5 indicator designed to monitor convergence crossings and divergences of moving averages (MACDs) on multiple timeframes simultaneously. It provides visual signals on the chart and a dynamic table to help traders identify when the MACD conditions match on selected timeframes, indicating potential bullish or bearish opportunities. This superimposed indicator is ideal for traders who use multi-time frame analysis to confirm trends or reversals.
How it works
MACD calculation : For each timeframe, the indicator calculates the MACD using three components:
Fast EMA : short-term exponential moving average (default length: 12).
Slow EMA : long-term exponential moving average (default length: 26).
Signal line : 9-period EMA of the MACD line (fast EMA - slow EMA).
Crossover detection :
A bullish signal occurs when the MACD line crosses the signal line from bottom to top.
A bearish signal occurs when the MACD line crosses the signal line from bottom to top.
The logic of working with multiple timeframes: the indicator checks the MACD intersections on 11 timeframes (1M, 5M, 15M, 30M, 1H, 2H, 4H, 8H, 12H, 1D, 1W) and gives a signal only when all the included timeframes line up in the same direction (all bullish or all bearish).
Visualization :
Triangles : green triangles under the bars are bullish signals, red triangles above the bars are bearish signals.
Labels: The labels "Long" (green) or "Short" (red) appear on the last confirmed bar when the conditions match.
Table : The dynamic table in the lower central part of the chart shows the MACD status (green for bullish trend, red for bearish) for each included timeframe.
Entrances
MACD Settings :
The length of the fast moving average : the length of the fast EMA (default: 12).
The length of the slow EMA: the length of the slow EMA (default: 26).
The length of the signal : the length of the signal line EMA (default: 9).
Timeframe logic settings : switching timeframes involved in the logic of the signal:
Use 1M, 5M, 15M, 30M, 1H, 2H, 4H, 8H, 12H, 1D, 1W (all default values are true).
Timeframe visualization settings : switching timeframes displayed in the table:
Show 1M, 5M, 15M, 30M, 1H, 2H, 4H, 8H, 12H, 1D, 1W (all default values are true).
Functions
Configurable time frames: Enable or disable specific time frames for independent signal generation and visualization.
Dynamic Table: Adjusts the number of columns based on visible timeframes, displaying only selected columns with real-time color updates (green = bullish, red = bearish).
Alerts : Built-in alert conditions when all included timeframes become bullish ("All Timeframes Bullish") or bearish ("All Timeframes Bearish").
Overlay design: Signals are displayed directly on the price chart, making it easier to integrate with other indicators or price action analysis.
Using
Configure :
Add the indicator to your TradingView chart.
Adjust the length of the MACD (fast, slow, signal) in the settings according to your trading strategy.
Enable/disable timeframes in the "Timeframe Logic Settings" section to determine which of them trigger the signals.
Enable/disable timeframes in the Timeframe Visualization Settings section to customize the table display.
Interpretation of signals :
Bullish (long) : The green triangle below the band and the "Long" label indicate that the MACD line has crossed the signal line from top to bottom on all included timeframes. Consider this as a potential buy signal.
Bearish (short) : The red triangle above the band and the "short" label indicate that the MACD line has crossed the signal line from below on all included timeframes. Consider this as a potential sell signal.
Table : Keep an eye on the table to see the MACD status across all time intervals. Green cells suggest bullish momentum, red cells suggest bearish momentum.
Testing :
Use lower timeframes (e.g., 5M, 15M) for more frequent signals, or higher timeframes (e.g., 1D, 1W) for stronger trend confirmation.
Experiment with the MACD settings (for example, 5, 13, 3) for faster or slower signal generation.
Notes
Performance : When all 11 timeframes are enabled, the indicator makes several calls to request.security(), which may cause a slight delay on very low timeframes of the chart (for example, 1M). For optimal performance, test at 5M or higher or disable unused timeframes.
Signal frequency : MACD crossings tend to occur less frequently than some other indicators (such as the RSI). Adjust the MACD length or timeframe selection to balance sensitivity and reliability.
Setup: If desired, the script can be expanded with additional functions, such as stop loss/take profit fields (as in previous versions of Stoch RSI).
Examples of scenarios
Bullish setup : on the 15-month chart, all included timeframes (for example, 1M, 5M, 15M, 1H) are displayed in the table in green, a green triangle appears under the bar, and the "Long" label confirms the signal.
Bearish setup: on the 1H chart, all included timeframes (for example, 1H, 4H, 1D) turn red, a red triangle appears above the band, and the "Short" label signals a potential downtrend.
Описание индикатора: MACD Multi-Timeframe K2
Важно! работает лучше всего когда включены все таймфреймы кроме 1M и 1W на дневном графике.
Обзор
"MACD Multi-Timeframe K2" - это индикатор Pine Script v5, разработанный для мониторинга пересечений конвергенции и расхождения скользящих средних (MACD) на нескольких таймфреймах одновременно. Он обеспечивает визуальные сигналы на графике и динамическую таблицу, чтобы помочь трейдерам определить, когда условия MACD совпадают на выбранных таймфреймах, указывая на потенциальные бычьи или медвежьи возможности. Этот наложенный индикатор идеально подходит для трейдеров, которые используют многотаймфреймовый анализ для подтверждения трендов или разворотов.
Как это работает
Расчет MACD : для каждого таймфрейма индикатор рассчитывает MACD, используя три компонента:
Быстрая EMA : краткосрочная экспоненциальная скользящая средняя (длина по умолчанию: 12).
Медленная EMA : долгосрочная экспоненциальная скользящая средняя (длина по умолчанию: 26).
Сигнальная линия : 9-периодная EMA линии MACD (быстрая EMA - медленная EMA).
Обнаружение кроссовера :
Бычий сигнал возникает, когда линия MACD пересекает сигнальную линию снизу вверх.
Медвежий сигнал возникает, когда линия MACD пересекает сигнальную линию снизу вверх.
Логика работы с несколькими таймфреймами : индикатор проверяет пересечения MACD на 11 таймфреймах (1M, 5M, 15M, 30M, 1H, 2H, 4H, 8H, 12H, 1D, 1W) и подает сигнал только тогда, когда все включенные таймфреймы выстраиваются в одном направлении (все бычьи или все медвежьи).
Визуализация :
Треугольники : зеленые треугольники под столбиками — бычьи сигналы, красные треугольники над столбиками — медвежьи сигналы.
Метки : метки «Длинный» (зеленый) или «Короткий» (красный) появляются на последнем подтвержденном баре, когда условия совпадают.
Таблица : динамическая таблица в нижней центральной части графика показывает состояние MACD (зеленый — для бычьего тренда, красный — для медвежьего) для каждого включенного таймфрейма.
Входы
Настройки MACD :
Длина быстрой скользящей средней : длина быстрой EMA (по умолчанию: 12).
Длина медленной EMA: длина медленной EMA (по умолчанию: 26).
Длина сигнала : длина сигнальной линии EMA (по умолчанию: 9).
Настройки логики таймфрейма : переключение таймфреймов, участвующих в логике сигнала:
Используйте 1M, 5M, 15M, 30M, 1H, 2H, 4H, 8H, 12H, 1D, 1W (все значения по умолчанию: true).
Настройки визуализации таймфрейма : переключение таймфреймов, отображаемых в таблице:
Показать 1M, 5M, 15M, 30M, 1H, 2H, 4H, 8H, 12H, 1D, 1W (все значения по умолчанию: true).
Функции
Настраиваемые временные рамки : включение или отключение определенных временных рамок для независимой генерации и визуализации сигнала.
Динамическая таблица : регулирует количество столбцов на основе видимых таймфреймов, отображая только выбранные столбцы с обновлением цвета в реальном времени (зеленый = бычий, красный = медвежий).
Оповещения : встроенные условия оповещения, когда все включенные таймфреймы становятся бычьими («All Timeframes Bullish») или медвежьими («All Timeframes Bearish»).
Дизайн наложения : сигналы отображаются непосредственно на ценовом графике, что упрощает интеграцию с другими индикаторами или анализом ценового действия.
Использование
Настраивать :
Добавьте индикатор на свой график TradingView.
Отрегулируйте длину MACD (быстрая, медленная, сигнальная) в настройках в соответствии с вашей торговой стратегией.
Включите/отключите таймфреймы в разделе «Настройки логики таймфрейма», чтобы определить, какие из них запускают сигналы.
Включите/отключите таймфреймы в разделе «Настройки визуализации таймфреймов», чтобы настроить отображение таблицы.
Интерпретация сигналов :
Бычий (длинный) : зеленый треугольник под полосой и метка «Длинный» указывают на то, что линия MACD пересекла сигнальную линию сверху вниз на всех включенных таймфреймах. Рассматривайте это как потенциальный сигнал на покупку.
Медвежий (короткий) : Красный треугольник над полосой и метка «короткий» указывают на то, что линия MACD пересекла сигнальную линию снизу на всех включенных таймфреймах. Рассматривайте это как потенциальный сигнал на продажу.
Таблица : Следите за таблицей, чтобы увидеть состояние MACD по всем временным интервалам. Зеленые ячейки предполагают бычий импульс, красные ячейки предполагают медвежий импульс.
Тестирование :
Используйте более низкие таймфреймы (например, 5M, 15M) для более частых сигналов или более высокие таймфреймы (например, 1D, 1W) для более сильного подтверждения тренда.
Поэкспериментируйте с настройками MACD (например, 5, 13, 3) для более быстрой или медленной генерации сигнала.
Примечания
Производительность : при включении всех 11 таймфреймов индикатор делает несколько вызовов request.security() , что может вызвать небольшую задержку на очень низких таймфреймах графика (например, 1M). Для оптимальной производительности тестируйте на 5M или выше или отключите неиспользуемые таймфреймы.
Частота сигнала : пересечения MACD, как правило, происходят реже, чем некоторые другие индикаторы (например, RSI). Отрегулируйте длину MACD или выбор таймфрейма, чтобы сбалансировать чувствительность и надежность.
Настройка : При желании скрипт можно расширить дополнительными функциями, такими как поля стоп-лосса/тейк-профита (как в предыдущих версиях Stoch RSI).
Примеры сценариев
Бычья установка : на 15-месячном графике все включенные таймфреймы (например, 1M, 5M, 15M, 1H) отображаются в таблице зеленым цветом, под полосой появляется зеленый треугольник, а метка «Длинная» подтверждает сигнал.
Медвежья установка : на графике 1H все включенные таймфреймы (например, 1H, 4H, 1D) становятся красными, над полосой появляется красный треугольник, а метка «Short» сигнализирует о потенциальном нисходящем тренде.

MACD ultimate with EMA overrideOverview
This Pine Script v5 indicator combines MACD zero-cross signals, SuperTrend trend validation, an EMA(50/200) trend filter and an EMA-crossover override to produce clean, session-constrained entry signals and robust exit logic. It draws labels and lines on the chart (entries, exits, SL lines) and supports alerts. Stop-losses use percentage-based sizing and are evaluated on bar close only to avoid intrabar noise.
Key features
Primary entry rule (MACD zero-cross):
Buy when MACD line crosses above zero (current bar MACD > 0 and previous bar MACD < 0).
Sell when MACD line crosses below zero (current bar MACD < 0 and previous bar MACD > 0).
Session-only entries: Entries are generated only inside a user-defined session (e.g., 09:30-11:30). Exits are evaluated at all times.
SuperTrend validation: Optional SuperTrend filter for entries and exits. Can be configured so exits require both MACD exit and SuperTrend flip (AND mode) or use OR mode.
EMA trend filter for entries: Optional EMA(50) vs EMA(200) filter — when enabled the indicator will only open buys in EMA-up trend and sells in EMA-down trend.
EMA crossover override (priority rule): If EMA fast crosses the slow:
EMA50 crosses above EMA200 → forced BUY override (bypasses session, SuperTrend, MACD). Exits any active short and opens long.
EMA50 crosses below EMA200 → forced SELL override (bypasses other validations). Exits any active long and opens short.
Overrides respect same-direction protection (won’t reopen an existing same-side position).
Opposite-entry immediate exit: When an opposite-direction raw entry (MACD zero-cross) occurs, any active opposite trade is exited immediately (then the script may open the opposite entry subject to entry validation). Same-direction repeated signals do not force an exit.
Stop-Loss (percentage): Parameterized SL (%) applied at entry; SL is checked and triggered only on bar close (e.g., long SL triggers if barstate.isconfirmed and close <= SL).
Labels & SL lines: Single-line, non-repainting labels for entries/exits; SL horizontal line drawn on open positions and greys out after closing.
Plots & visuals:
MACD panel (histogram, MACD, signal) optional.
SuperTrend plotted as a single color-coded line: green for bullish, red for bearish (no dots).
Optional EMA( fast / slow ) plots.
Entry markers (triangles) shown only for session-filtered entries.
Alerts: Entry and exit alerts are included and can be toggled on/off.
Inputs (high level)
MACD: fast, slow, signal lengths.
SL (%) and toggle to enable/disable SL.
SuperTrend: ATR length, multiplier; toggles: require for entry, allow/require for exit, show/hide.
EMA trend: enable/disable filter; fast/slow lengths; show/hide EMAs.
EMA override (built-in) — crossover detection triggers forced entry/exit.
Session: time range (HHMM-HHMM) — applies to entry generation only.
Misc: allow multiple entries flag, enable alerts, show/hide MACD panel.
Behavioral notes & caveats
The indicator is an overlay indicator (not a strategy()), so it draws visual signals and alerts but does not place real trades — use strategy() conversion to backtest trade P&L.
EMA override bypasses all validations by design — it forcibly exits the opposite side and opens the override side immediately (on the same bar). This is intentional to capture major trend flips.
SL is checked on bar close only. That reduces false SL triggers from intrabar spikes but means realized fills can differ in live trading depending on execution and slippage.
Opposite-entry exits are immediate (no SuperTrend/MACD requirement) except when a crossover override is the cause — the script guards so EMA overrides take precedence.
Pine Script runs on bar close for most accurate signals; intrabar behavior depends on your chart settings (realtime vs historical) — expect small differences between indicator labels and broker fills.
Plot/label density: many labels and SL lines can clutter the chart on lower timeframes. Consider hiding SL lines after N bars (optional enhancement) or use higher timeframe charts for less clutter.
Suggested default settings
MACD: 12, 26, 9
SL: 1.0 (%) with Use SL = on
SuperTrend: ATR 10, Multiplier 3.0, require for entry = true, require for exit = true (AND mode)
EMA trend filter: enabled (50/200)
Session: 0930-1130 (adjust to your exchange/timezone)
Alerts: on
How to use
Paste the full Pine v5 script into TradingView’s Pine Editor and add to chart.
Set the trade_session to the market hours you want entries in (chart timezone should match your intended exchange).
Toggle Use EMA trend / Require SuperTrend / Require ST for exit depending on how tight you want validation.
Use strategy() conversion before backtesting to verify the rules produce acceptable historical returns (indicator-only won’t generate P&L).
Recommended next steps
Convert to a strategy() script to backtest and measure win rate, drawdown, profit factor, and to validate the SL-on-close logic with realistic fills.
Add an input to auto-hide SL lines after N bars or compress labels to a compact trade status box.
Consider adding ATR- or volatility-based SL as an alternative to percentage SL.

MACD with TrendIndicator Name: MACD with Trend & Multi-Timeframe Dashboard
Why Use This Indicator?
Two MACDs for Double Confirmation:
It integrates both a standard MACD (fast/slow lengths of your choice) and a Trend MACD (longer lengths). The standard MACD identifies short-term momentum shifts, while the Trend MACD helps confirm the higher-level market trend.
Multi-Timeframe 50/200 SMA Overview:
A built-in dashboard quickly shows whether the 50-period moving average is above or below the 200-period moving average across multiple timeframes (Monthly, Weekly, Daily, etc.). At a glance, you can see if higher timeframes agree with your immediate trading setup.
Clear Buy/Sell Signals:
The script plots buy arrows when the MACD histogram crosses from negative to positive, plus an additional label for the Trend MACD crossing. The same goes for sell signals if momentum flips from positive to negative. This clarity can reduce guesswork.
Customizable & Intuitive:
Easily adjust moving average types (SMA or EMA), lengths, and source inputs to suit different asset classes or personal preferences. Visual color coding helps you quickly interpret bullish vs. bearish conditions.
Recommended Trading Approach
Identify Overall Trend
Check the Trend MACD histogram and the multi-timeframe dashboard (50/200 SMAs). If you see bullish alignment on higher timeframes (e.g., Daily, Weekly) and the Trend MACD is above zero, you know the market environment is supportive for long trades.
Pinpoint Entry Using Standard MACD
Wait for the standard MACD histogram to cross above zero or for a labeled “Buy Signal.” This indicates short-term momentum turning bullish in sync with the broader trend. If the market is already trending up (confirmed by the dashboard), the probability of a successful long entry often improves.
Set a Stop-Loss & Take-Profit
While not included in the code, adding an ATR- or price-based stop-loss can protect against sudden reversals. A simple approach is risking 1–2% per trade and aiming for a 1.5–2× reward relative to that risk.
Monitor Sell Signals
If the short-term MACD crosses below zero—triggering a “Sell Signal”—and the Trend MACD also turns down (or the dashboard flips bearish), consider exiting the position or tightening stops. This alignment of short- and long-term indicators often signals a shift in momentum that could threaten your open profits.
Summary
The MACD with Trend & Multi-Timeframe Dashboard is a versatile, all-in-one toolkit. It combines the immediacy of short-term MACD signals, the validation of a longer-term trend oscillator, and the broader insight of multi-timeframe moving averages. Whether you are a swing trader looking for alignment across bigger trends or a shorter-term trader wanting clear momentum triggers, this indicator helps streamline decision-making and reduce noise.
Disclaimer: As with all technical analysis tools, there is no guarantee of success. Always combine indicator signals with sound risk management and a thorough understanding of market conditions

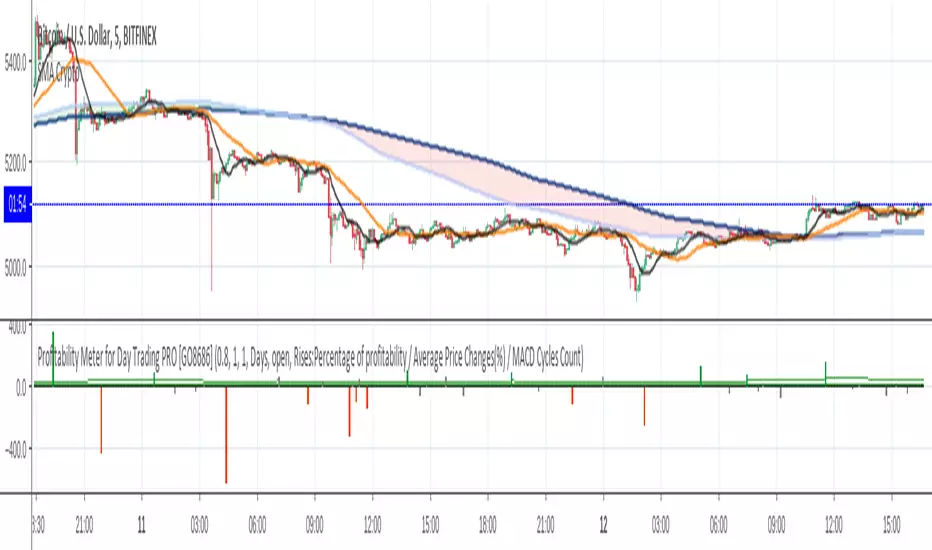
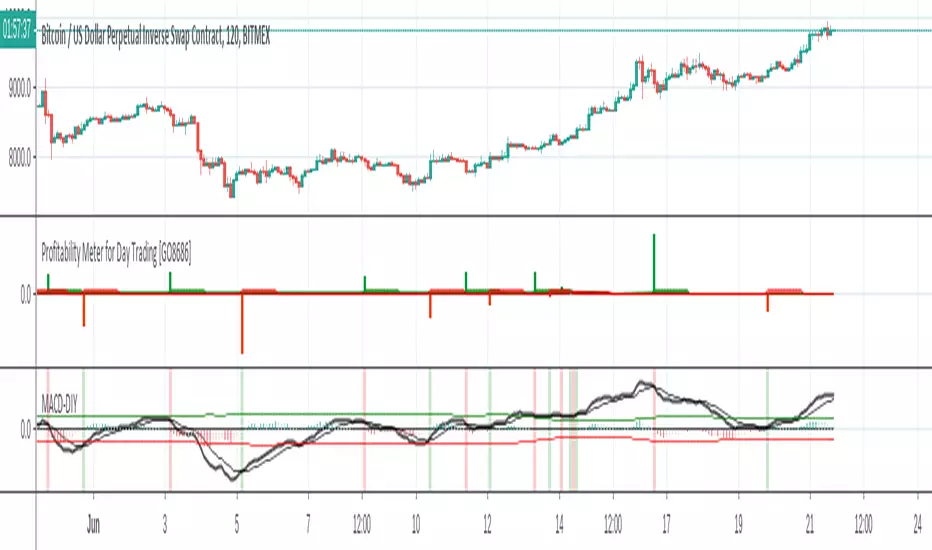
Profitability Meter for Day Trading PRO [GO8686]For day traders, keeping a position is risky and costly, a popular strategy is to open a position ONLY when volatility is active, in other words, only when profitability is back.
This indicator reveals the movements of the underlying profitability of a trading security in different time dimensions.
This indicator calculates and displays price change percentage of MACD cycles, highlights those MACD cycles that are over the profitability threshold, helping traders identify range area, the start of a new trend and the fading of a trend.
Multiple time frames: This indicator is designed for day trading, so suggested time frames are: 3m, 5m, 15m, 30m, 1H. Users can try other time frames (< 1D) if it fits their trading practice.
Range area in general: a small green column and a small red column appear alternately, or most columns are gray within the period.
The start of a new trend: an outstanding green or red column means the macd cross brought a price change that was higher than the profitability threshold, which could mean a new trend, especially when it was from a range area.
The fading of a trend: for instance, when green columns are getting smaller and red columns appear, a fading of bull trend could be on the way.
This is PRO version of Profitability Meter for Day Trading
PRO excluded functions:
Alert Function: allowing user to set alert for price change with Profitability, or set alert for statistics results.
Statistics within Customisable Time Span: Percentage of MACD cycles with profitability, the average of price change(%) and MACD cycles count. Users can customize the time range by days,hours or bars (up to the maximum backtracking value that Tradingview allows).
Subscribers of this indicator may apply for two-month free-trial of "Crypto Currency Profitability Rankings PRO with Customisable List"
Free trial of two-week: Please leave a comment asking for a trial, you should get access in 48 hours. In case it doesn't happen, please message the author.
Visibility:Invite-Only
Format Configuration:
Profitability Threshold: a percentage of price movement within a MACD cycle that a user thinks is good to define profitability, defval: 0.8%.
Alertthreshold: Threshold percentage for alert.
timeSpan: Time span for statistics
timeSpanType: Time span type for statistics
Related Indicators:
Crypto Currency Profitability Rankings Standard with Popular List (Protected): The Indicator calculates and compares the profitability of a group of popular crypto currencies - based on MACD cycles and user-defined time span, helping traders to find the most suitable trading security.
Crypto Currency Profitability Rankings PRO with Customisable List (Invite-Only): Contact the author for a free trial.
List of the author's Indicators
www.tradingview.com
Disclaim: By using or requesting access to this indicator, you acknowledge that you have read and accepted that this indicator is for study purposes only and it does NOT guarantee you will make money.
I am not financial advisor and I am NOT responsible for any profits or losses you may incur by using this indicator!
Users should make their own decisions, carefully assess risks and be responsible for investment and trading activities.
The latest updates override the previous description. Please check the updates.
日内交易盈利潜力指示仪PRO
这是日内交易盈利潜力指示仪的PRO版本
PRO专属功能:
预设警报:方便用户为赢利性变动和统计学结果设置警报。
统计功能:过去特定时间段的可赢利波动的百分比,波动百分比平均值和MACD周期计数。用户可以自定义时间幅度:可以用天数,小时数,蜡烛数(上至Tradingview最大回溯值)
本指标用户可以申请免费试用两个月“Crypto Currency Profitability Rankings PRO with Customisable List (Invite Only)”
指标特征描述
本指标帮助交易员认知交易标的在不同时间维度的赢利潜力的变化。
对于日内交易,保持仓位是要承担风险和成本的,一种交易策略是只在波动率被激活至可赢利水平后才开仓位。
本指标计算和展示赢利潜力-基于MACD周期的波动百分比,用颜色来突出高赢利性的波动周期。方便交易员辨识非交易区间,新趋势的开始和旧趋势的衰减。
多时间维度:本指标为日内交易设计,因此建议使用时间维度:3m,5m,15m,30m,1H; 如果用户需要,也可以用于其他不大于1D的维度。
盘整区的一般特征:当波动率消减时,波动率低于可赢利门槛,呈现灰色; 或者小的绿色和红色波动率间隔出现。
新趋势的开始:在盘整后期,新出现的绿色或者红色波动率可能标识着新趋势的开始。
旧趋势的衰减:以上升趋势为例,当绿色波动率逐渐缩小,而红色波动率开始出现时,可能标识着上升趋势衰减。
设置:盈利能力阈值:用户自定义的MACD单次波动的可赢利的百分比,默认为0.8%
免费试用两周:跟帖评论, 要求试用,您应该会在48小时内获得访问权限。 如果没有获得,请私信作者。
相关指标:
Crypto Currency Profitability Rankings Standard with popular list (Protected) 加密货币赢利潜力排行指标 标准版 热门列表: 指标计算和比对一组热门虚拟货币的可赢利属性 - 基于MACD波动周期和用户自定义的时间周期,帮助交易员发掘最适合自己赢利和风险偏好的交易品种。
Crypto Currency Profitability Rankings PRO with Customisable List (Invite-Only): 加密货币赢利潜力排行指标 PRO 自定义列表
试用开发者的其他指标
www.tradingview.com
免责声明:在要求获得本指标使用权之前以及在使用本指标之前,用户认可已经完全了解和接受:本指标仅供教育和研究目的, 它不提供任何赢利的可能性。
本指标的开发者并非专业投资顾问,因此不对用户的任何赢亏负责。
用户应独立判断,审慎评估并自负投资和交易风险!
最新更新会覆盖之前的说明。 请检查更新。
Profitability Meter for Day Trading [GO8686]Disclaim:
By using or requesting access to this indicator, you acknowledge that you have read and accepted that this indicator is for study purposes only and it does NOT guarantee you will make money.
I am not financial adviser and I am NOT responsible for any profits or losses you may incur by using this indicator.
Users should make their own decisions, carefully assess risks and be responsible for investment and trading activities.
Indicator Description
Visibility:Protected
This indicator helps traders understand the movements of the underlying profitability of a trading security in different time dimensions.
For day trading, keeping a position is risky and costly, a popular strategy is to open a position ONLY when volatility is active, in other words, only when profitability is back.
This indicator calculates and displays price movement percentage of MACD cycles, highlights those MACD cycles that are over the profitability threshold, helping traders identify range area, the start of a new trend and the fading of a trend.
Multiple time frames: This indicator is designed for day trading, so suggested time frames are: 3m, 5m, 15m, 30m, 1H. Users can try other time frames (< 1D) if they find it useful.
Range area in general: a small green column and a small red column appear alternately, or most columns are gray within the period.
The start of a new trend: an outstanding green or red column means the MACD cross brought a price change that was higher than the profitability threshold, which could mean a new trend, especially when it was from a range area.
The fading of a trend: for instance, when green columns are getting smaller and red columns appear, a fading of bull trend could be on the way.
Format Configuration:
Profitability Threshold: a percentage of price movement within a MACD cycle that a user thinks is good to define profitability, defval: 0.8%.
PRO Version of this Indicator: Profitability Meter for Day Trading - PRO (Invite-Only)
Alert Function: allowing user to set alert for price change with profitability, or set alert for statistics results.
Statistics with Customisable Time Span: Percentage of MACD cycles with profitability, the average of price change(%) and MACD cycles count. Users can customize the time range by days,hours or bars (up to the maximum backtracking value that Tradingview allows).
Related Indicators:
Crypto Currency Profitability Rankings Standard with Popular List (Protected):
This indicator calculates and generate a ranking of profitability from a popular list of crypto currencies, based on MACD cycles within user-defined time span, helping crypto traders to find the trading securities that suit their risk and volatility preference.
Crypto Currency Profitability Rankings PRO with Customisable List (Invite-Only): Contact the author for a free trial.
List of the author's Indicators
www.tradingview.com
The latest updates override the previous description. Please check the updates.
日内交易盈利潜力指示仪
免责声明:在要求获得本指标使用权之前以及在使用本指标之前,用户认可已经完全了解和接受:本指标仅供教育和研究目的, 它不提供任何赢利的可能性。
本指标的开发者并非专业投资顾问,因此不对用户的任何赢亏负责。
用户应独立判断,审慎评估并自负投资和交易风险!
指标特征描述
本指标帮助交易员认知交易标的在不同时间维度的赢利潜力的变化。
对于日内交易,保持仓位是要承担风险和成本的,一种交易策略是只在波动率被激活至可赢利水平后才开仓位。
本指标计算和展示赢利潜力-基于MACD周期的波动百分比,用颜色来突出高赢利性的波动周期。方便交易员辨识非交易区间,新趋势的开始和旧趋势的衰减。
多时间维度:本指标为日内交易设计,因此建议使用时间维度:3m,5m,15m,30m,1H; 如果用户需要,也可以用于其他不大于1D的维度。
盘整区的一般特征:当波动率消减时,波动率低于可赢利门槛,呈现灰色; 或者小的绿色和红色波动率间隔出现。
新趋势的开始:在盘整后期,新出现的绿色或者红色波动率可能标识着新趋势的开始。
旧趋势的衰减:以上升趋势为例,当绿色波动率逐渐缩小,而红色波动率开始出现时,可能标识着上升趋势衰减。
设置:盈利能力阈值:用户自定义的MACD单次波动的可赢利的百分比,默认为0.8%
高级版本功能: Profitability Meter for Day Trading - PRO (Invite Only)
预设警报:方便用户为赢利性变动和统计学结果设置警报。
统计功能:过去特定时间段的可赢利波动的百分比,波动百分比平均值和MACD周期计数。用户可以自定义时间幅度:可以用天数,小时数,蜡烛数(上至Tradingview最大回溯值)
相关指标:
Crypto Currency Profitability Rankings Standard with popular list (Protected) 加密货币获利机会排行指标 标准版 热门列表(保护,开放使用权): 指标计算和比对一组热门虚拟货币的可赢利属性 - 基于MACD波动周期和用户自定义的时间周期,帮助交易员发掘最适合自己赢利和风险偏好的交易品种。
Crypto Currency Profitability Rankings PRO with Customisable List (Invite-Only): 加密货币获利机会排行指标 PRO - 自定义列表
试用开发者的其他指标
www.tradingview.com
最新更新会覆盖之前的说明。 请检查更新。
OsMAOsMA : Oscillator of Moving Averages.
OsMA is a common index because it is a histogram in the middle of MACD.
The histogram in the middle is a little difficult to handle, so I dared to display OsMA like MACD.
The one like MACD is OsMA, and the histogram in the middle is the amount of change in OSMA.
It is an indicator that is characterized by a strong and quick reaction.
OsMAとはMACDの真ん中のヒストグラムなのでありふれた指標です
真ん中のヒストグラムだけではちょっと扱い辛いので、あえてOsMAをMACDみたいに表示してみました
MACDみたいなやつがOsMAで、真ん中のヒストグラムはOSMAの変化量です
強烈に反応が早いのが特徴のインジケーターです

Cryptocurrency Profitability Rankings PRO Customisable ListA good cryptocurrency may multiply your earnings - with the same effort.
This indicator helps crypto traders to find the trading securities that suit their profitability and volatility preference.
This indicator calculates and generate a ranking of profitability from a user-defined list of cryptocurrencies, based on MACD cycles within user-defined time span.
Multiple time frames: This indicator is designed for day trading, so suggested time frames are: 3m, 5m, 15m, 30m, 1H. Users can try other time frames (< 1D) if they find it useful.
This is PRO version of Cryptocurrency Profitability Rankings with Popular List, developed based on Profitability Meter for Day Trading PRO
PRO Version advanced functions:
Customisable(User-Defined) Cryptocurrency List
Option to select Open or Close price as start point for calculation.
Flexible Time Span Type: Hours and Bars, besides Days
More statistics options: Display price change(%) of latest rising/falling MACD cycle
Free trial for two weeks: Please leave a comment asking for a trial, you should get access within 48 hours. In case it doesn't work, please message the author.
Format Configuration:
Profitability Threshold: a percentage of price movement within a MACD cycle that a user thinks can be used to define profitability, defval: 0.8%.
Select open or close as start point: which can affect the results greatly, as difference between open and close can be significant, especially for big time interval.
Statistics Options
timeSpan: time span for statistics
timeSpanType: time span type for statistics
User-defined cryptocurrencies list: up to 10 items
About Customisable List of Cryptocurrency:
At present, in Pine Language, there is no method to plot a string input variable. Therefore, fixed handles are used to represent each symbol name, eg. "Sym_10". User need to remember the order of the list or refer to "Format".
Make sure to input correct tiers, eg. "BITFINEX:ETHUSD"
Related Indicators:
Profitability Meter for Day Trading PRO - Calculating and evaluating individual trading security's profitability.
About Loading Time: It may take up to 2 minutes for your browser to load a new format setting, depending on the your computer and network speed.
List of the author's Indicators
www.tradingview.com
Disclaim: By using or requesting access to this indicator, you acknowledge that you have read and accepted that this indicator is for study purposes only and it does NOT guarantee you will make money.
I am not financial adviser and I am NOT responsible for any profits or losses you may incur by using this indicator!
Users should make their own decisions, carefully assess risks and be responsible for investment and trading activities.
The latest updates override the previous description. Please check the updates.
加密货币赢利潜力排行指标 PRO 自定义列表
优质的交易币种可能倍增你的收益-在付出同样的努力的情况下。
该指标基于Profitability Meter for Day Trading PRO开发,帮助加密货币交易员找到适合其赢利性和波动率偏好的币种。
该指标根据用户定义的时间跨度内的MACD周期,计算和比对用户自定义的一组虚拟货币,生成一个赢利潜力排名。
多时间维度:本指标为日内交易设计,因此建议使用时间维度:3m,5m,15m,30m,1H; 如果用户需要,也可以用于其他小于1D的维度。
免费试用两周:跟帖评论要求试用,您应该在48小时内获得访问权限。 如果没有获得,请私信开发者。
这是Cryptocurrency Profitability Rankings with Popular List的PRO版本
可自定义加密货币列表,上至10个
可选择开盘价或收盘价作为计算起点。
灵活的时间跨度类型:小时,蜡烛数,天数
更多统计选项:显示最近上涨/下跌的MACD周期的价格变动(%)
格式配置:
盈利能力阈值:用户自定义的MACD单次波动的可赢利的百分比,默认为0.8%
选择开盘或者收盘作为起点:这会对结果产生很大影响,因为开盘价和收盘价之间的差异可能很大,特别是在较大的时间维度。
统计选项
timeSpan:统计功能的时间跨度
timeSpanType:统计功能的时间跨度单位
用户自定义的加密货币列表输入栏
关于自定义的加密货币列表:
目前,在Pine Language中,不能打印字符串输入变量。 因此,使用顺序数字字符代表币种名称,例如。“Sym_10”。 用户需要记住其输入币种的顺序或随时参考“格式设置”中的顺序。
确保输入正确的交易所和币种名称,例如。 “BITFINEX:ETHUSD”。
相关指标:
日内交易盈利潜力指示仪PRO (Profitability Meter for Day Trading PRO):用于计算和评估单个交易品种的盈利能力
关于载入新设置:每次载入新的设置可能需要0-2分钟,取决于用户的电脑配置和网络速度。
试用开发者的其他指标
www.tradingview.com
免责声明:在要求获得本指标使用权之前以及在使用本指标之前,用户认可已经完全了解和接受:本指标仅供教育和研究目的, 它不提供任何赢利的可能性。
本指标的开发者并非专业投资顾问,因此不对用户的任何赢亏负责。
用户应独立判断,审慎评估并自负投资和交易风险!
最新更新会覆盖之前的说明。 请检查更新。

Bar Color - Moving Average Convergence Divergence [nsen]The Pine Script you've provided creates a custom indicator that utilizes the MACD (Moving Average Convergence Divergence) and displays various outputs, such as bar color changes based on MACD signals, and a table of data from multiple timeframes. Here's a breakdown of how the script works:
1. Basic Settings (Input)
• The script defines several user-configurable parameters, such as the MACD values, bar colors, the length of the EMA (Exponential Moving Average) periods, and signal smoothing.
• Users can also choose timeframes to analyze the MACD values, like 5 minutes, 15 minutes, 1 hour, 4 hours, and 1 day.
2. MACD Calculation
• It uses the EMA of the close price to calculate the MACD value, with fast_length and slow_length representing the fast and slow periods. The signal_length is used to calculate the Signal Line.
• The MACD value is the difference between the fast and slow EMA, and the Signal Line is the EMA of the MACD.
• The Histogram is the difference between the MACD and the Signal Line.
3. Plotting the Histogram
• The Histogram values are plotted with colors that change based on the value. If the Histogram is positive (rising), it is colored differently than if it's negative (falling). The colors are determined by the user inputs, for example, green for bullish (positive) signals and red for bearish (negative) signals.
4. Bar Coloring
• The bar color changes based on the MACD's bullish or bearish signal. If the MACD is bullish (MACD > Signal), the bar color will change to the color defined for bullish signals, and if it's bearish (MACD < Signal), the bar color will change to the color defined for bearish signals.
5. Multi-Timeframe Data Table
• The script includes a table displaying the MACD trend for different timeframes (e.g., 5m, 15m, 1h, 4h, 1d).
• Each timeframe will show a colored indicator: green (🟩) for bullish and red (🟥) for bearish, with the background color changing based on the trend.
6. Alerts
• The script has alert conditions to notify the user when the MACD shows a bullish or bearish entry:
• Bullish Entry: When the MACD turns bullish (crosses above the Signal Line).
• Bearish Entry: When the MACD turns bearish (crosses below the Signal Line).
• Alerts are triggered with custom messages such as "🟩 MACD Bullish Entry" and "🟥 MACD Bearish Entry."
Key Features:
• Customizable Inputs: Users can adjust the MACD settings, histogram colors, and timeframe options.
• Visual Feedback: The color changes of the histogram and bars provide instant visual cues for bullish or bearish trends.
• Multi-Timeframe Analysis: The table shows the MACD trend across multiple timeframes, helping traders monitor trends in different timeframes.
• Alert Conditions: Alerts notify users when key MACD crossovers occur.

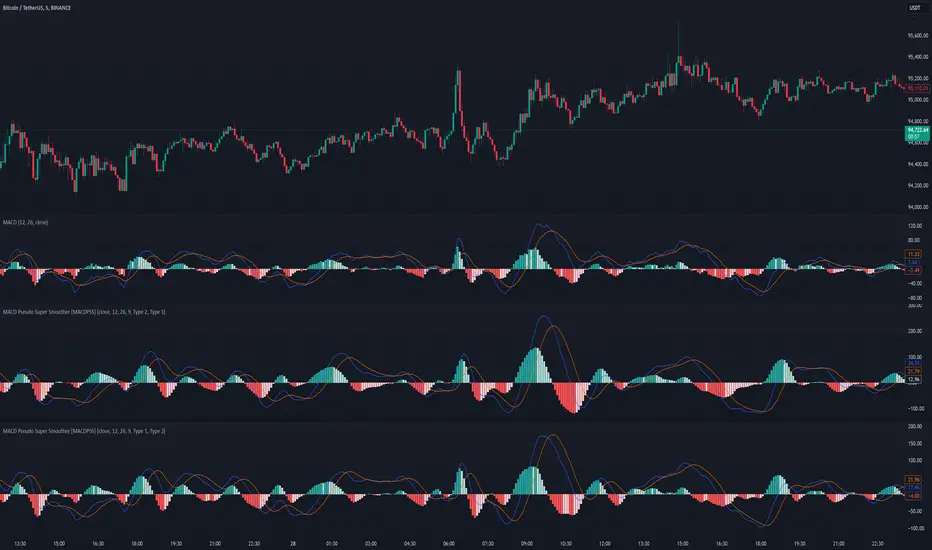
MACD Pseudo Super Smoother [MACDPSS]The MACD Pseudo Super Smoother (MACDPSS) is a variation of the classic Moving Average Convergence Divergence (MACD) indicator. It utilizes the Pseudo Super Smoother (PSS) filter, a Finite Impulse Response (FIR) filter, to smooth both the MACD line and the signal line, providing a potentially refined representation of momentum compared to the traditional MACD which typically uses Exponential Moving Averages (EMAs).
The PSS, inspired by the Super Smoother filter (an Infinite Impulse Response (IIR) filter), aims to reduce noise while minimizing lag. The MACDPSS leverages this FIR implementation to create a unique MACD variant. The core concept of MACD, which involves analyzing the relationship between two moving averages of different lengths to identify momentum shifts, remains intact.
Filter Types and Customization
The MACDPSS offers independent control over the smoothing applied to the MACD line and the signal line through two "Filter Style" inputs:
Oscillator MA Type: This setting determines the filter type used to calculate the fast and slow moving averages that form the basis of the MACD line.
Signal Line MA Type: This setting controls the filter type used to smooth the MACD line, generating the signal line.
Each of these settings allows a choice between two distinct PSS filter types:
Type 1: Provides a smoother output with a more gradual response, characterized by greater attenuation of high-frequency components.
Type 2: Exhibits increased reactivity, allowing for a faster response to shifts in momentum, but with a potential for overshoot.
This dual-filter approach provides flexibility in tailoring the indicator's responsiveness and smoothness to individual preferences and specific market conditions. The user can, for example, choose a smoother Type 1 filter for the MACD line and a more reactive Type 2 filter for the signal line, or vice-versa.
Calculations
The MACDPSS calculates the MACD line by subtracting the slow moving average from the fast moving average, both derived using the PSS filter with the selected "Oscillator MA Type." The signal line is then calculated by applying the PSS filter with the selected "Signal Line MA Type" to the MACD line. The histogram represents the difference between the MACD line and the signal line.
Interpretation
The interpretation of the MACDPSS is similar to the standard MACD. Crossovers between the MACD line and the signal line, the position of the MACD line relative to the zero line, and the slope and direction of the histogram are all used to gauge momentum and potential trend changes.
Disclaimer
The MACDPSS, while inspired by the Super Smoother, utilizes a distinct FIR approximation (the PSS). Therefore, its behavior will not perfectly mirror that of a MACD calculated using IIR filters. The PSS is designed to be a rough approximation. This indicator should be used in conjunction with other technical analysis tools, and users should be aware of the inherent differences between FIR and IIR filter characteristics when interpreting the indicator's signals. Like any moving average based indicator, the MACDPSS is a lagging indicator, although it tries to improve it. The novelty of this indicator comes from applying a unique FIR filter to a classic momentum oscillator in a configurable way.
faiz MACDMACD: Moving Average Convergence Divergence
The Moving Average Convergence Divergence (MACD) is a popular momentum indicator used in technical analysis to gauge the strength, direction, and potential reversal points of a trend in a financial asset's price movement. Developed by Gerald Appel in the late 1970s, MACD is particularly favored by traders for its ability to capture both trend-following and momentum aspects of price behavior.
Components of the MACD
The MACD is derived from two exponential moving averages (EMAs) of a security's price:
MACD Line: This is the difference between the 12-day and 26-day EMAs. The shorter 12-day EMA reacts more quickly to price changes, while the 26-day EMA smooths out price fluctuations, offering a longer-term perspective.
Formula: MACD Line = 12-day EMA - 26-day EMA
Signal Line: This is the 1-day EMA of the MACD Line itself. The signal line is used to generate buy and sell signals when it crosses the MACD line.
Formula: Signal Line = 1-day EMA of the MACD Line
MACD Histogram: The histogram represents the difference between the MACD Line and the Signal Line. It is displayed as bars that oscillate above and below a zero line, helping to visualize the convergence or divergence between the two lines.
Formula: Histogram = MACD Line - Signal Line
Interpretation of MACD
The MACD indicator is used to identify potential buy and sell signals based on the following observations:
MACD Line and Signal Line Crossovers:
Bullish Crossover: A buy signal occurs when the MACD Line crosses above the Signal Line. This suggests that the momentum is shifting in favor of the bulls, indicating a potential upward price movement.
Bearish Crossover: A sell signal occurs when the MACD Line crosses below the Signal Line. This suggests a bearish trend may be emerging, signaling a potential downward movement.
Divergence:
Bullish Divergence: Occurs when the price of the asset is making new lows, but the MACD is forming higher lows. This suggests that the downward momentum is weakening and a potential reversal to the upside may be imminent.
Bearish Divergence: Occurs when the price is making new highs, but the MACD is forming lower highs. This suggests that the upward momentum is weakening and a reversal to the downside may occur.
Only use it in timeframe m1, and solely use for XAUUSD pair.
Advisable to use it as a confirmation with other indicator such as
BBMA, SMC, SUPPORT RESISTANCE, SUPPLY AND DEMAND.
how to use :
MA 5 Crossing above MA9, will generate BUY signals
MA 5 Crossing below MA9, will generate SELL signals
Trade at your own SKILLS.
I dont mind people using this script for free.
All I want is just prayer for me and my family success.
Thank You and Have a nice and pleasant day :-)

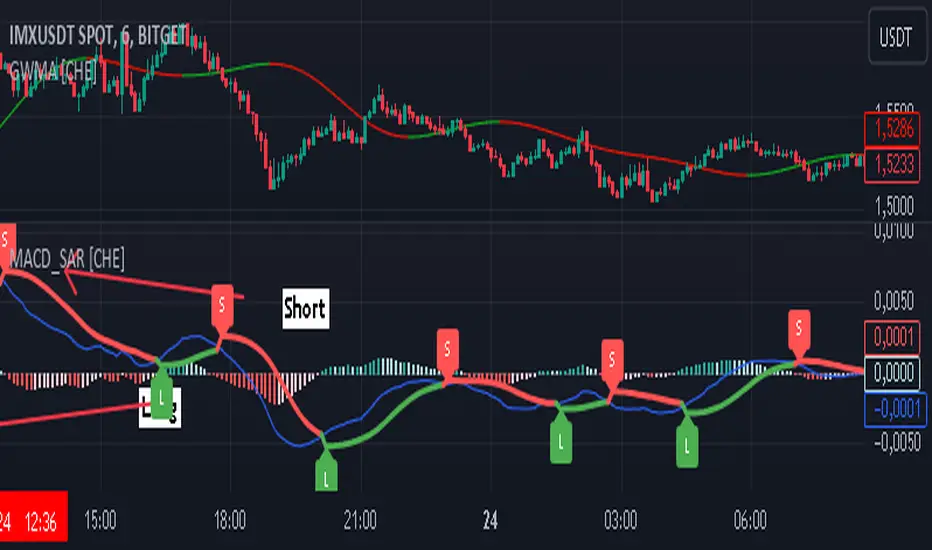
MACD with SAR Indicator [CHE] MACD with SAR Indicator
Introduction
"The whole is greater than the sum of its parts. " The "MACD with SAR Indicator" is an innovative technical analysis tool that combines the strengths of the Moving Average Convergence Divergence (MACD) indicator with the Parabolic Stop and Reverse (SAR) indicator. This indicator provides traders with an enhanced method to detect trend changes and determine optimal entry and exit points in the market by using the SAR based on the MACD line to better identify reversal points. The combination generates clear trend reversal signals, which are visually represented through long (L) and short (S) signals on the chart.
Originality and Usefulness
This indicator differs from traditional MACD or SAR indicators by combining the trend-following calculations of the SAR with the trend strength and momentum calculations of the MACD. This enables a more precise identification of trend changes and provides clear buy and sell signals, which is particularly useful for manual traders.
Key Features and Functionality
1. Combination of MACD and SAR
- Why this Combination?: The MACD is known for its ability to measure the strength and direction of a trend, while the SAR is specifically designed to identify reversal points. By combining these two indicators, traders can better understand both the trend strength and potential turning points in the market.
- How Components Work Together: The MACD measures the difference between fast and slow moving averages, indicating market momentum. The SAR follows the MACD line instead of the price and marks potential reversal points more accurately. When the MACD signals a new trend and the SAR confirms it, the indicator provides reliable trading opportunities.
2. Adjustable Parameters
- MACD Settings: Users can adjust the lengths of the fast and slow moving averages (default: 28 and 38 periods) and the signal smoothing (default: 9 periods) to tailor the indicator to different market conditions.
- SAR Settings: Users can adjust the start value (default: 0.01), increment (default: 0.01), and maximum value (default: 0.18) of the SAR to control sensitivity and responsiveness.
3. Visual Representation and Signals
- Color-Coded Histograms: The histogram shows the difference between the MACD and signal line and is color-coded to highlight the direction of the trend.
- Signal Labels: The indicator automatically adds "L" (Long) and "S" (Short) labels on the chart to show the current positions to traders.
4. Alert Settings
- Custom Alerts: Alerts can be set to notify traders when the MACD and SAR experience significant state changes, such as when the histogram switches from rising to falling or vice versa.
5. Toggle Display
- Display Mode: Users can toggle the display of the MACD_SAR oscillator and MACD to focus on the information most relevant to their trading strategy.
Application and Benefits
- Versatility: This indicator can be used in various market conditions and for different trading strategies, including trend following and reversal trading.
- Ease of Interpretation: The clear visual representation and automatic signals make it easier for traders to identify trading opportunities and track trends.
- Customizability: With numerous settings options, the indicator can be tailored to individual preferences and specific market conditions.
Conclusion
The "MACD with SAR Indicator" is a valuable tool for traders seeking precise and reliable signals to identify market trends and make profitable trading decisions. With its extensive customization options, powerful features, and the ability to toggle displays, this indicator provides excellent support for technical analysis.
By emphasizing the synergy between the MACD and SAR indicators, highlighting the default settings, and clarifying that the SAR is based on the MACD line and generates clear trend reversal signals through long and short labels, this revised description should help users understand the functionalities and advantages of your indicator while meeting TradingView's publication requirements.
Best regards Chervolino
CoffeeShopCrypto 3pl MAThe CoffeeShopCrypto 3pl MA indicator is a technical analysis tool that uses three different moving averages to identify trends in the price of an asset. The three moving averages have lengths of 12, 26, and 50. If these numbers sound familiar its because they are based off the standard of the MACD indicator, and can be either simple moving averages (SMA) or exponential moving averages (EMA), depending on user preference.
The following is plotted on the chart
The fast EMA/SMA (based on the 12-period length) in yellow.
The mid EMA/SMA (based on the 26-period length) in gray.
The slow EMA/SMA (based on the 50-period length) in either green or red, depending on whether the current close price is above or below the Overall Trend MA.
In addition to the moving averages, the indicator also calculates the MACD (Moving Average Convergence Divergence), and uses it to color the bars based on the momentum of the asset.
The MACD is calculated using two user-defined lengths (fast and slow), as well as a user-defined smoothing length for the signal line. The oscillator and signal line can be either SMA or EMA, and the colors of the MACD bars are based on whether the histogram is growing or falling, and whether it is above or below the zero line.
Overall, this indicator provides traders with a comprehensive tool for understanding the trend of an asset, as well as the momentum behind that trend. The moving averages provide a clear visual representation of the trend, while the MACD bars give insight into the strength of that trend and potential shifts in momentum.
---------------LONG ENTRY----------------
MA1 above MA2 and Overall trend = Green
IF RSI is above its midline you are confirmed for a long entry
-----------Short Entry--------------
MA1 below MA2 and Overall trend = Red
IF RSI is below its midline you are confirmed for a short entry

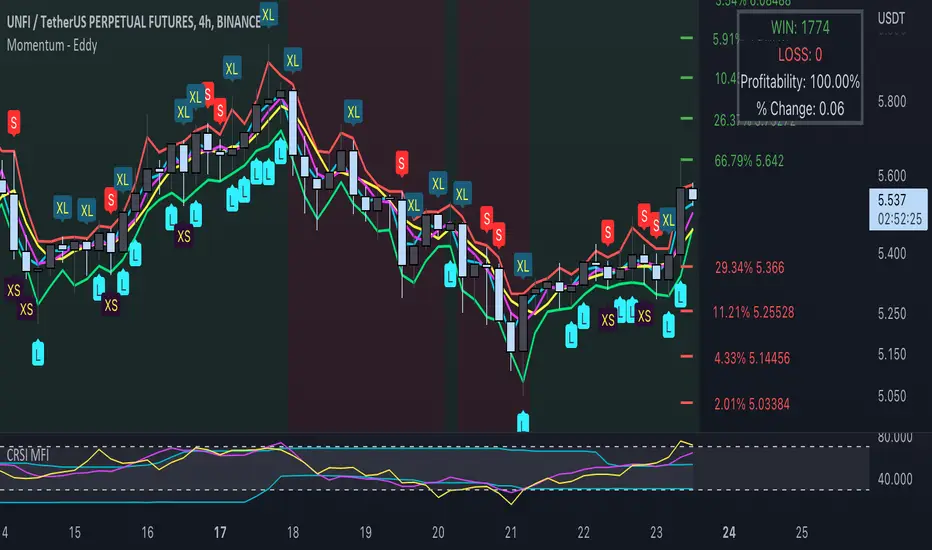
Momentum - EddyThis indicator uses momentum, emas, macd trend, probability to find the best entry for both long and short positions.
L = Long
When the low goes below the green line (ema fast low), close is above open and momentum is up
S = Short
When the high goes above the red line (ema fast high), close is below open and momentum is down
XS = Exit short at potential bullish pivot
When the low is below a red step (probability) and below ema fast low and both ema fast high and low are 0.5 % (can be changed in the settings) spread, and high is below ema fast low and open is at least 0.2 % spread (can be change in the settings).
XL = Exit long
When the high is above ema fast high and above a green step (probability) with at least 0.2 % spread (customizable in the settings)
The win rate changes based on the % change parameter. The lower the % change the higher the win rate will be.
Green and Red background shows you a bull trend or bear trend. It uses the Mac signal (periods are customizable in the settings).
You can add alerts for Long / Short / Exit Long / Exit short.
You can adjust parameters in the settings.
Use your own judgement to place trades. This algorithm helps you remove the stress of trading.
To avoid false signals trade from 4h timeframe +.
RelicusRoad - Signal LineWhen you have charts full of too many indicators, it can mess up with your analysis and cause analysis paralysis. Use RelicusRoad Signal Line to simply your charts with a beautiful color changing moving average line as per the strategies selected.
4 different strategies to choose from:
1) MACD
2) PMACD (Price Action + MACD)
3) Parabolic SAR
4) Momentum
GREEN: BUY ZONE
RED: SELL ZONE
FUNCTIONS OVERVIEW
MACD: Moving average convergence divergence ( MACD ) is a trend-following momentum indicator that shows the relationship between two moving averages of a security’s price. The MACD is calculated by subtracting the 26-period exponential moving average ( EMA ) from the 12-period EMA .
The result of that calculation is the MACD line. A 9 EMA of the MACD called the "signal line," is then plotted on top of the MACD line, which can function as a trigger for buy and sell signals. Traders may buy the security when the MACD crosses above its signal line and sell—or short—the security when the MACD crosses below the signal line. Moving average convergence divergence ( MACD ) indicators can be interpreted in several ways, but the more common methods are crossovers, divergences, and rapid rises/falls.
Moving average convergence divergence ( MACD ) is calculated by subtracting the 26-period exponential moving average ( EMA ) from the 12-period EMA .
MACD triggers technical signals when it crosses above (to buy) or below (to sell) its signal line.
The speed of crossovers is also taken as a signal of a market is overbought or oversold.
MACD helps investors understand whether the bullish or bearish movement in the price is strengthening or weakening.
PMACD: It's an improvement to MACD that you can use the Red/Green indications to make better decisions.
Parabolic SAR: The parabolic SAR indicator, developed by J. Wells Wilder, is used by traders to determine trend direction and potential reversals in price. The indicator uses a trailing stop and reverse method called "SAR," or stop and reverse, to identify suitable exit and entry points. Traders also refer to the indicator as the parabolic stop and reverse , parabolic SAR , or PSAR.
The parabolic SAR indicator appears on a chart as a series of dots, either above or below an asset's price, depending on the direction the price is moving. A dot is placed below the price when it is trending upward, and above the price when it is trending downward.
The parabolic SAR (stop and reverse) indicator is used by technical traders to spot trends and reversals.
The indicator utilizes a system of dots superimposed onto a price chart.
A reversal occurs when these dots flip, but a reversal signal in the SAR does not necessarily mean a reversal in the price. A PSAR reversal only means that the price and indicator have crossed.
Momentum: On paper, momentum investing seems less like an investing strategy and more like a knee-jerk reaction to market information. The idea of selling losers and buying winners is seductive, but it flies in the face of the tried and true Wall Street adage, "buy low, sell high."
Momentum investing is a trading strategy in which investors buy securities that are rising and sell them when they look to have peaked.
The goal is to work with volatility by finding buying opportunities in short-term uptrends and then sell when the securities start to lose momentum.
Then, the investor takes the cash and looks for the next short-term uptrend, or buying opportunity, and repeats the process.
Skilled traders understand when to enter into a position, how long to hold it for, and when to exit; they can also react to short-term, news-driven spikes or selloffs.
Risks of momentum trading include moving into a position too early, closing out too late, and getting distracted and missing key trends and technical deviations.
Jackrabbit.modulus.MACDThis is the MACD indicator for the Jackrabbit suite and modulus framework.
This indicator supports differential timeframe analysis and confirmational bias. Timeframes supported:
1 Second, 5 Seconds, 15 Seconds, 30 Seconds, 1 Minute, 5 Minutes, 15 Minutes, 30 Minutes, 45 Minutes, 1 Hour, 2 Hours, 3 Hours, 4 Hours, 6 Hours, 8 Hours, 12 Hours, and 1 Day
The main indicatior and the confirmational indicator can both be individually tuned for the fast, slow, and delta lines with different and independent lengths and 24 different moving average types:
SMA, Double SMA, Triple SMA,
EMA, Double EMA, Triple EMA,
WMA, Double WMA, Triple WMA,
VWMA, Double VWMA, Triple VWMA,
Hull, Double Hull, Triple Hull,
ZLEMA, Double ZLEMA, Triple ZLEMA,
SSMA, Double SSMA, Triple SSMA,
SMMA,Double SMMA, Triple SMMA
Both MACDs can also have their own source input: Open, Close, High, Low, HL2, HLC3, and OHLC4
The Jackrabbit modulus framework is a plug in play paradigm built to operate through TradingView's indicator on indicatior (IoI) functionality. As such, this script receives a signal line from the previous script in the IoI chain, and evaluates the buy/sell signals appropriate to the current analysis. The results are either combined with the signal line, or used as confirmation to the signal line. A new signal line is generated for the next script in the link.
Buy/Sell alerts are produced by the main Jackrabbit script, or the modulus AlertSystem script. This script is not designed or meant to function outside my framework and contains no alert capabilities.
By default, the signal line is visible and the charts are turned off. Signal line visibility is controlled by the Style tab, and the charts display is controlled by the indicator settings tab.
This script is by invitation only. To learn more about accessing this script, please see my signature or send me a PM. Thank you.

Indicator: Schaff Trend Cycle (STC)Another new indicator for TV community :)
STC detects up and down trends long before the MACD. It does this by using the same exponential moving averages (EMAs), but adds a cycle component to factor instrument cycle trends. STC gives more accuracy and reliability than the MACD.
More info: www.investopedia.com
Feel free to "Make mine" this chart and use the indicator in your charts. Appreciate any feedback on how effective this is for your instrument (I have tested this only with BTC).
For people trading BTC:
-------------------------------
Try 3/10 or 9/30 for MACD (fastLength/slowLength). They seem to catch the cycles better than the defaults. :)

REMS - Deep SynergyThis is a more flexible version of the REMS Synergy indicator. Like other indicators in the REMS family, it builds upon the foundations assessing the relationships between RSI, EMAs, MACDs, and Stochastic RSI across multiple timeframes. Designed to help traders identify less frequent, but high probability entries across 2 time frames. Uses 3 levels of confluence indicators for both long and short moves.
Features 3 levels of confluence across 2 timeframes. All 3 levels allow filtering of any combination of REMS filters. Features more options and customization than previous REMS Synergy.
Includes VWAP and 4 EMAs as optional visual representations.
Includes 'Enhanced Candles' than can colour code candlesticks for better visual identification. (off by default)
Originally designed with 5 minute and 2 minute timeframes in mind, and pairs well with REMS First Strike and/or REMS Snap Shot indicators.
This version features no hard-coded inputs and allows for more freedom than previous version. With the added flexibility comes the ability for the indicator to be more easily stacked.

Macd, Wt Cross & HVPMacd Wt Cross & HVP – Advanced Multi-Signal Indicator
This script is a custom-designed multi-signal indicator that brings together three proven concepts to provide a complete view of market momentum, reversals, and volatility build-ups. It is built for traders who want to anticipate key market moves, not just react to them.
Why This Combination ?
While each tool has its strengths, their combined use creates powerful signal confluence.
Instead of juggling multiple indicators separately, this script synchronizes three key perspectives into a single, intuitive display—helping you trade with greater clarity and confidence.
1. MACD Histogram – Momentum and Trend Clarity
At the core of the indicator is the MACD histogram, calculated as the difference between two exponential moving averages (EMAs).
Color-coded bars represent momentum direction and intensity:
Green / blue bars: bullish momentum
Red / pink bars: bearish momentum
Color intensity shows acceleration or weakening of trend.
This visual makes it easy to detect trend shifts and momentum divergence at a glance.
2. WT Cross Signals – Early Reversal Detection
Overlaid on the histogram are green and red dots, based on the logic of the WaveTrend oscillator cross:
Green dots = potential bullish cross (buy signal)
Red dots = potential bearish cross (sell signal)
These signals are helpful for identifying reversal points during both trending and ranging phases.
3. Historical Volatility Percentile (HVP) – Volatility Compression Zones
Behind the histogram, purple vertical zones highlight periods of low historical volatility, based on the HVP:
When volatility compresses below a specific threshold, these zones appear.
Such periods are often followed by explosive price moves, making them prime areas for pre-breakout positioning.
By integrating HVP, the script doesn’t just tell you where the trend is—it tells you when the trend is likely to erupt.
How to Use This Script
Use the MACD histogram to confirm the dominant trend and its strength.
Watch for WT Cross dots as potential entry/exit signals in alignment or divergence with the MACD.
Monitor HVP purple zones as warnings of incoming volatility expansions—ideal moments to prepare for breakout trades.
Best results occur when all three elements align, offering a high-probability trade setup.
What Makes This Script Original?
Unlike many mashups, this script was not created by simply merging indicators. Each component was carefully integrated to serve a specific, complementary purpose:
MACD detects directional bias
WT Cross adds precision timing
HVP anticipates volatility-based breakout timing
This results in a strategic tool for traders, useful on multiple timeframes and adaptable to different trading styles (trend-following, breakout, swing).

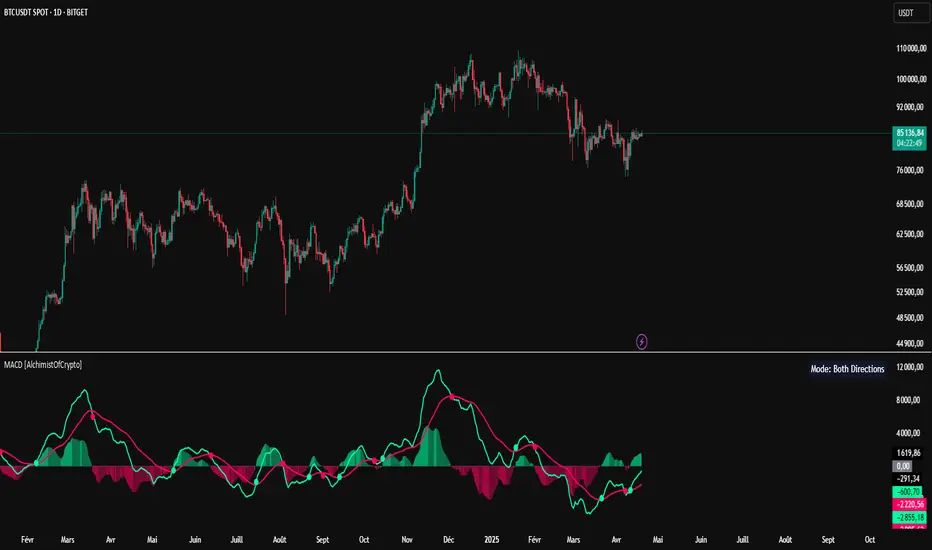
MACD [AlchimistOfCrypto]🌠 MACD Optimized with Python – Decoding the Chaos of Markets 🌠
Category: Trend Analysis 📈
"Like the dynamic systems studied in chaos theory, financial markets appear unpredictable at first glance. Yet, as Edward Lorenz demonstrated, even in apparent chaos reside harmonious mathematical structures. The MACD (Moving Average Convergence Divergence) represents this quest for order within disorder—a mathematical formulation that extracts coherent signals from price noise. By combining moving averages of different periods, this indicator reveals hidden cycles and precise moments when market energy shifts, like a pendulum obeying the immutable laws of physics."
📊 Technical Overview
The MACD Optimized with Python is a revolutionary take on the classic Moving Average Convergence Divergence indicator. Powered by Python-driven optimizations 🐍, it adapts to specific timeframes, delivering razor-sharp signals for traders seeking to navigate the market’s chaos with precision.
⚙️ How It Works
- Python-Optimized Parameters 🔧: Unlike the standard MACD (12,26,9), our version uses mathematically tailored parameters for each timeframe:
- 1H: 11/38/27
- 4H: 9/98/27
- 1D: 45/90/29
- 1W: 9/16/3
- 2W: 5/20/5
- Intuitive Visuals 🎨:
- Crossovers marked by colored dots 🟢🔴 for clear entry/exit signals.
- Histogram with a color gradient 🌈 to show direction and momentum intensity.
- Customizable Signals 🎯: Choose to display long, short, or both signals to match your trading style.
🚀 How to Use This Indicator
1. Select Your Timeframe ⏰: Choose the timeframe aligned with your trading horizon (1H, 4H, 1D, 1W, or 2W).
2. Spot Crossovers 🔍: Watch for the MACD line (green) crossing the signal line (red) to identify potential trend changes.
3. Confirm with Divergence ✅: Combine crossovers with price-MACD divergence for high-probability trend reversal signals.
📅 Release Notes
Unlock the hidden order of markets with this Python-optimized MACD. Stay tuned for future enhancements! ✨
🏷️ Tags
#Trading #TechnicalAnalysis #MACD #TrendAnalysis #Python #MultiTimeframe #Divergence #Momentum #TradingStrategy #RiskManagement #Forex #Stocks #Crypto #ChaosTheory #OptimizedTrading