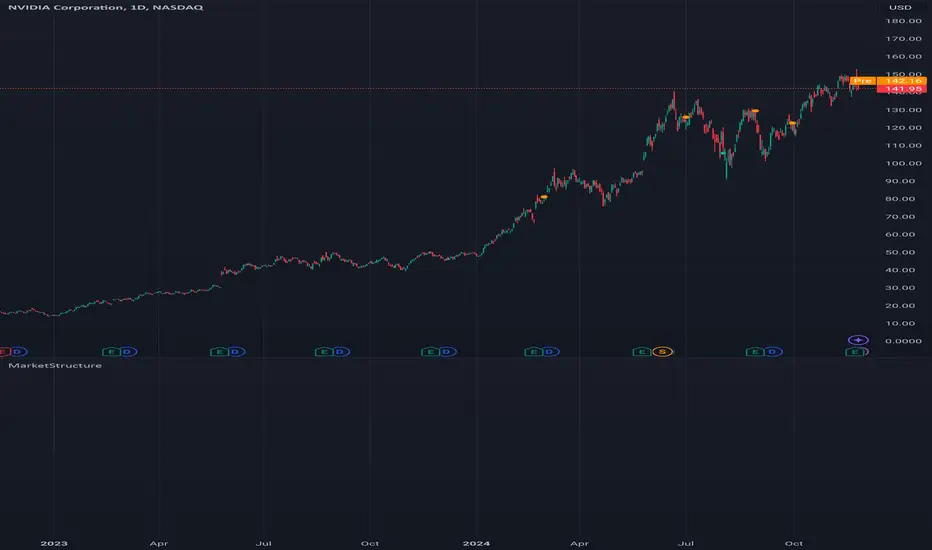
MarketStructureLibrary "MarketStructure"
Will draw out the market structure for the disired pivot length. The code is from my indicator "Marker structure" ().
Create(type, length, source, equalPivotsFactor, extendEqualPivotsZones, equalPivotsStyle, equalPivotsColor, alertFrequency)
Call on each bar. Will create a Structure object.
Parameters:
type (int) : the type of the Structure to create. 0 = internal, 1 = swing.
length (int) : The lenghts (left and right) for pivots to use.
source (string) : The source to be used for structural changes ('Close', 'High/low (aggresive)' (low in an uptrend) or 'High/low (passive)' (high in an uptrend)).
equalPivotsFactor (float) : Set how the limits are for an equal pivot. This is a factor of the Average True Length (ATR) of length 14. If a low pivot is considered to be equal if it doesn't break the low pivot (is at a lower value) and is inside the previous low pivot + this limit.
extendEqualPivotsZones (bool) : Set to true if you want the equal pivots zones to be extended.
equalPivotsStyle (string) : Set the style of equal pivot zones.
equalPivotsColor (color) : Set the color of equal pivot zones.
alertFrequency (string)
Returns: The 'structure' object.
Pivot(structure)
Sets the pivots in the structure.
Parameters:
structure (Structure)
Returns: The 'structure' object.
PivotLabels(structure)
Draws labels for the pivots found.
Parameters:
structure (Structure)
Returns: The 'structure' object.
EqualHighOrLow(structure)
Draws the boxsa for equal highs/lows. Also creates labels for the pivots included.
Parameters:
structure (Structure)
Returns: The 'structure' object.
BreakOfStructure(structure)
Will create lines when a break of strycture occures.
Parameters:
structure (Structure)
Returns: The 'structure' object.
ChangeOfCharacter(structure)
Will create lines when a change of character occures.
Parameters:
structure (Structure)
Returns: The 'structure' object.
StructureBreak
Holds drawings for a structure break.
Fields:
Line (series line) : The line object.
Label (series label) : The label object.
Pivot
Holds all the values for a found pivot.
Fields:
Price (series float) : The price of the pivot.
BarIndex (series int) : The bar_index where the pivot occured.
Type (series int) : The type of the pivot (-1 = low, 1 = high).
ChangeOfCharacterBroken (series bool) : Sets to true if a change of character has happened.
BreakOfStructureBroken (series bool) : Sets to true if a break of structure has happened.
Structure
Holds all the values for the market structure.
Fields:
Length (series int) : Define the left and right lengths of the pivots used.
Type (series int) : Set the type of the market structure. Two types can be used, 'internal' and 'swing' (0 = internal, 1 = swing).
Trend (series int) : This will be set internally and can be -1 = downtrend, 1 = uptrend.
Source (series string) : Set the source for structural chandeg. Can be 'Close', 'High/low (aggresive)' (low in an uptrend) or 'High/low (passive)' (high in an uptrend).
EqualPivotsFactor (series float) : Set how the limits are for an equal pivot. This is a factor of the Average True Length (ATR) of length 14. If a low pivot is considered to be equal if it doesn't break the low pivot (is at a lower value) and is inside the previous low pivot + this limit.
ExtendEqualPivotsZones (series bool) : Set to true if you want the equal pivots zones to be extended.
ExtendEqualPivotsStyle (series string) : Set the style of equal pivot zones.
ExtendEqualPivotsColor (series color) : Set the color of equal pivot zones.
EqualHighs (array) : Holds the boxes for zones that contains equal highs.
EqualLows (array) : Holds the boxes for zones that contains equal lows.
BreakOfStructures (array) : Holds all the break of structures within the trend (before a change of character).
Pivots (array) : All the pivots in the current trend, added with the latest first, this is cleared when the trend changes.
AlertFrequency (series string) : set the frequency for alerts.
Search in scripts for "marketstructure"
MarketStructureLibrary "MarketStructure"
This library contains functions for identifying Lows and Highs in a rule-based way, and deriving useful information from them.
f_simpleLowHigh()
This function finds Local Lows and Highs, but NOT in order. A Local High is any candle that has its Low taken out on close by a subsequent candle (and vice-versa for Local Lows).
The Local High does NOT have to be the candle with the highest High out of recent candles. It does NOT have to be a Williams High. It is not necessarily a swing high or a reversal or anything else.
It doesn't have to be "the" high, so don't be confused.
By the rules, Local Lows and Highs must alternate. In this function they do not, so I'm calling them Simple Lows and Highs.
Simple Highs and Lows, by the above definition, can be useful for entries and stops. Because I intend to use them for stops, I want them all, not just the ones that alternate in strict order.
@param - there are no parameters. The function uses the chart OHLC.
@returns boolean values for whether this bar confirms a Simple Low/High, and ints for the bar_index of that Low/High.
f_localLowHigh()
This function finds Local Lows and Highs, in order. A Local High is any candle that has its Low taken out on close by a subsequent candle (and vice-versa for Local Lows).
The Local High does NOT have to be the candle with the highest High out of recent candles. It does NOT have to be a Williams High. It is not necessarily a swing high or a reversal or anything else.
By the rules, Local Lows and Highs must alternate, and in this function they do.
@param - there are no parameters. The function uses the chart OHLC.
@returns boolean values for whether this bar confirms a Local Low/High, and ints for the bar_index of that Low/High.
f_enhancedSimpleLowHigh()
This function finds Local Lows and Highs, but NOT in order. A Local High is any candle that has its Low taken out on close by a subsequent candle (and vice-versa for Local Lows).
The Local High does NOT have to be the candle with the highest High out of recent candles. It does NOT have to be a Williams High. It is not necessarily a swing high or a reversal or anything else.
By the rules, Local Lows and Highs must alternate. In this function they do not, so I'm calling them Simple Lows and Highs.
Simple Highs and Lows, by the above definition, can be useful for entries and stops. Because I intend to use them for trailing stops, I want them all, not just the ones that alternate in strict order.
The difference between this function and f_simpleLowHigh() is that it also tracks the lowest/highest recent level. This level can be useful for trailing stops.
In effect, these are like more "normal" highs and lows that you would pick by eye, but confirmed faster in many cases than by waiting for the low/high of that particular candle to be taken out on close,
because they are instead confirmed by ANY subsequent candle having its low/high exceeded. Hence, I call these Enhanced Simple Lows/Highs.
The levels are taken from the extreme highs/lows, but the bar indexes are given for the candles that were actually used to confirm the Low/High.
This is by design, because it might be misleading to label the extreme, since we didn't use that candle to confirm the Low/High..
@param - there are no parameters. The function uses the chart OHLC.
@returns - boolean values for whether this bar confirms an Enhanced Simple Low/High
ints for the bar_index of that Low/High
floats for the values of the recent high/low levels
floats for the trailing high/low levels (for debug/post-processing)
bools for market structure bias
f_trueLowHigh()
This function finds True Lows and Highs.
A True High is the candle with the highest recent high, which then has its low taken out on close by a subsequent candle (and vice-versa for True Lows).
The difference between this and an Enhanced High is that confirmation requires not just any Simple High, but confirmation of the very candle that has the highest high.
Because of this, confirmation is often later, and multiple Simple Highs and Lows can develop within ranges formed by a single big candle without any of them being confirmed. This is by design.
A True High looks like the intuitive "real high" when you look at the chart. True Lows and Highs must alternate.
@param - there are no parameters. The function uses the chart OHLC.
@returns - boolean values for whether this bar confirms an Enhanced Simple Low/High
ints for the bar_index of that Low/High
floats for the values of the recent high/low levels
floats for the trailing high/low levels (for debug/post-processing)
bools for market structure bias

MarketStructureLibMarketStructure Library
This library extends the "MarketStructure" library by mickes () under the Mozilla Public License 2.0, credited to mickes. It provides functions for detecting and visualizing market structure, including Break of Structure (BOS), Change of Character (CHoCH), Equal High/Low (EQH/EQL), and liquidity zones, with enhancements for improved accuracy and customization.
Functionality
Market Structure Detection: Identifies internal (orderflow) and swing market structures using pivot points, with support for BOS, CHoCH, and EQH/EQL.
Volatility Filter: Only confirms pivots when the ATR exceeds a user-defined threshold, reducing false signals in low-volatility markets.
Trend Strength Metric: Calculates a trend strength score based on pivot frequency and volatility, stored in the Structure type for use in scripts.
Customizable Visualizations: Allows users to configure line styles and colors for BOS and CHoCH, and label sizes for pivots, BOS, CHoCH, and liquidity.
Liquidity Zones: Visualizes liquidity levels with confirmation bars and lookback periods.
Methodology
Pivot Detection: Uses ta.pivothigh and ta.pivotlow with a volatility filter (ATR multiplier) to confirm significant pivots.
Trend Strength: Computes a score as pivotCount / LeftLength * (currentATR / ATR), reflecting trend reliability based on pivot frequency and market volatility.
BOS/CHoCH Logic: Detects BOS when price breaks a pivot in the trend direction, and CHoCH when price reverses against the trend, with labels for "MSF" or "MSF+" based on pivot patterns.
EQH/EQL Zones: Creates boxes around equal highs/lows within an ATR-based threshold, with optional extension.
Visualization: Draws lines and labels for BOS, CHoCH, and liquidity, with user-defined styles, colors, and sizes.
Usage
Integration: Import into Pine Script indicators (e.g., import Fenomentn/MarketStructure/1) to analyze market structure.
Configuration: Set pivot lengths, volatility threshold, label sizes, and visualization styles via script inputs.
Alerts: Enable alerts for BOS, CHoCH, and EQH/EQL events, triggered on bar close to avoid repainting.
Best Practices: Use on forex or crypto charts (1m to 12h timeframes) for optimal results. Adjust the volatility threshold for different market conditions.
Originality
This library builds on mickes’ framework by adding:
A volatility-based pivot filter to enhance signal accuracy.
A trend strength metric for assessing trend reliability.
Dynamic label sizing and customizable visualization styles for better usability. No additional open-source code was reused beyond mickes’ library, credited under MPL 2.0.
Developed by Fenomentn. Published under Mozilla Public License 2.0.

LibPvotLibrary "LibPvot"
This is a library for advanced technical analysis, specializing
in two core areas: the detection of price-oscillator
divergences and the analysis of market structure. It provides
a back-end engine for signal detection and a toolkit for
indicator plotting.
Key Features:
1. **Complete Divergence Suite (Class A, B, C):** The engine detects
all three major types of divergences, providing a full spectrum of
analytical signals:
- **Regular (A):** For potential trend reversals.
- **Hidden (B):** For potential trend continuations.
- **Exaggerated (C):** For identifying weakness at double tops/bottoms.
2. **Advanced Signal Filtering:** The detection logic uses a
percentage-based price tolerance (`prcTol`). This feature
enables the practical detection of Exaggerated divergences
(which rarely occur at the exact same price) and creates a
"dead zone" to filter insignificant noise from triggering
Regular divergences.
3. **Pivot Synchronization:** A bar tolerance (`barTol`) is used
to reliably match price and oscillator pivots that do not
align perfectly on the same bar, preventing missed signals.
4. **Signal Invalidation Logic:** Features two built-in invalidation
rules:
- An optional `invalidate` parameter automatically terminates
active divergences if the price or the oscillator breaks
the level of the confirming pivot.
- The engine also discards 'half-pivots' (e.g., a price pivot)
if a corresponding oscillator pivot does not appear within
the `barTol` window.
5. **Stateful Plotting Helpers:** Provides helper functions
(`bullDivPos` and `bearDivPos`) that abstract away the
state management issues of visualizing persistent signals.
They generate gap-free, accurately anchored data series
ready to be used in `plotshape` functions, simplifying
indicator-side code.
6. **Rich Data Output:** The core detection functions (`bullDiv`, `bearDiv`)
return a comprehensive 9-field data tuple. This includes the
boolean flags for each divergence type and the precise
coordinates (price, oscillator value, bar index) of both the
starting and the confirming pivots.
7. **Market Structure & Trend Analysis:** Includes a
`marketStructure` function to automatically identify pivot
highs/lows, classify their relationship (HH, LH, LL, HL),
detect structure breaks, and determine the current trend
state (Up, Down, Neutral) based on pivot sequences.
---
**DISCLAIMER**
This library is provided "AS IS" and for informational and
educational purposes only. It does not constitute financial,
investment, or trading advice.
The author assumes no liability for any errors, inaccuracies,
or omissions in the code. Using this library to build
trading indicators or strategies is entirely at your own risk.
As a developer using this library, you are solely responsible
for the rigorous testing, validation, and performance of any
scripts you create based on these functions. The author shall
not be held liable for any financial losses incurred directly
or indirectly from the use of this library or any scripts
derived from it.
bullDiv(priceSrc, oscSrc, leftLen, rightLen, depth, barTol, prcTol, persist, invalidate)
Detects bullish divergences (Regular, Hidden, Exaggerated) based on pivot lows.
Parameters:
priceSrc (float) : series float Price series to check for pivots (e.g., `low`).
oscSrc (float) : series float Oscillator series to check for pivots.
leftLen (int) : series int Number of bars to the left of a pivot (default 5).
rightLen (int) : series int Number of bars to the right of a pivot (default 5).
depth (int) : series int Maximum number of stored pivot pairs to check against (default 2).
barTol (int) : series int Maximum bar distance allowed between the price pivot and the oscillator pivot (default 3).
prcTol (float) : series float The percentage tolerance for comparing pivot prices. Used to detect Exaggerated
divergences and filter out market noise (default 0.05%).
persist (bool) : series bool If `true` (default), the divergence flag stays active for the entire duration of the signal.
If `false`, it returns a single-bar pulse on detection.
invalidate (bool) : series bool If `true` (default), terminates an active divergence if price or oscillator break
below the confirming pivot low.
Returns: A tuple containing comprehensive data for a detected bullish divergence.
regBull series bool `true` if a Regular bullish divergence (Class A) is active.
hidBull series bool `true` if a Hidden bullish divergence (Class B) is active.
exgBull series bool `true` if an Exaggerated bullish divergence (Class C) is active.
initPivotPrc series float Price value of the initial (older) pivot low.
initPivotOsz series float Oscillator value of the initial pivot low.
initPivotBar series int Bar index of the initial pivot low.
lastPivotPrc series float Price value of the last (confirming) pivot low.
lastPivotOsz series float Oscillator value of the last pivot low.
lastPivotBar series int Bar index of the last pivot low.
bearDiv(priceSrc, oscSrc, leftLen, rightLen, depth, barTol, prcTol, persist, invalidate)
Detects bearish divergences (Regular, Hidden, Exaggerated) based on pivot highs.
Parameters:
priceSrc (float) : series float Price series to check for pivots (e.g., `high`).
oscSrc (float) : series float Oscillator series to check for pivots.
leftLen (int) : series int Number of bars to the left of a pivot (default 5).
rightLen (int) : series int Number of bars to the right of a pivot (default 5).
depth (int) : series int Maximum number of stored pivot pairs to check against (default 2).
barTol (int) : series int Maximum bar distance allowed between the price pivot and the oscillator pivot (default 3).
prcTol (float) : series float The percentage tolerance for comparing pivot prices. Used to detect Exaggerated
divergences and filter out market noise (default 0.05%).
persist (bool) : series bool If `true` (default), the divergence flag stays active for the entire duration of the signal.
If `false`, it returns a single-bar pulse on detection.
invalidate (bool) : series bool If `true` (default), terminates an active divergence if price or oscillator break
above the confirming pivot high.
Returns: A tuple containing comprehensive data for a detected bearish divergence.
regBear series bool `true` if a Regular bearish divergence (Class A) is active.
hidBear series bool `true` if a Hidden bearish divergence (Class B) is active.
exgBear series bool `true` if an Exaggerated bearish divergence (Class C) is active.
initPivotPrc series float Price value of the initial (older) pivot high.
initPivotOsz series float Oscillator value of the initial pivot high.
initPivotBar series int Bar index of the initial pivot high.
lastPivotPrc series float Price value of the last (confirming) pivot high.
lastPivotOsz series float Oscillator value of the last pivot high.
lastPivotBar series int Bar index of the last pivot high.
bullDivPos(regBull, hidBull, exgBull, rightLen, yPos)
Calculates the plottable data series for bullish divergences. It manages
the complex state of a persistent signal's plotting window to ensure
gap-free and accurately anchored visualization.
Parameters:
regBull (bool) : series bool The regular bullish divergence flag from `bullDiv`.
hidBull (bool) : series bool The hidden bullish divergence flag from `bullDiv`.
exgBull (bool) : series bool The exaggerated bullish divergence flag from `bullDiv`.
rightLen (int) : series int The same `rightLen` value used in `bullDiv` for correct timing.
yPos (float) : series float The series providing the base Y-coordinate for the shapes (e.g., `low`).
Returns: A tuple of three `series float` for plotting bullish divergences.
regBullPosY series float Contains the static anchor Y-value for Regular divergences where a shape should be plotted; `na` otherwise.
hidBullPosY series float Contains the static anchor Y-value for Hidden divergences where a shape should be plotted; `na` otherwise.
exgBullPosY series float Contains the static anchor Y-value for Exaggerated divergences where a shape should be plotted; `na` otherwise.
bearDivPos(regBear, hidBear, exgBear, rightLen, yPos)
Calculates the plottable data series for bearish divergences. It manages
the complex state of a persistent signal's plotting window to ensure
gap-free and accurately anchored visualization.
Parameters:
regBear (bool) : series bool The regular bearish divergence flag from `bearDiv`.
hidBear (bool) : series bool The hidden bearish divergence flag from `bearDiv`.
exgBear (bool) : series bool The exaggerated bearish divergence flag from `bearDiv`.
rightLen (int) : series int The same `rightLen` value used in `bearDiv` for correct timing.
yPos (float) : series float The series providing the base Y-coordinate for the shapes (e.g., `high`).
Returns: A tuple of three `series float` for plotting bearish divergences.
regBearPosY series float Contains the static anchor Y-value for Regular divergences where a shape should be plotted; `na` otherwise.
hidBearPosY series float Contains the static anchor Y-value for Hidden divergences where a shape should be plotted; `na` otherwise.
exgBearPosY series float Contains the static anchor Y-value for Exaggerated divergences where a shape should be plotted; `na` otherwise.
marketStructure(highSrc, lowSrc, leftLen, rightLen, srcTol)
Analyzes the market structure by identifying pivot points, classifying
their sequence (e.g., Higher Highs, Lower Lows), and determining the
prevailing trend state.
Parameters:
highSrc (float) : series float Price series for pivot high detection (e.g., `high`).
lowSrc (float) : series float Price series for pivot low detection (e.g., `low`).
leftLen (int) : series int Number of bars to the left of a pivot (default 5).
rightLen (int) : series int Number of bars to the right of a pivot (default 5).
srcTol (float) : series float Percentage tolerance to consider two pivots as 'equal' (default 0.05%).
Returns: A tuple containing detailed market structure information.
pivType series PivType The type of the most recently formed pivot (e.g., `hh`, `ll`).
lastPivHi series float The price level of the last confirmed pivot high.
lastPivLo series float The price level of the last confirmed pivot low.
lastPiv series float The price level of the last confirmed pivot (either high or low).
pivHiBroken series bool `true` if the price has broken above the last pivot high.
pivLoBroken series bool `true` if the price has broken below the last pivot low.
trendState series TrendState The current trend state (`up`, `down`, or `neutral`).

PriceActionLibrary "PriceAction"
Hi all!
This library will help you to plot the market structure and liquidity. By now, the only part in the price action section is liquidity, but I plan to add more later on. The market structure will be split into two parts, 'Internal' and 'Swing' with separate pivot lengths. For these two trends it will show you:
• Break of structure (BOS)
• Change of character (CHoCH/CHoCH+) (mandatory)
• Equal high/low (EQH/EQL)
It's inspired by "Smart Money Concepts (SMC) " by LuxAlgo.
This library is now the same code as the code in my library 'MarketStructure', but it has evolved into a more price action oriented library than just a market structure library. This is more accurate and I will continue working on this library to keep it growing.
This code does not provide any examples, but you can look at my indicators 'Market structure' () and 'Order blocks' (), where I use the 'MarketStructure' library (which is the same code).
Market structure
Both of these market structures can be enabled/disabled by setting them to 'na'. The pivots lengths can be configured separately. The pivots found will be the 'base' of and will show you when price breaks it. When that happens a break of structure or a change of character will be created. The latest 5 pivots found within the current trends will be kept to take action on. They are cleared on a change of character, so nothing (break of structures or change of characters) can happen on pivots before a trend change. The internal market structure is shown with dashed lines and swing market structure is shown with solid lines.
Labels for a change of character can have either the text 'CHoCH' or 'CHoCH+'. A Change of Character plus is formed when price fails to form a higher high or a lower low before reversing. Note that a pivot that is created after the change of character might have a higher high or a lower low, thus not making the break a 'CHoCH+'. This is not changed after the pivot is found but is kept as is.
A break of structure is removed if an earlier pivot within the same trend is broken, i.e. another break of structure (with a longer distance) is created. Like in the images below, the first pivot (in the first image) is removed when an earlier pivot's higher price within the same trend is broken (the second image):
[image [https://www.tradingview.com/x/PRP6YtPA/
Equal high/lows have a configurable color setting and can be configured to be extended to the right. Equal high/lows are only possible if it's not been broken by price. A factor (percentage of width) of the Average True Length (of length 14) that the pivot must be within to to be considered an Equal high/low. Equal highs/lows can be of 2 pivots or more.
You are able to show the pivots that are used. "HH" (higher high), "HL" (higher low), "LH" (lower high), "LL" (lower low) and "H"/"L" (for pivots (high/low) when the trend has changed) are the labels used. There are also labels for break of structures ('BOS') and change of characters ('CHoCH' or 'CHoCH+'). The size of these texts is set in the 'FontSize' setting.
When programming I focused on simplicity and ease of read. I did not focus on performance, I will do so if it's a problem (haven't noticed it is one yet).
You can set alerts for when a change of character, break of structure or an equal high/low (new or an addition to a previously found) happens. The alerts that are fired are on 'once_per_bar_close' to avoid repainting. This has the drawback to alert you when the bar closes.
Price action
The indicator will create lines and zones for spotted liquidity. It will draw a line (with dotted style) at the price level that was liquidated, but it will also draw a zone from that level to the bar that broke the pivot high or low price. If that zone is large the liquidation is big and might be significant. This can be disabled in the settings. You can also change the confirmation candles (that does not close above or below the pivot level) needed after a liquidation and how many pivots back to look at.
The lines and boxes drawn will look like this if the color is orange:
Hope this is of help!
Will draw out the market structure for the disired pivot length.
Liqudity(liquidity)
Will draw liquidity.
Parameters:
liquidity (Liquidity) : The 'PriceAction.Liquidity' object.
Pivot(structure)
Sets the pivots in the structure.
Parameters:
structure (Structure)
PivotLabels(structure)
Draws labels for the pivots found.
Parameters:
structure (Structure)
EqualHighOrLow(structure)
Draws the boxes for equal highs/lows. Also creates labels for the pivots included.
Parameters:
structure (Structure)
BreakOfStructure(structure)
Will create lines when a break of strycture occures.
Parameters:
structure (Structure)
Returns: A boolean that represents if a break of structure was found or not.
ChangeOfCharacter(structure)
Will create lines when a change of character occures. This line will have a label with "CHoCH" or "CHoCH+".
Parameters:
structure (Structure)
Returns: A boolean that represents if a change of character was found or not.
VisualizeCurrent(structure)
Will create a box with a background for between the latest high and low pivots. This can be used as the current trading range (if the pivots broke strucure somehow).
Parameters:
structure (Structure)
StructureBreak
Holds drawings for a structure break.
Fields:
Line (series line) : The line object.
Label (series label) : The label object.
Pivot
Holds all the values for a found pivot.
Fields:
Price (series float) : The price of the pivot.
BarIndex (series int) : The bar_index where the pivot occured.
Type (series int) : The type of the pivot (-1 = low, 1 = high).
Time (series int) : The time where the pivot occured.
BreakOfStructureBroken (series bool) : Sets to true if a break of structure has happened.
LiquidityBroken (series bool) : Sets to true if a liquidity of the price level has happened.
ChangeOfCharacterBroken (series bool) : Sets to true if a change of character has happened.
Structure
Holds all the values for the market structure.
Fields:
LeftLength (series int) : Define the left length of the pivots used.
RightLength (series int) : Define the right length of the pivots used.
Type (series Type) : Set the type of the market structure. Two types can be used, 'internal' and 'swing' (0 = internal, 1 = swing).
Trend (series int) : This will be set internally and can be -1 = downtrend, 1 = uptrend.
EqualPivotsFactor (series float) : Set how the limits are for an equal pivot. This is a factor of the Average True Length (ATR) of length 14. If a low pivot is considered to be equal if it doesn't break the low pivot (is at a lower value) and is inside the previous low pivot + this limit.
ExtendEqualPivotsZones (series bool) : Set to true if you want the equal pivots zones to be extended.
ExtendEqualPivotsStyle (series string) : Set the style of equal pivot zones.
ExtendEqualPivotsColor (series color) : Set the color of equal pivot zones.
EqualHighs (array) : Holds the boxes for zones that contains equal highs.
EqualLows (array) : Holds the boxes for zones that contains equal lows.
BreakOfStructures (array) : Holds all the break of structures within the trend (before a change of character).
Pivots (array) : All the pivots in the current trend, added with the latest first, this is cleared when the trend changes.
FontSize (series int) : Holds the size of the font displayed.
AlertChangeOfCharacter (series bool) : Holds true or false if a change of character should be alerted or not.
AlertBreakOfStructure (series bool) : Holds true or false if a break of structure should be alerted or not.
AlerEqualPivots (series bool) : Holds true or false if equal highs/lows should be alerted or not.
Liquidity
Holds all the values for liquidity.
Fields:
LiquidityPivotsHigh (array) : All high pivots for liquidity.
LiquidityPivotsLow (array) : All low pivots for liquidity.
LiquidityConfirmationBars (series int) : The number of bars to confirm that a liquidity is valid.
LiquidityPivotsLookback (series int) : A number of pivots to look back for.
FontSize (series int) : Holds the size of the font displayed.
PriceAction
Holds all the values for the general price action and the market structures.
Fields:
Liquidity (Liquidity)
Swing (Structure) : Placeholder for all objects used for the swing market structure.
Internal (Structure) : Placeholder for all objects used for the internal market structure.

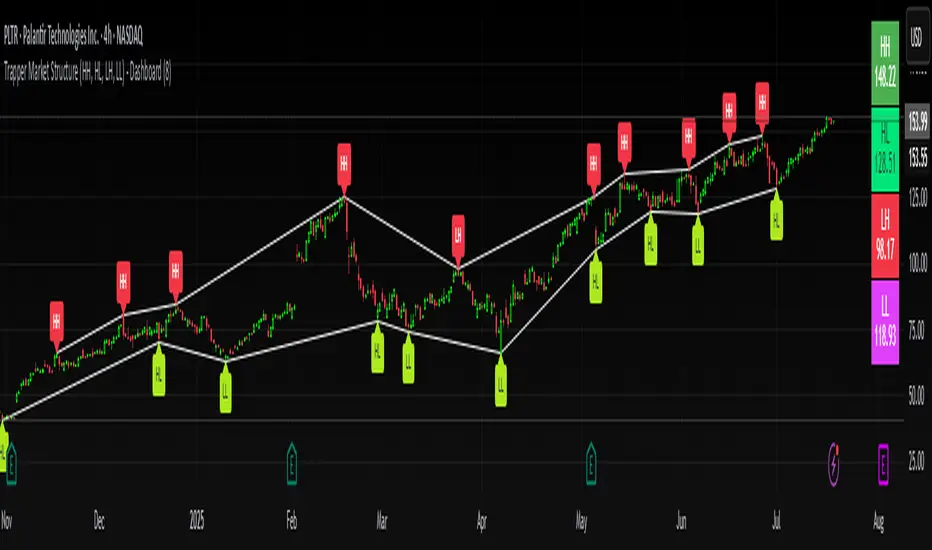
Trapper Market Structure (HH, HL, LH, LL)This script is designed to visually identify price action market structure in real time using pivot-based logic. It highlights the key components of trend direction by labeling:
- **HH** – Higher Highs
- **HL** – Higher Lows
- **LH** – Lower Highs
- **LL** – Lower Lows
These labels help traders track evolving market conditions and spot trend continuations, breaks in structure, or potential reversals — all without guessing.
**How It Works**
The script detects local swing highs and lows based on a customizable pivot strength. Once a valid pivot is confirmed, it’s classified in context with the previous relevant pivot to determine its structural significance.
For example:
- If a pivot high is higher than the previous, it’s marked as a **HH**.
- If a pivot low is lower than the previous, it’s marked as a **LL**, and so on.
This running analysis helps traders anticipate shifts between bullish and bearish structures.
**Customizable Features**
- Adjust **Pivot Strength** to increase or reduce sensitivity (more reactive or more stable)
- Toggle **Labels** on/off for cleaner charts
- Toggle **Connecting Lines** between pivots to visualize structure flow
**Use Case**
This indicator is ideal for:
- Price action traders
- Market structure analysis
- Identifying entry zones during pullbacks (e.g., buying at HLs during uptrends)
- Confirming trend reversals or break-of-structure (BoS)
You can use this tool as a foundation for more advanced systems such as CHoCH/BOS detection, liquidity zones, or sniper-style entry frameworks.
**Concepts Used**
- Swing High/Low detection using `ta.pivothigh` and `ta.pivotlow`
- Market structure labeling logic
- Visual flow to reinforce trader psychology on trend states
Disclaimer
This script is provided for educational purposes only. It is not financial advice and should not be relied upon for trading decisions. Always conduct your own analysis and risk management.
#marketstructure #priceaction #technicalanalysis #tradingviewopen #pivotpoints
VWAP TrendSignalVWAP TrendSignal
VWAP (Volume-Weighted Average Price) is the market’s true fair value — the benchmark institutions use to see when price is balanced, extended, or trending with real intent.
Price often snaps back when it moves too far (mean reversion), and only shows genuine strength when it holds above or below VWAP.
VWAP TrendSignal makes this insight effortless by color-coding VWAP direction:
Yellow = VWAP rising → bullish pressure
Red = VWAP falling → bearish pressure
No bands. No noise. Just pure directional clarity.
Anchor VWAP to the Session, Week, Month, Quarter, or Year, and tailor the Slope Smoothing Filter to your timeframe:
1–2 smoothing → fast & reactive (1–5m scalping)
3–5 smoothing → clean & stable (5–15m intraday)
6–10 smoothing → slow flips (1H–4H swings)
10–15 smoothing → macro bias only (Daily/Weekly)
The line adapts to how you trade.
How to Use It
Mean Reversion
When price stretches far from VWAP, expect pullbacks or snapbacks.
Trend Direction
Yellow supports long bias, red supports short bias.
Simple, reliable, instantly visible.
Balance Zones
Price sitting near VWAP = compression, buildup, or chop.
A perfect signal to wait or prepare for a breakout.
Why It Works
VWAP TrendSignal distills institutional logic into a clean, single-line tool.
It shows fair value, trend slope, and balance all at once — making your chart clearer and your decisions faster.
Once you get used to reading it, trading without it feels blind.

Market structure + TF Bucket Market Structure + TF Bucket
This Pine Script™ indicator, published under the Mozilla Public License 2.0, extends the "Market Structure" script by mickes (), with full credit to mickes. It integrates the enhanced MarketStructure library by Fenomentn (), also based on mickes’ library under MPL 2.0, to provide advanced market structure analysis with multi-timeframe pivot length customization.
Functionality
Market Structure Analysis: Detects internal (orderflow) and swing market structures, visualizing Break of Structure (BOS), Change of Character (CHoCH), Equal High/Low (EQH/EQL), and liquidity zones using the MarketStructure library.
Timeframe Bucket (TF Bucket): Dynamically adjusts pivot lengths for six user-defined timeframes (e.g., 3m, 5m, 10m, 15m, 4h, 12h), optimizing structure detection across different chart timeframes.
Trend Strength Visualization: Displays a trend strength metric (from the library) for internal and swing structures, indicating trend reliability based on pivot frequency and volatility.
Statistics Table: Shows yearly counts of BOS and CHoCH events for internal and swing structures, configurable by a user-defined period.
Screener Support: Outputs BOS and CHoCH signals for TradingView’s screener, with a configurable signal persistence period.
Customizable Alerts: Enables alerts for BOS and CHoCH events, separately configurable for internal and swing structures.
Methodology
Pivot Detection: Uses the library’s Pivot function, which applies a volatility filter (ATR-based) to confirm significant pivots, reducing false signals in low-volatility markets.
TF Bucket: Maps user-selected timeframes to Pine Script’s timeframe.period using f_getTimeframePeriod, applying custom pivot lengths when the chart’s timeframe matches a selected one (or base lengths in Static mode).
Trend Strength: Calculates a score as pivotCount / LeftLength * (currentATR / ATR), displayed via labels to help traders assess trend reliability.
BOS/CHoCH Detection: Identifies BOS when price breaks a pivot in the trend direction and CHoCH when price reverses against the trend, labeling events as “MSF” or “MSF+” based on pivot patterns.
EQH/EQL and Liquidity: Draws boxes for equal high/low zones within ATR-based thresholds and visualizes liquidity levels with confirmation bars.
Statistics and Screener: Tracks BOS/CHoCH events in a yearly table and outputs signals for screener use, with persistence controlled by a user-defined period.
Usage
Integration: Apply the indicator to any chart and import the library via import Fenomentn/MarketStructure/1.
Configuration: Set up to six timeframes with custom pivot lengths, enable/disable internal and swing structures, configure alerts, and adjust statistics years in the settings panel.
Alerts: Enable BOS and CHoCH alerts for real-time notifications, triggered on bar close to avoid repainting.
Screener: Use the plotted signals to monitor BOS/CHoCH events across multiple tickers in TradingView’s screener.
Best Practices: Optimal for forex and crypto charts on 1m to 12h timeframes. Adjust pivot lengths and the library’s volatility threshold for specific market conditions.
Originality
This indicator enhances mickes’ original script with:
Timeframe Bucket: Dynamic pivot length selection for multi-timeframe analysis, not present in the original.
Trend Strength Display: Visualizes the library’s TrendStrength metric for enhanced trend analysis.
Enhanced Library Integration: Leverages Fenomentn/MarketStructure/1, which adds a volatility-based pivot filter, dynamic label sizing, and customizable BOS/CHoCH visualization styles.No additional open-source code was reused beyond mickes’ script and library, fully credited under MPL 2.0.

Market Structures SMC [TradingFinder] BOS/CHoCH Major & Minor🟣Introduction
Understanding market structure involves analyzing market behavior. In other words, market structure encompasses how the market forms and evolves within trends.
Market structures are typically fractal and nested, so we categorize them into internal (minor) and external (major) structures. There are various definitions of market structure, with different approaches such as Smart Money and ICT providing their own interpretations.
🟣How to Use
The first step in identifying market structure is to analyze key highs and lows. An uptrend is formed when highs and lows are successively higher than previous ones. Similarly, in a downtrend, lows and highs are successively lower than previous ones.
Market trends consist of two types of movements :
•Impulsive movements
•Corrective movements
Impulsive movements align with the main trend and possess high strength and momentum. Conversely, corrective movements go against the main trend and have lower strength and momentum. The following example illustrates these concepts.
🔵 Identifying Break of Structure (BOS)
In a specific trend, for example in a downtrend, when the price breaks below the previous low and forms a new low (LL), a Break of Structure occurs. In an uptrend, a BOS (Market Structure Break or MSB) happens when the price rises and surpasses the last high.
We need at least one BOS to confirm a trend. Breaking above or below the previous high or low must be confirmed by closing at least one candle after that level.
🔵 Identifying Change of Character (CHOCH)
Change of Character (CHOCH) is a key concept in market structure analysis. A change in structure signals a trend change. In other words, a trend ends with a CHOCH (Market Structure Shift or MSS). For instance, in a downtrend, the price declines with BOS.
BOS indicates the strength of the trend, but when the price increases and surpasses the last high, a CHOCH occurs, signaling a shift from a downtrend to an uptrend.
This does not mean entering a buy trade; instead, we should wait for a BOS in the upward direction to confirm the uptrend. Unlike BOS, confirming a CHOCH does not require a candle to close; simply breaking above or below the previous high or low with the candle's wick is sufficient. The following examples show bearish and bullish CHOCH.
🔵 Range Market Structure
Besides uptrends and downtrends, a third structure often found in the market is the range or sideways structure. In this state, the power of buyers and sellers is almost equal, and the market lacks a clear trend.
Many traders believe that the Forex market ranges 80% of the time. Therefore, it requires a lot of patience to wait for a new trend to start.
🟣 Settings
Through the settings, you can customize the display, visibility, and color of each line as desired.

ICT HTF MSS & Liquidity (fadi)ICT HTF MSS & Liquidity provides higher timeframe view of where the liquidity may reside and when higher timeframe market structure shift has occurred.
In his 2022 mentorship, ICT has advocated used the 15m chart to watch for liquidity and looking for lower timeframes for entry (5m,4m,3m,2m,1m).
Liquidity will reside above pivot points and ICT pivot points are based on 3 candle formation for the short term, three short term formation for intermediate, and three intermediate formation for the long terms.
Options
Timeframe Timeframe to monitor
Use the Short, Intermediate, or Long Term highs and lows
Liquidity Styles
Open liquidity line style, size, and color
Claimed liquidity line style, size, and color
Extend the open liquidity line beyond the current candle
Number of lines to display, this includes claimed and open

Market Structure (Breakers) [LuxAlgo]The Market Structure (Breakers) indicator aims to detect "Breaker Market Structures", an original concept inspired by breaker blocks, and extend on the original concept of market structures by extending existing MS levels, providing supports/resistances as a result.
Various graphical elements are included that highlight the interactions between price and Breaker structures.
🔶 USAGE
Breaker structures occur when a market structure is confirmed (price breaking a previous swing level). The broken swing point is extended by a dotted line which can be used as potential support or resistance.
After a market structure, the price can eventually reverse and break one or multiple breaker structures at the same time, allowing for the detection of new trends in the price.
A market structure closer to the top/bottom of a trend can return Breaker structures breakouts more indicative of potential reversals.
Breakers MS breakouts can also be useful as exits for entries done using market market structures.
The script additionally highlights support/resistance events by highlighting candle borders, with a border using a green color indicating support events while a red color is indicative of a resistance event.
🔹 Breaker Structure Lifespan
The "lifespan" of Breaker structures, that is the amount of time the script will extend/evaluate them is determined by various user settings.
The Maximum Breaks setting determines the maximum amount of breaks a breaker structure can withstand before it is broken.
For example, a maximum amount of breaks of 3 for a bearish breaker structure would require the price to cross under that precise breaker structure level three times. Using higher values of this setting will also highlight more Breakers MS.
The Breaker Maximum Duration setting on the other hand determines how many bars a breaker structure can be evaluated without being broken. If a breaker structure is not broken after this amount of bars then it will stop being evaluated and will be removed.
🔶 SETTINGS
Swings Period: Period used for the swing detection, with higher values returning longer term markter structures.
Maximum Breaks: Amount of break required for a breaker block to be considered broken.
Breaker Maximum Duration: Maximum duration of a breaker block (in bars).

Support and Resistance Breakout Signals [MarkitTick]💡 This indicator provides a comprehensive, automated system for identifying, tracking, and trading Support and Resistance (S/R) breakouts. By synthesizing classic Swing High and Swing Low pivot analysis with Multi-Timeframe (HTF) capabilities and Volume confirmation, it transforms raw price action into actionable structural data. It is designed to declutter charts by automatically managing active levels and highlighting significant market structure shifts (Higher Highs, Lower Lows) alongside verified breakout signals.
✨ Originality and Utility
While many indicators draw static pivot points, this tool distinguishes itself through "State Management." It treats Support and Resistance not just as historical markers, but as active zones that evolve.
Dynamic Level Management: Instead of flooding the chart with infinite lines, the script uses arrays to store a specific number of recent levels. As price action progresses, invalid or broken levels are removed or updated, keeping the analysis focused on current relevance.
Multi-Timeframe Confluence: Uniquely, it allows you to overlay higher timeframe support and resistance levels (e.g., Daily levels on a 4-hours chart) without changing your chart view, enabling top-down analysis instantly.
Market Structure Labeling: It automatically tags pivot points with Dow Theory labels (HH, LH, LL, HL), aiding traders in instantly recognizing trend direction without manual charting.
🔬 Methodology and Concepts
The script operates on three core technical pillars:
● Swing Pivot Detection
The foundation is the detection of local extrema using a "Left/Right" bar lookback mechanism. A Swing High is identified when a high is greater than the L bars preceding it and the R bars following it. This confirms a fractal peak or valley.
Note on Confirmation: Because the script waits for R bars to close to confirm a pivot, the lines appear retroactively. However, the extension of these lines and subsequent breakout signals occur in real-time.
● Breakout Logic with Volume Integration
A breakout is triggered when the Close price crosses an active S/R line.
Resistance Break: Current Close > Resistance Level (and Previous Close ≤ Level).
Support Break: Current Close < Support Level (and Previous Close ≥ Level).
Volume Confirmation: An optional filter requires the breakout bar's volume to exceed a Moving Average of volume, ensuring momentum backs the move.
● Time Decay
To mimic the reduced relevance of stale levels, the script includes a "Time Decay" feature. If a level is not interacted with for a user-defined number of bars, it is automatically purged from the system, ensuring the chart reflects only fresh interest levels.
🎨 Visual Guide
The indicator uses a specific color-coding and labeling system to convey information quickly:
● Support & Resistance Lines
Red Lines (Thin): Represent active Resistance levels on the current timeframe.
Green Lines (Thin): Represent active Support levels on the current timeframe.
Fuchsia Lines (Thick): Represent Higher Timeframe (HTF) Resistance levels.
Aqua Lines (Thick): Represent Higher Timeframe (HTF) Support levels.
● Market Structure Labels
Located at the pivot points, these text labels define the trend structure:
HH / LH: Higher High / Lower High (Red Text).
LL / HL: Lower Low / Higher Low (Green/Aqua Text).
HTF-R / HTF-S: Indicates major structural pivots from the higher timeframe.
● Breakout Signals
When a valid break occurs, a label appears above or below the bar:
Blue Triangle Up (▲): Bullish breakout through resistance.
Blue Triangle Down (▼): Bearish breakout through support.
Number in Label: Indicates the cumulative count of breaks for that specific trend sequence (e.g., "1" is the first break, "2" is the second).
The breakout count represents the intensity of the move. A reading greater than 1 signals exceptional market strength, indicating the penetration of multiple Key Levels (Support or Resistance) within a single candle.
📖 How to Use
Trend Continuation: In an uptrend (sequence of HH/HL), wait for a Blue Triangle Up (▲) occurring at a Red Resistance line. This signals the continuation of the trend.
Trend Reversal: Watch for a "Structure Break." If price is making Higher Highs, but then breaks a Green Support line (generating a ▼ signal) and forms a Lower Low (LL), the trend may be reversing.
HTF "Bounce" Plays: Use the thick Fuchsia/Aqua lines as major zones. If price approaches a thick Aqua line (HTF Support) and fails to break it, look for LTF bullish structure (HH/HL) to form for an entry.
Volume Filtering: Enable the "Volume Confirmation" setting to filter out "fakeouts" (breaks on low volume).
⚙️ Inputs and Settings
● Swing Settings
Left/Right Bars: Determines the sensitivity of the pivot detection. Higher numbers = fewer, more significant pivots.
Max Stored Levels: How many S/R lines to keep in memory at once.
Max Break Labels: Limits visual clutter by capping the number of signal labels.
● Usability & HTF
Enable Time Decay: If true, deletes lines that are older than "Decay Period" bars.
Enable HTF Levels: Toggles the display of higher timeframe pivots.
HTF Timeframe: Select the specific timeframe for the macro view (e.g., "D" for Daily).
● Analysis
Volume Confirmation: Toggles the requirement for volume to be above its average for a signal to fire.
Show Market Structure: Toggles the HH/LL text labels.
🔍 Deconstruction of the Underlying Scientific and Academic Framework
The script's logic is rooted in Fractal Geometry and Auction Market Theory .
● Mandelbrot's Fractals: The use of `leftBars` and `rightBars` is a direct application of identifying market fractals. Markets are self-similar across timeframes; a pivot on a 5-minute chart is structurally identical to one on a Weekly chart. This script exploits this property by allowing nested timeframe analysis (LTF inside HTF).
● Memory of Price (Behavioral Finance): Support and resistance lines represent zones where market participants have previously established value (Price Memory). The "Breakout" signal is mathematically significant because it represents a shift in the supply/demand equilibrium. When price closes beyond a stored array value (the pivot price), it signifies that the aggressive limit orders that created the pivot have been exhausted or withdrawn, validating a new search for value.
⚠️ Disclaimer
All provided scripts and indicators are strictly for educational exploration and must not be interpreted as financial advice or a recommendation to execute trades. I expressly disclaim all liability for any financial losses or damages that may result, directly or indirectly, from the reliance on or application of these tools. Market participation carries inherent risk where past performance never guarantees future returns, leaving all investment decisions and due diligence solely at your own discretion.

Hybrid Smart Money Concepts [MarkitTick]💡This indicator provides a comprehensive technical analysis system that combines Market Structure concepts (Smart Money Concepts) with advanced Gap Analysis and a statistical Stress Model. It is designed to help traders identify trend direction, structural pivot points, potential reversal zones (Order Blocks), significant price gaps, and moments of market exhaustion.
Unlike standard ZigZag or Fractal indicators, this script integrates volume, trend maturity, and statistical volatility (Z-Score) to contextually classify price action. By overlaying these elements with a robust Market Structure engine—which identifies Change of Character (CHoCH) and Order Blocks—the tool provides a confluent view of price action.
It automates the detection of institutional footprints, allowing traders to see the structural trend, momentum drivers, and potential exhaustion points simultaneously.
● METHODOLOGY
The script operates on three distinct but complementary logic engines:
• Gap Analysis Engine
This module detects gaps between the previous high/low and the current open. It classifies them into three specific types based on volume and structural context:
Breakaway Gaps: Identified when a gap creates a breakout above a recent Pivot High or below a Pivot Low. This signals the start of a potential new trend.
Exhaustion Gaps: Identified when a gap occurs with high relative volume and meets the Trend Maturity criteria. This often signals the end of a trend.
Runaway Gaps: Standard continuation gaps that occur within a trend.
• Market Structure Engine
Swings and CHoCH: The script uses a left-and-right bar lookback to identify Pivot Highs and Lows. A Change of Character (CHoCH) is plotted when price closes beyond the most recent major pivot.
Order Blocks (OB): Upon a continuation of the trend, the script scans backward to find the extreme candle (the origin of the move) and highlights this zone as an Order Block.
Dynamic Cleanup: Gaps and Order Blocks are automatically removed (mitigated) when price aggressively crosses through their levels.
• Exhaustion & Stress Model
This statistical engine measures market "Stress" by analyzing the impact of price range relative to volume (True Range / Volume).
Calculation: It calculates a Z-Score (Standard Deviation) of this impact.
Logic: When the Z-Score exceeds a specific threshold (Sigma), it indicates a statistical anomaly or "Stress."
Signal: If high stress occurs while price is significantly above the trend baseline, it signals "Buyer Exhaustion." Conversely, high stress below the baseline signals "Seller Exhaustion."
● VISUALS & LEGEND
Before trading, you need to know what the indicator is drawing on your chart:
• Change of Character (CHoCH)
Green Dashed Line: Indicates a Bullish reversal.
Red Dashed Line: Indicates a Bearish reversal.
• Order Blocks (OB)
Green Boxes: Bullish support zones (Buy interest).
Red Boxes: Bearish resistance zones (Sell interest).
Note: Invalidated boxes are automatically deleted.
• Gaps
Blue Box (Breakaway): Strong momentum gap starting a new trend.
Orange Box (Runaway): Continuation gap.
Red Box (Exhaustion): Warning signal; trend may be ending.
• Stress Model Signals
Label "BE" (Red): Buyer Exhaustion. Suggests the bullish move is overextended relative to volume participation.
Label "SE" (Green): Seller Exhaustion. Suggests the bearish move is overextended.
● TRADING STRATEGY
You can use a "Pullback, Continuation & Exhaustion" strategy with this indicator.
• Scenario A: Long Setup (Buying)
Trend Change: Look for a CHoCH label with a Green Dashed Line.
Entry Zone: Look for a Green Order Block (OB) to form.
Confirmation: A Breakaway Gap (Blue) validates the breakout.
Entry: Enter Long when price pulls back into the Green OB.
Exit Warning: If a "BE" (Buyer Exhaustion) label appears, consider tightening stops or taking profit.
• Scenario B: Short Setup (Selling)
Trend Change: Look for a CHoCH label with a Red Dashed Line.
Entry Zone: Look for a Red Order Block (OB) to form.
Confirmation: A Breakaway Gap downwards validates the move.
Entry: Enter Short when price rallies back into the Red OB.
Exit Warning: If an "SE" (Seller Exhaustion) label appears, consider tightening stops or taking profit.
● SETTINGS
• Date Range Filter
Use Date Filter: Toggle time-based filtering.
Start Date: Timestamp to begin calculations.
• Gap Analysis
Min Gap Size: Minimum points required to register a gap.
Logic Inputs: Configures lookback periods and volume multipliers for gap classification.
Visuals: Customize colors for Breakaway, Runaway, and Exhaustion gaps.
• Market Structure
Swing Detection Length: Lookback period for pivot points.
Show CHoCH: Toggle for Change of Character labels.
Show Order Blocks: Toggle for OB boxes.
• Exhaustion & Stress Model
Trend Filter Length: Baseline length for determining trend direction (EMA).
Statistical Lookback: Length for the Z-Score calculation.
Stress Threshold (Sigma): The standard deviation requirement to trigger an exhaustion signal (Default: 2.0).
● DISCLAIMER
All provided scripts and indicators are strictly for educational exploration and must not be interpreted as financial advice or a recommendation to execute trades. I expressly disclaim all liability for any financial losses or damages that may result, directly or indirectly, from the reliance on or application of these tools. Market participation carries inherent risk where past performance never guarantees future returns, leaving all investment decisions and due diligence solely at your own discretion.

Internal/External Market Structure [UAlgo]The "Internal/External Market Structure " indicator is a tool designed to identify and visualize internal and external market structure based on swing highs and lows. It helps traders understand short-term (internal) and long-term (external) price behavior.
🔶 What are ChoCH and BoS?
Change of Character (ChoCH)
Change of character refers to the reversal of market trend either from bullish to bearish or bearish to bullish. ChoCH is also a break of market structure but in opposite direction.
If market is in bullish trend but it breaks it previous (higher) low and makes a lower low, it will be termed a “bearish change of character” as price changed its trend from bullish to bearish.
Like wise if price is in bearish trend and it breaks its previous (lower) high making a higher high it will be marked as “bullish change of character” as price changed its trend from bearish to bullish.
Break of Structure (BoS)
When price breaks its structure in direction of previous trend its called break of structure (BoS). So its a trend continuation pattern.
As you know in bullish trend price makes higher highs. Each time when price break a previous high and marks a new high its known as bullish break of structure.
But in bearish trend price makes lower lows so every time when price breaks previous low and makes a new low it is called as bearish break of structure.
🔶 Key Features
Internal Swing Length: Allowing for fine-tuning of sensitivity to smaller, more frequent market movements.
External Swing Length: Focusing on capturing broader market trends.
The indicator differentiates between internal and external market structures, using different styles and colors to represent each. Internal structures are shown with solid lines, while external structures use dashed lines, providing clear visual cues.
Internal Market Structure:
The internal market structure focuses on shorter-term swings and is useful for identifying minor trend changes and short-term price movements. Breaks of internal swing highs or lows can indicate potential changes in the market's direction or momentum. The labels "CHoCH" and "BoS" help distinguish between changes in character and break of structure events, respectively.
External Market Structure:
The external market structure captures larger, more significant market moves. It is particularly useful for identifying major trend changes and key support and resistance levels. The dashed lines and corresponding labels "CHoCH+" and "BoS+" indicate more substantial shifts in market sentiment.
For BoS (Break of Structure):
For ChoCH (Change of Character):
🔶 Disclaimer
Use with Caution: This indicator is provided for educational and informational purposes only and should not be considered as financial advice. Users should exercise caution and perform their own analysis before making trading decisions based on the indicator's signals.
Not Financial Advice: The information provided by this indicator does not constitute financial advice, and the creator (UAlgo) shall not be held responsible for any trading losses incurred as a result of using this indicator.
Backtesting Recommended: Traders are encouraged to backtest the indicator thoroughly on historical data before using it in live trading to assess its performance and suitability for their trading strategies.
Risk Management: Trading involves inherent risks, and users should implement proper risk management strategies, including but not limited to stop-loss orders and position sizing, to mitigate potential losses.
No Guarantees: The accuracy and reliability of the indicator's signals cannot be guaranteed, as they are based on historical price data and past performance may not be indicative of future results.

ICT Market Structure Screener (Zeiierman)█ Overview
The ICT Market Structure Screener (Zeiierman) is designed to identify and display key market structure levels and patterns based on Smart Money Concepts. It highlights bullish and bearish structures, premium and discount levels, and generates alerts for significant market structure changes, making it a valuable tool for traders looking to understand institutional trading behaviors and market trends. A key feature of this indicator is its screener function, which allows traders to monitor multiple symbols simultaneously. This feature provides a consolidated view of the market structure for various assets, making it easier to identify trading opportunities across a diverse portfolio.
█ How It Works
The ICT Market Structure Screener operates by identifying high and low pivot points within a specified period, then analyzing these pivots to determine changes in market structure. The indicator tracks price movements and categorizes them into bullish or bearish structures, indicating potential trend reversals or continuations. By plotting premium and discount levels, it helps traders identify overbought and oversold conditions. The indicator also provides real-time updates and alerts for significant changes in the market structure.
█ Terminology
ChoCH (Change of Character): Indicates a potential reversal in market direction. It is identified when the price breaks a significant high or low, suggesting a shift from a bullish to bearish trend or vice versa.
SMS (Smart Money Shift): Represents the transition phase in market structure where smart money begins accumulating or distributing assets. It typically follows a BMS and indicates the start of a new trend.
BMS (Bullish/Bearish Market Structure): Confirms the trend direction. Bullish Market Structure (BMS) confirms an uptrend, while Bearish Market Structure (BMS) confirms a downtrend. It is characterized by a series of higher highs and higher lows (bullish) or lower highs and lower lows (bearish).
Premium: A zone where the price is considered overbought. It is calculated as the upper range of the current market structure and indicates a potential area for selling or shorting.
Mid Range: The midpoint between the high and low of the market structure. It often acts as a support or resistance level, helping traders identify potential reversal or continuation points.
Discount: A zone where the price is considered oversold. It is calculated as the lower range of the current market structure and indicates a potential area for buying or going long.
█ How to Use
The ICT Market Structure Screener allows traders to follow smart money moves in the market more effectively. By identifying key market levels and monitoring bullish and bearish structures, traders can easily spot trend changes and strong trends. The indicator's premium and discount levels help identify overbought and oversold conditions, providing valuable entry and exit points. Alerts for ChoCH, SMS, and BMS keep traders informed about significant market changes, enabling real-time adjustments to trading strategies.
The screener functionality is particularly valuable for monitoring multiple markets simultaneously. The screener table displays critical information such as current price, trend direction, signal type, and premium/discount levels for each symbol. This makes it easier to track the market structure of various assets at a glance and quickly identify trading opportunities across different markets.
Example Strategies:
⚪ Trend Following: Use the indicator to identify the current market trend (bullish or bearish) and trade in the direction of the trend. Enter trades on pullbacks to premium (for shorts) or discount (for longs) levels.
⚪ Reversal Trading: Look for ChoCH signals to identify potential trend reversals. Enter trades when the price breaks a significant high or low and confirms a change in market structure, or wait for a retest of the nearest Orderblock that was formed.
⚪ Support and Resistance: Utilize the mid-range, premium, and discount levels as support and resistance zones. Enter trades when the price approaches these levels and shows signs of reversal or continuation.
⚪ Multi-Symbol Analysis: Use the screener table to monitor multiple symbols and quickly assess their market structure. This helps in diversifying trading opportunities and managing a portfolio of assets efficiently.
█ Settings
Period: The pivot period for calculating the structure. Increasing the period captures broader trends, making the structure more representative of long-term movements. Decreasing the period focuses on shorter-term trends, increasing sensitivity.
Response: Enabling this option uses the response period instead of the pivot period, providing more flexibility in capturing short-term or long-term structures. The period for the response, which determines the structure's sensitivity. Increasing the response period smoothens the structure, making it less reactive to short-term fluctuations. Decreasing the response period makes the structure more responsive to short-term changes.
Structure Display: Choose between displaying the active range or the previous range. 'Active Range' shows real-time premium, discount, and mid-range levels based on the current structure. 'Previous Range' displays past ranges, useful for analyzing historical support/resistance levels.
Ticker Symbols: List of symbols to include in the screener. Enabling the option includes the symbol in the screener, allowing the user to track its structure. Disabling it excludes the symbol from the screener, reducing the number of tracked symbols.
-----------------
Disclaimer
The information contained in my Scripts/Indicators/Ideas/Algos/Systems does not constitute financial advice or a solicitation to buy or sell any securities of any type. I will not accept liability for any loss or damage, including without limitation any loss of profit, which may arise directly or indirectly from the use of or reliance on such information.
All investments involve risk, and the past performance of a security, industry, sector, market, financial product, trading strategy, backtest, or individual's trading does not guarantee future results or returns. Investors are fully responsible for any investment decisions they make. Such decisions should be based solely on an evaluation of their financial circumstances, investment objectives, risk tolerance, and liquidity needs.
My Scripts/Indicators/Ideas/Algos/Systems are only for educational purposes!

ICT Institutional Order Flow (fadi)ICT Institutional Order Flow indicator is intended to provide wholistic view to better analyze order flow and where price may go to next. The concept follows ICT principles.
ICT Market Structure
ICT breaks down Pivot points into three categories:
Short Term High/Low (STH/STL) is a 3 candle pattern with a low with higher low on each side (STL), or a high with lower high on each side (STH)
Intermediate Term High/Low (ITH/ITL) uses the calculated STH/STL and marks any STH that has lower or STH on each side, and STL that has higher STL on each side
Long Term High/Low (LTH/LTL) uses the calculated ITH/ITL and marks any ITH that has lower or ITH on each side, and ITL that has higher ITL on each side
Note: ICT also states that if a STH wicks into and closes (almost?) a FVG, he marks it as ITH even if it does not have STH on reach side. This scenario is not covered by this indicator
Liquidity
liquidity is usually present under pivot points. The more prominent the pivot point, the more likely higher values liquidity pools reside under/above it. Liquidity under ITL and LTL as an example, will have better indication of which liquidity the price may seek next.
Displacement
Displacement registers above average move in the price resulting in strong visible move. If requiring a FVG is enabled (in settings), then the displacement could possibly (but never guaranteed) be used to visually recognize a move as it develops.
Full Credit: The calculation for Displacement is derived from TFO's Visualizing Displacement
Imbalances
Imbalances can come in different forms. This indicator identifies three type of imbalances:
1. FVG
2. Volume Imbalance
3. Open Gaps
Imbalances completes the picture by help visualize strong moves, where possible pivot points may develop, and how to enter or manage a trade.

Faytterro Market Structerethis indicator creates the market structure with a little delay but perfectly. each zigzag is always drawn from highest to lowest. It also signals when the market structure is broken. signals fade over time.
The table above shows the percentage distance of the price from the last high and the last low.
zigzags are painted green when making higher peaks, while lower peaks are considered downtrends and are painted red. In fact, the indicator is quite simple to understand and use.
"length" is used to change the frequency of the signal.
"go to past" is used to see historical data.
Please review the examples:

FibonacciRetracementHi all!
This library will help you draw Fibonacci retracement levels (zones). The code is from my indicator "Fibonacci retracement" (). You can see that description for more information about the behaviour and example of how to use this library. The code is almost the same with the addition of alerts. If the alert frequency is 'alert.freq_once_per_bar_close' alert messages will be concatenated and have a header saying how many messages it contains (if it's more than 1).
Hope this is of help!
Library "FibonacciRetracement"
ConcateAlerts(context)
Concatenates all alerts from the bar to one string (separated by new lines) and clears alert messages on the current bar.
Parameters:
context (Context)
AddAlert(context, message, unshiftInsteadOfPush)
Parameters:
context (Context)
message (string)
unshiftInsteadOfPush (bool)
Range(context, structure, settings)
Will return values if new levels/zones should be drawn.
Parameters:
context (Context) : The 'Context' for the Fibonacci retracement.
structure (Structure type from mickes/PriceAction/1) : The current 'Structure' from the 'MarketStructure' library.
settings (Settings) : The 'Settings' object for the 'Context'.
Returns: A tuple with the start and end pivot if new zones should be drawn, ' ' otherwise.
DrawAll(context, settings, start, end)
Draws lines and labels for the zone. It will also set the 'Price' value that will be used for absolute positions.
Parameters:
context (Context) : The 'Context' for the Fibonacci retracement.
settings (Settings) : The 'Settings' object for the 'Context'.
start (Pivot type from mickes/PriceAction/1)
end (Pivot type from mickes/PriceAction/1)
AlertActive(context, settings)
Will alert for all zones that are active. If multiple alert messages are added they will be concatenated (separated by a new line) with a header saying how many messages the alert contains.
Parameters:
context (Context) : The 'Context' for the Fibonacci retracement. This contains the zones that will be alerted if price (wick or close according to the settings) enters it.
settings (Settings) : The 'Settings' object for the 'Context'.
TrendlineSettings
Holds all the values for 'TrendlineSettings'.
Fields:
Enabled (series bool) : If the trendline should be visible or not.
Color (series color) : The color of the trendline.
Style (series string) : The style of the trendline (as a string).
GenericZonesSettings
Holds all the values for 'GenericZonesSettings', that will be applicable to all drawn objects.
Fields:
ExtendRight (series bool) : If all lines should extend to the right or not.
Style (series string) : The style of all drawn lines
Reverse (series bool) : If true, all lines will be reversed.
Prices (series bool) : If price levels should be shown or not.
Levels (series bool) : If levels should be shown or not.
LevelsValue (series string) : Either 'Value' or 'Percent'. Defined if value or percentage should be shown.
FontSize (series int) : The for size of the text in labels drawn.
LabelsPosition (series string) : Coul be 'Left', 'Rigth' or 'Adapt'. 'Adapt' will try to adapt the labels position to the prices.
ZoneSettings
Holds all the values for 'ZoneSettings'.
Fields:
Enabled (series bool) : If this zone is enabled or not.
Level (series float) : The level of the zone.
Color (series color) : The color that will be displayed.
Price (series float) : The price of the level. Will be set internally.
Settings
Holds all the values for 'Settings'.
Fields:
PivotLeftLength (series int) : The left length used to find pivots through the 'MarketStructure' library.
PivotRightLength (series int) : The right length used to find pivots through the 'MarketStructure' library.
Trendline (TrendlineSettings) : The settings for the 'Trendline' object.
GenericZonesSettings (GenericZonesSettings) : The setting applicable to all zones.
AlertFrequency (series string) : The frequency for the alerts. If 'alert.freq_once_per_bar_close', alert messages will be concatenated and have a header saying how many messages it contains (if it's more than 1).
AlertPrice (series string) : The price that has to enter a zone. Can be 'Close' (the closing price) or 'Wick' (the whole candle needs to be in the zone).
Zone1 (ZoneSettings) : The 'ZoneSettings' that represents this zone.
Zone2 (ZoneSettings) : The 'ZoneSettings' that represents this zone.
Zone3 (ZoneSettings) : The 'ZoneSettings' that represents this zone.
Zone4 (ZoneSettings) : The 'ZoneSettings' that represents this zone.
Zone5 (ZoneSettings) : The 'ZoneSettings' that represents this zone.
Zone6 (ZoneSettings) : The 'ZoneSettings' that represents this zone.
Zone7 (ZoneSettings) : The 'ZoneSettings' that represents this zone.
Zone8 (ZoneSettings) : The 'ZoneSettings' that represents this zone.
Zone9 (ZoneSettings) : The 'ZoneSettings' that represents this zone.
Zone10 (ZoneSettings) : The 'ZoneSettings' that represents this zone.
Zone11 (ZoneSettings) : The 'ZoneSettings' that represents this zone.
Zone12 (ZoneSettings) : The 'ZoneSettings' that represents this zone.
Zone13 (ZoneSettings) : The 'ZoneSettings' that represents this zone.
Zone14 (ZoneSettings) : The 'ZoneSettings' that represents this zone.
Zone15 (ZoneSettings) : The 'ZoneSettings' that represents this zone.
Zone16 (ZoneSettings) : The 'ZoneSettings' that represents this zone.
Zone17 (ZoneSettings) : The 'ZoneSettings' that represents this zone.
Zone18 (ZoneSettings) : The 'ZoneSettings' that represents this zone.
Zone19 (ZoneSettings) : The 'ZoneSettings' that represents this zone.
Zone20 (ZoneSettings) : The 'ZoneSettings' that represents this zone.
Zone21 (ZoneSettings) : The 'ZoneSettings' that represents this zone.
Zone22 (ZoneSettings) : The 'ZoneSettings' that represents this zone.
Zone23 (ZoneSettings) : The 'ZoneSettings' that represents this zone.
Zone24 (ZoneSettings) : The 'ZoneSettings' that represents this zone.
Context
Holds all the values for 'Context'.
Fields:
Lines (array) : All the drawn lines for the current 'Context'.
Labels (array) : All the drawn labels for the current 'Context'.
Boxes (array) : All the drawn boxes for the current 'Context'.
Alerts (array) : All the alert messages on the current tick.
Start (series int) : The start bar index of the current 'Context'.

Trend Break Targets [MarkitTick]Trend Break Targets
Trend Break Targets is a technical analysis tool designed to assist traders in identifying trendline breakouts and projecting potential price targets based on market geometry. Unlike fully automated indicators that guess trendlines, this tool provides you with precise control by allowing you to manually Pivot Point the trendline to specific points in time, while automating the complex math of target projection and structure mapping.
Theoretical Basis & Concepts
This indicator is grounded in classic technical analysis principles found in foundational trading literature. It automates the following methodology:
Drawing a trend line between two key points to represent dynamic support or resistance.
Identifying a breakout when the price closes above or below this line, potentially signaling a change in trend.
Calculating a price target by measuring the vertical distance between the breakout line and the last high/low (pivot), then projecting that same distance in the direction of the breakout.
This concept is based on methods and "Measured Move" theories explained in classic books such as "Technical Analysis of Stock Trends" by Edwards & Magee, "Technical Analysis of the Financial Markets" by John Murphy, and in Thomas Bulkowski's Price Pattern Studies.
How It Works
Pivot Pointed Trendline Construction The script draws a trendline between two user-defined points in time (Start Date and End Date). It calculates the slope between these points and extends the line infinitely to the right, allowing you to define the exact structure (e.g., a resistance trendline on a wedge).
Breakout Detection The script monitors the "Price Source" (High, Low, or Close) relative to the extended trendline.
A Bullish Breakout (BC) occurs when the Close crosses above a bearish trendline.
A Bearish Breakout (BC) occurs when the Close crosses below a bullish trendline.
Dynamic Target Projection (The Math) Upon a confirmed breakout, the script automatically calculates three distinct targets by identifying the most significant "Swing Point" (Pivot) prior to the breakout.
Distance (D): The vertical distance between the Trendline and the Pivot Price at the specific bar where the pivot occurred.
Target 1 (T1): The Breakout Price +/- (Distance × 1.0). This represents a classic 1:1 measured move.
Target 2 (T2): The Breakout Price +/- (Distance × 1.618). Based on the Golden Ratio extension.
Target 3 (T3): The Breakout Price +/- (Distance × 2.618).
Market Structure (CHOCH) The script includes an optional Change of Character (CHOCH) module. This runs independently of the trendline logic, identifying local Swing Highs and Swing Lows based on the "Swing Detection Length." It plots dashed lines and labels to visualize immediate shifts in market structure.
How to Use This Tool
This is an interactive tool that requires user input to define the setup.
Identify a Setup: Locate a clear trend, wedge, or flag pattern on your chart.
Set Pivot Points: Go to the Indicator Settings. Input the exact Start Date and End Date corresponding to the two main touches of your trendline.
Monitor for Breakout: The script will extend the line. Wait for a "BC" label to appear.
Trade Management: Once "BC" prints, the T1, T2, and T3 lines will instantly render. These can be used as potential take-profit zones or areas to tighten stop-losses.
Settings & Configuration
Indicator Settings
Start/End Date: The timestamp Pivot Points for your trendline.
Price Source: Determines what price (High or Low) Pivot Points the line and triggers the breakout.
Pivot Left/Right: Adjusts the sensitivity for finding the "Pivot Before Break" used for target calculations.
Extend Target Line: How far forward the target lines are drawn.
Visual Style
Colors: Fully customizable colors for the Trendline, Breakout Labels, and each Target level (T1, T2, T3).
Gold Bullish Reversal
This analysis dissects a confirmed bullish reversal on Gold using a custom Trend Break system. The setup identifies a transition from a bearish corrective phase to bullish momentum, validated by a structural break and a geometric target projection.
Trend Identification (The Pivot Points) The descending white trendline serves as the primary dynamic resistance, defining the bearish correction.
Pivot Points: The line is drawn connecting two significant swing highs, marked by Label 1 and Label 2.
Logic: These points represent the "lower highs" characteristic of the previous downtrend. As long as price remained below this trajectory, the bearish bias was intact.
The Trigger: Breakout & Confirmation The transition occurs at the candle marked BC (Breakout Candle).
Breakout Criteria: The indicator logic dictates that a signal is only valid when the bar closes above the trendline. This filters out intraday wicks and ensures genuine buyer commitment.
CHOCH Confluence: Immediately following the breakout, a CHOCH (Change of Character) label appears. This signals a shift in market structure, indicating that the internal lower-high/lower-low sequence has been violated, adding probability to the reversal.
Target Projection: The Measured Move The vertical green lines (T1, T2) represent profit objectives derived from the depth of the prior move. The logic calculates the distance between the breakout line and the lowest pivot prior to the break.
T1 (Standard Target): This is a 1:1 projection of the pre-breakout volatility. We see price action initially stalling near this level, confirming it as a zone of interest.
T2 (Golden Ratio Extension): The second target is calculated as the initial distance multiplied by 1.618 (Fibonacci Golden Ratio). The chart shows the price rallying aggressively through T1 to tap the T2 zone, often considered an exhaustion or major take-profit level in harmonic extensions.
Conclusion Gold has successfully invalidated the 4-hour bearish trendline. The confluence of a confirmed close above resistance (BC) and a structural shift (CHOCH) provided a high-probability long setup. The price has now fulfilled the T2 (1.618) extension, suggesting traders should watch for consolidation or a reaction at this key Fibonacci resistance level.
Bearish Trendline Breakdown
The image displays a Bearish Trendline Breakdown on the Gold (XAUUSD) 4-hour chart. The indicator is actually functioning in "Low" mode here (connecting swing lows to form support), which triggers the bearish logic found in the code. Here is the step-by-step breakdown:
The Setup: Pivot Points & Trendline
Visual: The Blue Labels "1" and "2" connected by a white diagonal line.
Code Logic: These are the user-defined start and end points.
Pivot Point 1 (startDate): The starting pivot of the trendline.
Pivot Point 2 (endDate): The ending pivot.
Trendline: The code draws a line between these two points and extends it to the right (extend.right). In this specific image, the line acts as a Support Trendline.
The Trigger: Break Candle (BC)
Visual: The Red Label "BC" appearing just below the white trendline.
Code Logic: This is the execution signal. The code detects a "Down Break" (dnBreak) because the Price Source was likely set to "Low" and the candle's Close was lower than the Trendline Price at that specific bar (close < currLinePrice). This confirms the support level has been breached.
The Projection: Targets (T1 & T2)
Visual: The Green Labels "T1" and "T2" with dotted horizontal lines projected downward.
Code Logic: These are profit targets based on a "Measured Move."
Pivot Calculation: The script looks back for a recent "Pivot High" (the peak before the crash) to calculate the volatility/distance (dist) between that peak and the trendline.
T1 (Conservative): The price is projected downward by 1x that distance (currLinePrice - dist).
T2 (Extended): The price is projected downward by 1.618x that distance (Golden Ratio extension).
Market Context: CHOCH
Visual: The small Red/Orange "CHOCH" labels appearing above the price action.
Code Logic: This is a secondary confirmation system running independently of the trendline. It detects a Change of Character (structural shift). The red labels indicate a "Bearish CHOCH," meaning the price broke below a significant prior swing low (last_swing_low). This supports the bearish bias of the trendline break.
Disclaimer This tool is for educational and technical analysis purposes only. Breakouts can fail (fake-outs), and past geometric patterns do not guarantee future price action. Always manage risk and use this tool in conjunction with other forms of analysis.

Contrarian Market Structure BreakMarket Structure Break application was inspired and adapted from Market Structure Oscillator indicator developed by Lux Algo. So much credit to their work.
This indicator pairs nicely with the Contrarian 100 MA and can be located here:
Indicator Description: Contrarian Market Structure BreakOverview
The "Contrarian Market Structure Break" indicator is a versatile tool tailored for traders seeking to identify potential reversal opportunities by analyzing market structure across multiple timeframes. Built on Institutional Concepts of Structure (ICT), this indicator detects Break of Structure (BOS) and Change of Character (CHoCH) patterns across short-term, intermediate-term, and long-term swings, plotting them with customizable lines and labels. It generates contrarian buy and sell signals when price breaks key swing levels, with a unique "Blue Dot Tracker" to monitor consecutive buy signals for trend confirmation. Optimized for the daily timeframe, this indicator is adaptable to other timeframes with proper testing, making it ideal for traders of forex, stocks, or cryptocurrencies.
How It Works
The indicator combines three key components to provide a comprehensive view of market dynamics: Multi-Timeframe Market Structure Analysis: It identifies swing highs and lows across short-term, intermediate-term, and long-term periods, plotting BOS (continuation) and CHoCH (reversal) events with customizable line styles and labels.
Contrarian Signal Generation: Buy and sell signals are triggered when the price crosses below swing lows (buy) or above swing highs (sell), indicating potential reversals in overextended markets.
Blue Dot Tracker: A unique feature that counts consecutive buy signals ("blue dots") and highlights a "Hold Investment" state with a yellow background when three or more buy signals occur, suggesting a potential trend continuation.
Signals are visualized as small circles below (buy) or above (sell) price bars, and a table in the bottom-right corner displays the blue dot count and recommended action (Hold or Flip Investment), enhancing decision-making clarity.
Mathematical Concepts Swing Detection: The indicator identifies swing highs and lows by comparing price patterns over three bars, ensuring robust detection of pivot points. A swing high occurs when the middle bar’s high is higher than the surrounding bars, and a swing low occurs when the middle bar’s low is lower.
Market Structure Logic: BOS is detected when the price breaks a prior swing high (bullish) or low (bearish) in the direction of the current trend, while CHoCH signals a potential reversal when the price breaks a swing level against the trend. These are calculated across three timeframes for a multi-dimensional perspective.
Blue Dot Tracker: This feature counts consecutive buy signals and tracks the entry price. If three or more buy signals occur without a sell signal, the indicator enters a "Hold Investment" state, marked by a yellow background, until the price exceeds the entry price or a sell signal occurs.
Entry and Exit Rules Buy Signal (Blue Dot Below Bar): Triggered when the closing price crosses below a swing low on either the intermediate-term or long-term timeframe, suggesting an oversold condition and potential reversal upward. Short-term signals can be enabled but are disabled by default to reduce noise.
Sell Signal (White Dot Above Bar): Triggered when the closing price crosses above a swing high on either the intermediate-term or long-term timeframe, indicating an overbought condition and potential reversal downward.
Blue Dot Tracker Logic: After a buy signal, the indicator increments a blue dot counter and records the entry price. If three or more consecutive buy signals occur (blueDotCount ≥ 3), the indicator enters a "Hold Investment" state, highlighted with a yellow background, suggesting a potential trend continuation. The "Hold Investment" state ends when the price exceeds the entry price or a sell signal occurs, resetting the counter.
Exit Rules: Traders can exit buy positions when a sell signal appears, the price exceeds the entry price during a "Hold Investment" state, or based on additional confirmation from BOS/CHoCH patterns or other technical analysis tools. Always use proper risk management.
Recommended Usage
The indicator is optimized for the daily timeframe, where it effectively captures significant reversal and continuation patterns in trending or ranging markets. It can be adapted to other timeframes (e.g., 1H, 4H, 15M) with careful testing of settings, particularly enabling/disabling short-term structure analysis to suit market conditions. Backtesting is recommended to optimize performance for your chosen asset and timeframe.
Customization Options Market Structure Display: Toggle short-term, intermediate-term, and long-term structures on or off, with customizable line styles (solid, dashed, dotted) and colors for bullish and bearish breaks.
Labels: Enable or disable BOS/CHoCH labels for each timeframe to reduce chart clutter.
Signal Visibility: Hide buy/sell signals if desired for a cleaner chart.
Blue Dot Tracker: Monitor the blue dot count and action (Hold or Flip Investment) via the table display, which is fully customizable in terms of position and appearance.
Why Use This Indicator?
The "Contrarian Market Structure Break" indicator offers a robust framework for identifying high-probability reversal and continuation setups using ICT principles. Its multi-timeframe analysis, clear signal visualization, and innovative Blue Dot Tracker provide traders with actionable insights into market dynamics. Whether you're a swing trader or a day trader, this indicator’s flexibility and intuitive design make it a valuable addition to your trading arsenal.
Note for TradingView Moderators
This script complies with TradingView's House Rules by providing an educational and transparent description without performance claims or guarantees. It is designed to assist traders in technical analysis and should be used alongside proper risk management and personal research. The code is original, well-documented, and includes customizable inputs and clear visual outputs to enhance the user experience.
Tips for Users:
Backtest thoroughly on your chosen asset and timeframe to validate signal reliability. Combine with other indicators or price action analysis for confirmation of entries and exits. Adjust timeframe settings and enable/disable short-term structures to match market volatility and your trading style.
Hope the "Contrarian Market Structure Break" indicator enhances your trading strategy and helps you navigate the markets with confidence! Happy trading!

VolWRSI### Description of the `VolWRSI` Script
The `VolWRSI` script is a TradingView Pine Script indicator designed to provide a volume-weighted Relative Strength Index (RSI) combined with abnormal activity detection in both volume and price. This multi-faceted approach aims to enhance trading decisions by identifying potential market conditions influenced by both price movements and trading volume.
#### Key Features
1. **Volume-Weighted RSI Calculation**:
- The core of the script calculates a volume-weighted RSI, which gives more significance to price movements associated with higher volume. This helps traders understand the strength of price movements more accurately.
2. **Abnormal Activity Detection**:
- The script includes calculations for abnormal volume and price changes using standard deviation (SD) multiples. This feature alerts traders to potential unusual activity, which could indicate upcoming volatility or market manipulation.
3. **Market Structure Filtering**:
- The script assesses market structure by identifying pivot highs and lows, allowing for better contextual analysis of price movements. This includes identifying bearish and bullish divergences, which can signal potential reversals.
4. **Color-Coded Signals**:
- The indicator visually represents market conditions using different bar colors for various scenarios, such as bearish divergence, likely price manipulation, and high-risk moves on low volume. This allows traders to quickly assess market conditions at a glance.
5. **Conditional Signal Line**:
- The signal line is displayed only when institutional activity conditions are met, remaining hidden otherwise. This adds an extra layer of filtering to prevent unnecessary signals, focusing only on significant market moves.
6. **Overbought and Oversold Levels**:
- The script defines overbought and oversold thresholds, enhancing the trader's ability to spot potential reversal points. Color gradients help visually distinguish between these critical levels.
7. **Alerts**:
- The script includes customizable alert conditions for various market signals, including abnormal volume spikes and RSI crossings over specific thresholds. This keeps traders informed in real-time, enhancing their ability to act promptly.
#### Benefits of Using the `VolWRSI` Script
- **Enhanced Decision-Making**: By integrating volume into the RSI calculation, the script helps traders make more informed decisions based on the strength of price movements rather than price alone.
- **Early Detection of Market Manipulation**: The abnormal activity detection can help traders identify potentially manipulative market behavior, allowing them to act or adjust their strategies accordingly.
- **Visual Clarity**: The use of color-coding and graphical elements (such as shapes and fills) provides clear visual cues about market conditions, which can be especially beneficial for traders who rely on quick visual assessments.
- **Risk Management**: The identification of high-risk low-volume moves helps traders manage their exposure better, potentially avoiding trades that may lead to unfavorable outcomes.
- **Reduced Noise with Institutional Activity Filtering**: The conditional signal line only plots when institutional activity conditions are detected, providing higher confidence in signals by excluding lower-conviction setups.
- **Customization**: With adjustable parameters for length, thresholds, and colors, traders can tailor the script to their specific trading styles and preferences.
Overall, the `VolWRSI` script combines technical analysis tools in a coherent framework, aiming to provide traders with deeper insights into market dynamics and higher-quality trade signals, potentially leading to more profitable trading decisions.

Trailing stopHi all!
This script helps to alert you when a trailing stop is hit. More specifically it alerts you when the low of the candle crosses below your trailing stop. A trailing stop follows a price positive movements. It raises your stop when price goes up, but keeps it at the same level if price goes down, so it "locks" in your profit. You define your long entry bar and choose one of the following methods for the stop:
ATR
The Average True Range (ATR) is popular to trail stops. The trailing stop is raised by the low minus the ATR (times a factor that can be set under the settings for ATR).
EMA
The Exponential Moving Average (EMA) can be used to trail your stop. When the low goes below the EMA an alert is sent about the stop. Its length can be set in the settings.
SMA
The Simple Moving Average (SMA) can be used to trail your stop. When the low goes below the SMA an alert is sent about the stop. Its length can be set in the settings.
Source
An external source can be useful as a stop signal. You can use this option that will stop you out when the signal returns anything else than "na". E.g. if you want a stop when KivancOzbilgic script "SuperTrend" () turns red, you set the source to "Supertrend: Down Trend". This option will not draw pretty things on the chart, but it will alert you!
Please note that this is for long entries only.
Best of trading luck!

Fibonacci retracementHi all!
This indicator will show you the most recent Fibonacci retracement in the current trend. So if the trend is bullish the Fibonacci retracement will be drawn from swing low to high and from swing high to low in a bearish trend.
The uniqueness in this script lies in the adaptation to trend. To only plot the Fibonacci retracements according to the current market trend.
The trend is determined through break of structures (BOS) and change of characters (CHoCH). A change of character can be of type change of character plus (with a failed swing) and will then be shown as CHoCH+. This is possible through my library 'MarketStructure' (). It only uses break of structures and change of characters to be able to determine the trend, if you want a more detailed picture of the market structure you can use my script 'Market structure' ().
History and what to look for
Fibonacci retracement levels are used by many traders and are levels that are not Fibonacci sequence numbers themselves but they deriver from them. Some examples are:
23,6% - Divide a number by one three places ahead (e.g. 13/55)
38,2% - Divide a number by the one two places ahead (e.g. 21/55)
50% - Not from the Fibonacci sequence, but it's a number that price has reacted from in the past. Markets tend to retrace half a move before continuing
61,8% - The "golden retracement level". It derives from the "golden ratio" and is a core component of the Fibonacci sequence. The further you go in the Fibonacci sequence the preceding number divided by the current number will get closer and closer to this "golden ratio". This level is considered the most important Fibonacci retracement level by many traders
78,6% - Square root of 61.8%. This is often considered a deep correction (but not a trend reversal) and are often used for late entries
These levels are considered "key" and most significant. You want to look for a retracement of the price (down in a bullish trend and up in a bearish trend) to give you good entries.
Settings
For the trend you can set the pivot/swing lengths (right and left) and use the checkbox if you want these pivots to have labels. This can be done in the 'Market strucure' section.
In the 'Fibonacci retracement' section there is settings for the actual Fibonacci retracement. You can enable the trendline, set the color and the style of it. You can select which levels that should be shown by the indicator. There are 11 levels enabled by default, they are; 0-4.236. All settings in this section tries to be as similar to the "Fib Retracement" tool in Tradingview. You can also select the style of these lines (solid, dashed or dotted) and if you want them to extend to the right or not.
After this you can select if the Fibonacci retracement should be reversed or not, if prices should be displayed, if levels should be displayed and if to show the decimal levels or percentages and lastly the font size of these labels.
All defaults are based on the "Fib Retracement" tool by Tradingview.
Visualization
This indicator aims to be as visually similar to the default ("Fib Retracement") tool here on Tradingview. It will plot the Fibonacci retracement (called Auto Fibonacci/Auto fib) according to the trend from the library 'MarketStrucure'. The big differences from the "Fib Retracement" tool by Tradingview is that it's automatic (that adapts to trend), the market structure is visualized through lines and labels (showing 'BOS' for break of structures and 'CHoCH'/'CHoCH+' for change of characters) and that the labels showing information about the levels are positioned to be highly visible (left if <50% otherwise right if in a bullish trend, vice versa in a bearish trend or if reversed).
Don't hesitate if you have any feedback or nice feature suggestions!
Best of trading luck!
