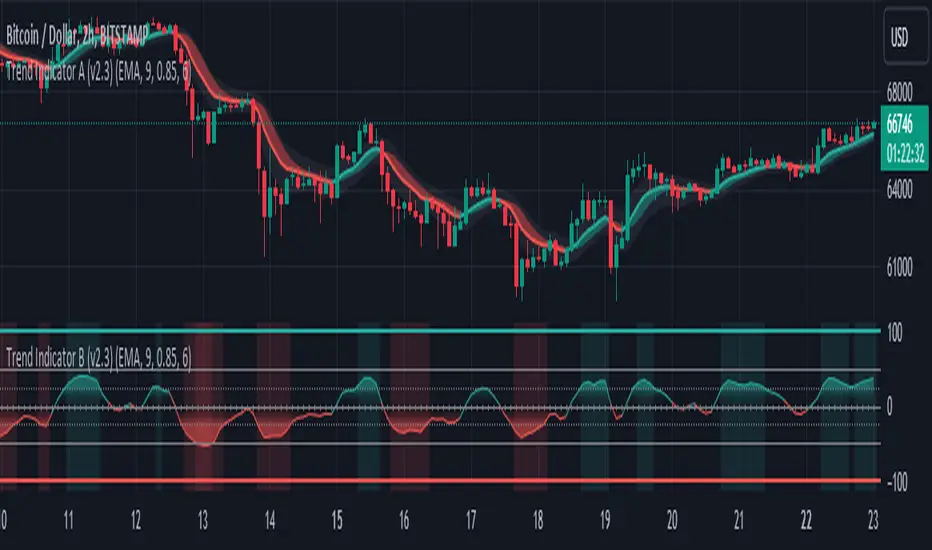
Trend Indicator B-V2 (Momentum measuring)"Trend Indicator A-V2" and "Trend Indicator B-V2" are updated and improved versions of my initial trend indicators. Totally rethinking the code, adding highs and lows in the calculations, including some more customisation through colour schemes.
In practice, this indicator uses EMAs and Heikin Ashi to provide an overall idea of the trend.
The "Trend Indicator A-V2" is an overlay showing “Smoothed Heikin Ashi” .
The "Trend Indicator B-V2" uses the same values in a different way to measure the momentum of the trend and identify potential trend rejections.
Please, take into account that it is a lagging indicator.
Search in scripts for "momentum"

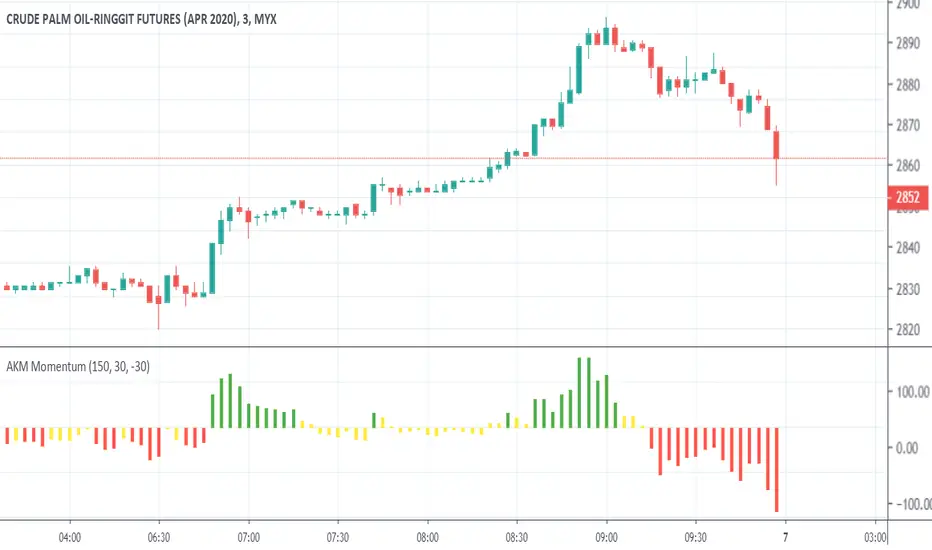
AKM MomentumAKM Momentum
Rekomendasi
FCPO
Timeframe Value LM Upper Value LM Bottom
3M 30 -30
15M 50 -50
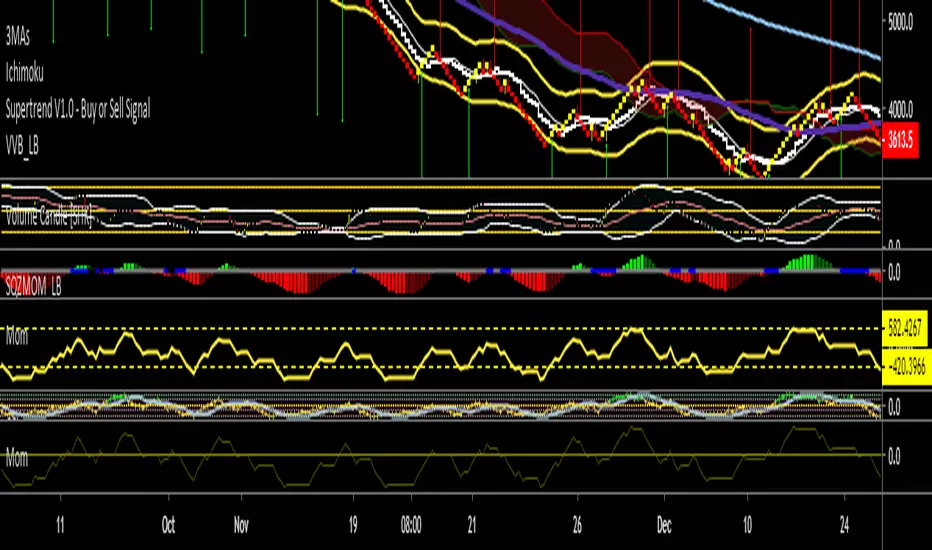
Wave Momentumthankyou to the original author of this script Vkn422
Very simple , shows momentum and changes candle colors to match
You only short when negative
you only long when positive
Must have confluence with other forms of analysis like Elliott Wave
This indicator was built with EW in mind and would excel in the hands of those who practice the wave analysis.


Log MomentumJust like regular momentum indicator except calculated in log space and with a horizontal line centered at zero for easier analysis


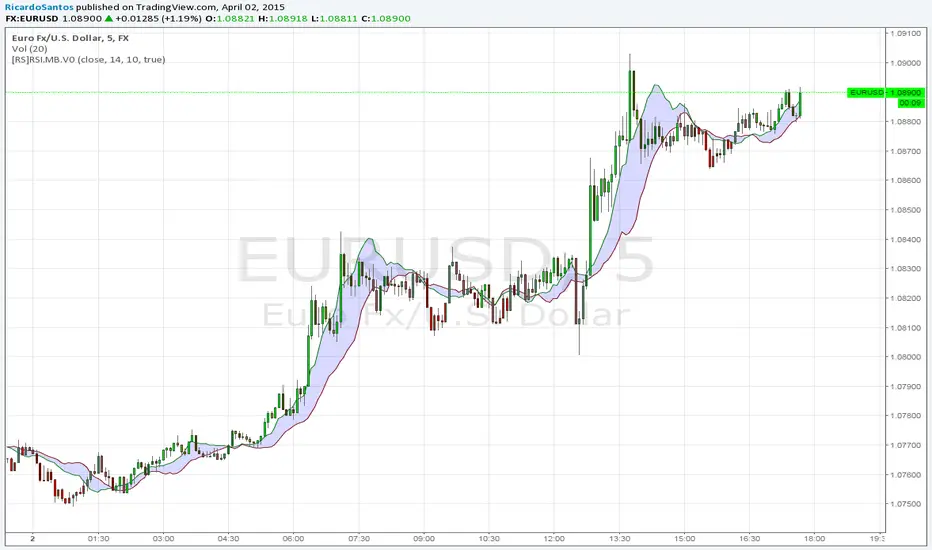
[RS]Leading Momentum Oscilator V0EXPERIMENTAL: Momentum oscilator based on offset, can also be used for divergence/convergence


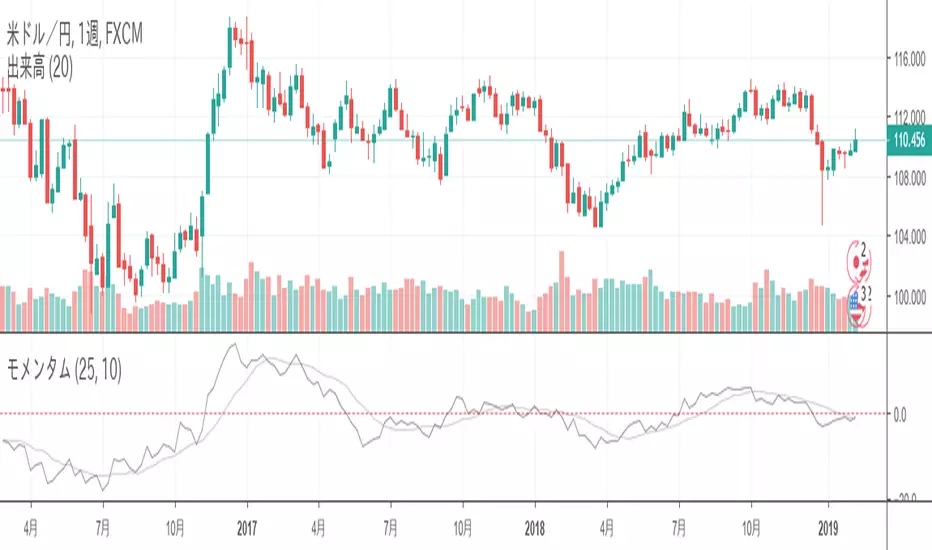
MomentumMomentum is differences between closing price and closing price on day before n day.
---
モメンタムは、n日前の終値と当日終値の差を数値化したものです。
モメンタムの移動平均線も同時に作成します。


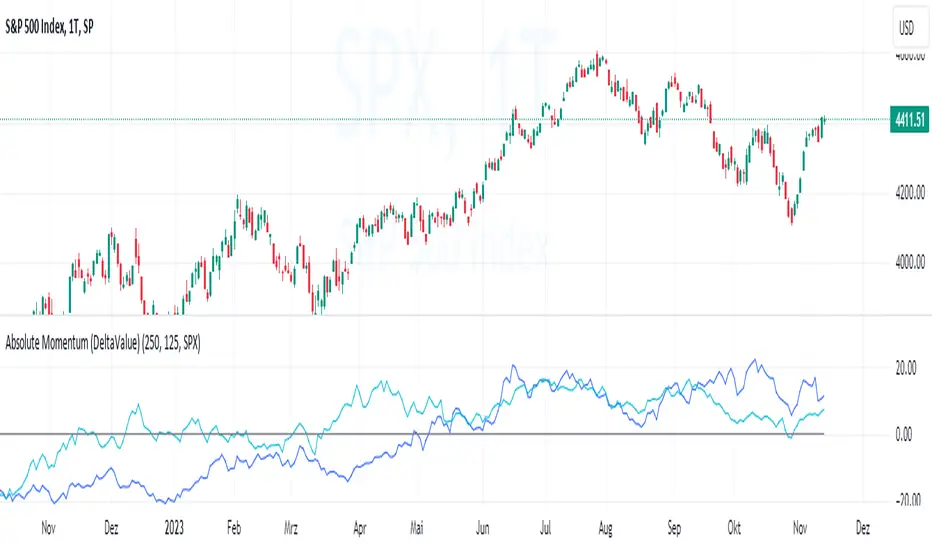
Absolute Momentum (Time Series Momentum)Absolute momentum , also known as time series momentum , focuses on the trend of an asset's own past performance to predict its future performance. It involves analyzing an asset's own historical performance, rather than comparing it to other assets.
The strategy determines whether an asset's price is exhibiting an upward (positive momentum) or downward (negative momentum) trend by assessing the asset's return over a given period (standard look-back period: 12 months or approximately 250 trading days). Some studies recommend calculating momentum by deducting the corresponding Treasury bill rate from the measured performance.
Absolute Momentum Indicator
The Absolute Momentum Indicator displays the rolling 12-month performance (measured over 250 trading days) and plots it against a horizontal line representing 0%. If the indicator crosses above this line, it signifies positive absolute momentum, and conversely, crossing below indicates negative momentum. An additional, optional look-back period input field can be accessed through the settings.
Hint: This indicator is a simplified version, as some academic approaches measure absolute momentum by subtracting risk-free rates from the 12-month performance. However, even with higher rates, the values will still remain close to the 0% line.
Benefits of Absolute Momentum
Absolute momentum, which should not be confused with relative momentum or the momentum indicator, serves as a timing instrument for both individual assets and entire markets.
Gary Antonacci , a key contributor to the absolute momentum strategy (find study below), emphasizes its effectiveness in multi-asset portfolios and its importance in long-only investing. This is particularly evident in a) reducing downside volatility and b) mitigating behavioral biases.
Moskowitz, Ooi, and Pedersen document significant 'time series momentum' across various asset classes, including equity index, currency, commodity, and bond futures, in 58 liquid instruments (find study below). There's a notable persistence in returns ranging from one to 12 months, which tends to partially reverse over longer periods. This pattern aligns with sentiment theories suggesting initial under-reaction followed by delayed over-reaction.
Despite its surprising ease of implementation, the academic community has successfully measured the effects of absolute momentum across decades and in every major asset class, including stocks, bonds, commodities, and foreign exchange (FX).
Strategies for Implementing Absolute Momentum:
To Buy a Stock:
Select a Look-Back Period: Choose a historical period to analyze the stock's performance. A common period is 12 months, but this can vary based on your investment strategy.
Calculate Excess Return: Determine the stock's excess return over this period. You can also assume a risk-free rate of "0" to simplify the process.
Evaluate Momentum:
If the excess return is positive, it indicates positive absolute momentum. This suggests the stock is in an upward trend and could be a good buying opportunity.
If the excess return is negative, it suggests negative momentum, and you might want to delay buying.
Consider further conditions: Align your decision with broader market trends, economic indicators, or fundamental analysis, for additional context.
To Sell a Stock You Own:
Regularly Monitor Performance: Use the same look-back period as for buying (e.g., 12 months) to regularly assess the stock's performance.
Check for Negative Momentum: Calculate the excess return for the look-back period. Again, you can assume a risk-free rate of "0" to simplify the process. If the stock shows negative momentum, it might be time to consider selling.
Consider further conditions:Align your decision with broader market trends, economic indicators, or fundamental analysis, for additional context.
Important note: Note: Entering a position (i.e., buying) based on positive absolute momentum doesn't necessarily mean you must sell it if it later exhibits negative absolute momentum. You can initiate a position using positive absolute momentum as an entry indicator and then continue holding it based on other criteria, such as fundamental analysis.
General Tips:
Reassessment Frequency: Decide how often you will reassess the momentum (monthly, quarterly, etc.).
Remember, while absolute momentum provides a systematic approach, it's recommendable to consider it as part of a broader investment strategy that includes diversification, risk management, fundamental analysis, etc.
Relevant Capital Market Studies:
Antonacci, Gary. "Absolute momentum: A simple rule-based strategy and universal trend-following overlay." Available at SSRN 2244633 (2013)
Moskowitz, Tobias J., Yao Hua Ooi, and Lasse Heje Pedersen. "Time series momentum." Journal of financial economics 104.2 (2012): 228-250
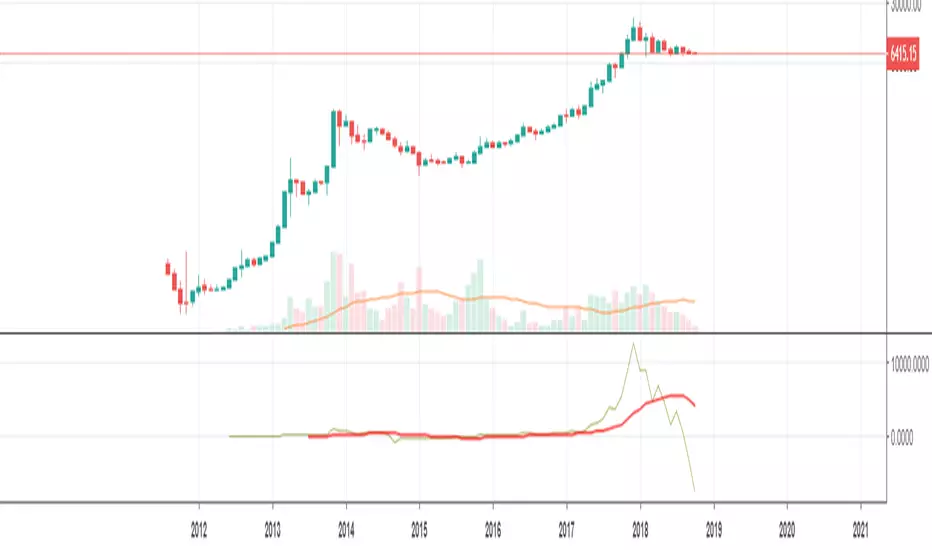
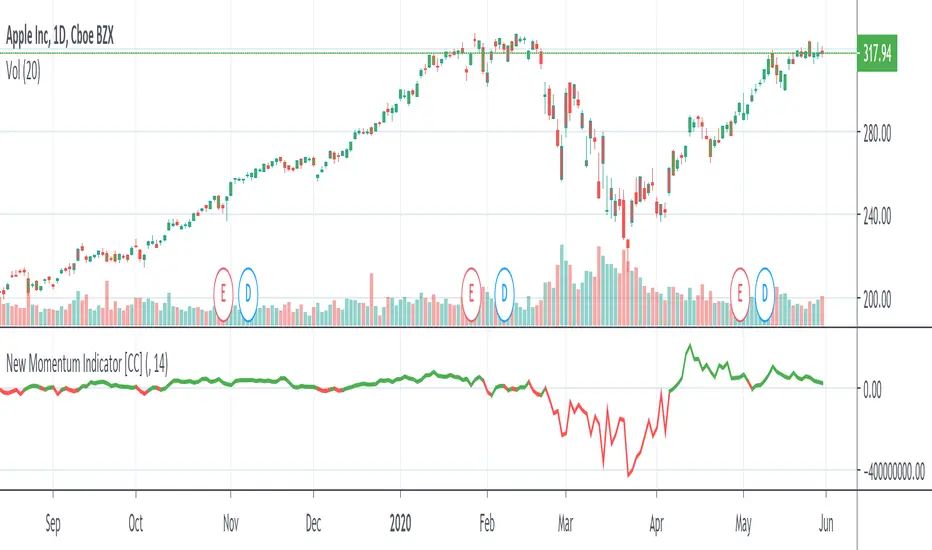
New Momentum IndicatorThe Momentum Indicator was created by Darryl W Maddox (Stocks & Commodities V. 9:4 (158-159)) and it is one of the simplest and most powerful indicators out there. Buy when the indicator goes over 0 and sell when it falls below 0
Let me know what other indicators you would like to see me write a script for!
ATR Momentum [QuantVue]ATR Momentum is a dynamic technical analysis tool designed to assess the momentum of a securities price movement. It utilizes the comparison between a faster short-term Average True Range (ATR) and a slower long-term ATR to determine whether momentum is increasing or decreasing.
This indicator visually represents the momentum relationship by plotting both ATR values as lines on a chart and applying color fill between the lines based on if momentum is increasing or decreasing.
When the short-term ATR is greater than the long-term ATR, representing increasing momentum, the area between them is filled with green.
Conversely, when the short-term ATR is less than the long-term ATR line, the area between them is filled with red. This red fill indicates decreasing momentum.
Don't hesitate to reach out with any questions or concerns.
We hope you enjoy!
Cheers.

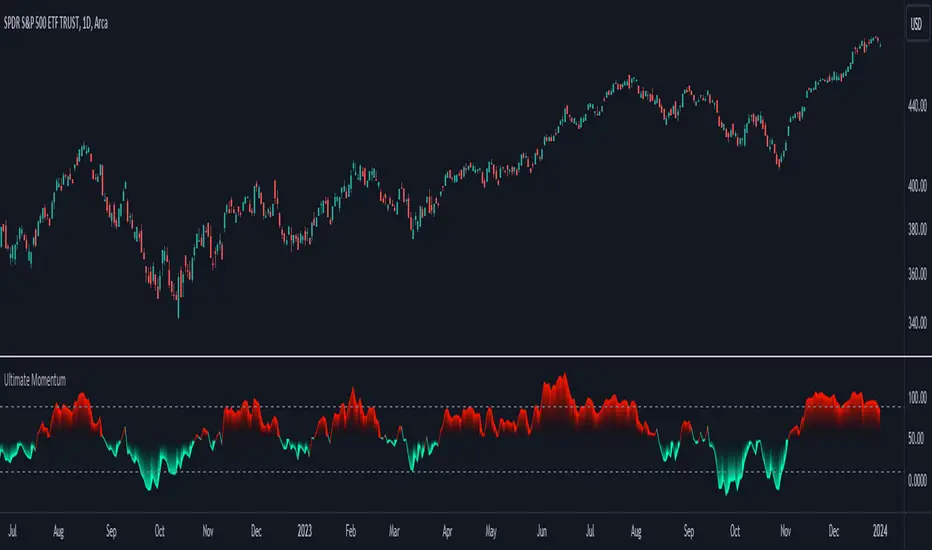
Ultimate Momentum"Ultimate Momentum" – Elevating Your Momentum Analysis
Experience a refined approach to momentum analysis with "Ultimate Momentum," a sophisticated indicator seamlessly combining the strengths of RSI and CCI. This tool offers a nuanced understanding of market dynamics with the following features:
1. Harmonious Fusion: Witness the dynamic interplay between RSI and CCI, providing a comprehensive understanding of market nuances.
2. Optimized CCI Dynamics: Delve confidently into market intricacies with optimized CCI parameters, enhancing synergy with RSI for a nuanced perspective on trends.
3. Standardized Readings: "Ultimate Momentum" standardizes RSI and CCI, ensuring consistency and reliability in readings for refined signals.
4. Native TradingView Integration: Immerse yourself in the reliability of native TradingView codes for RSI and CCI, ensuring stability and compatibility.
How RSI and CCI Work Together:
RSI (Relative Strength Index): Captures price momentum with precision, measuring the speed and change of price movements.
CCI (Commodity Channel Index): Strategically integrated to complement RSI, offering a unique perspective on price fluctuations and potential trend reversals.
Why "Ultimate Momentum"?
In a crowded landscape, "Ultimate Momentum" stands out, redefining how traders interpret momentum. Gain a profound understanding of market dynamics, spot trend reversals, and make informed decisions.
Your Insights Matter:
Share your suggestions to enhance "Ultimate Momentum" in the comments. Your feedback is crucial as we strive to deliver an unparalleled momentum analysis tool.
ADX Momentum Shaded CandlesDescription:
The "ADX Momentum Shaded Candles" indicator (ADXMSC) is an overlay indicator that enhances candlestick charts by adding shading based on the momentum derived from the Average Directional Index (ADX). This indicator provides visual cues about the strength of bullish and bearish momentum by adjusting the transparency of the candlesticks.
How it Works:
The indicator utilizes the ADX indicator to calculate the values of +DI (Directional Indicator Plus) and -DI (Directional Indicator Minus) based on user-defined parameters. It then determines the transparency levels for the bullish and bearish candlesticks based on the calculated values of +DI and -DI. Higher values of +DI or -DI result in lower transparency levels, while lower values increase transparency.
Transparency Calculation:
The transparency of the bullish and bearish candlesticks is adjusted based on the values of +DI and -DI, which reflect the momentum of the price movement. Transparency is inversely proportional to these values, with higher values resulting in lower transparency. To calculate transparency, the indicator uses the formula 100 minus the value of +DI or -DI multiplied by 2. This ensures that higher values of +DI or -DI produce more opaque candlesticks.
Usage:
To effectively use the "ADX Momentum Shaded Candles" indicator (ADXMSC), follow these steps:
1. Apply the indicator to your chart by adding it from the available indicators.
2. Observe the candlesticks on the chart:
- Bullish candlesticks are represented by the original bullish color with adjusted transparency.
- Bearish candlesticks are represented by the original bearish color with adjusted transparency.
3. Analyze the transparency levels of the candlesticks to assess the strength of bullish and bearish momentum. Less transparent candlesticks indicate stronger momentum, while more transparent ones suggest weaker momentum.
4. Combine the visual information from the shaded candlesticks with other technical analysis tools, such as support and resistance levels, trend lines, or oscillators, to confirm potential trade opportunities.
5. Customize the indicator's parameters, such as the ADX length and smoothing, to suit your trading preferences.
6. Implement appropriate risk management strategies, including setting stop-loss orders and position sizing, to manage your trades effectively and protect your capital.
