AutoFibGauge (TechnoBlooms) AutoFibGauge help users to understand Fibonacci retracement with auto-drawn levels from previous candes, dual moving average crossover for trend confirmation, and a thermometer for quick Fib level identification.
This indicator is designed to streamline your trading decisions. By automatically plotting the Fibonacci levels based on previous candles, it aids in identifying key support and resistance zones. User can choose the number of previous candles for which the Fibonacci is calculated.
Paired with a dual moving average crossover system for robust trend confirmation, this tools helps in aligning with the market's direction.
A dynamic thermometer display that instantly highlights critical Fib levels, making it easier than ever to spot opportunities at a glance.
Search in scripts for "moving average crossover"

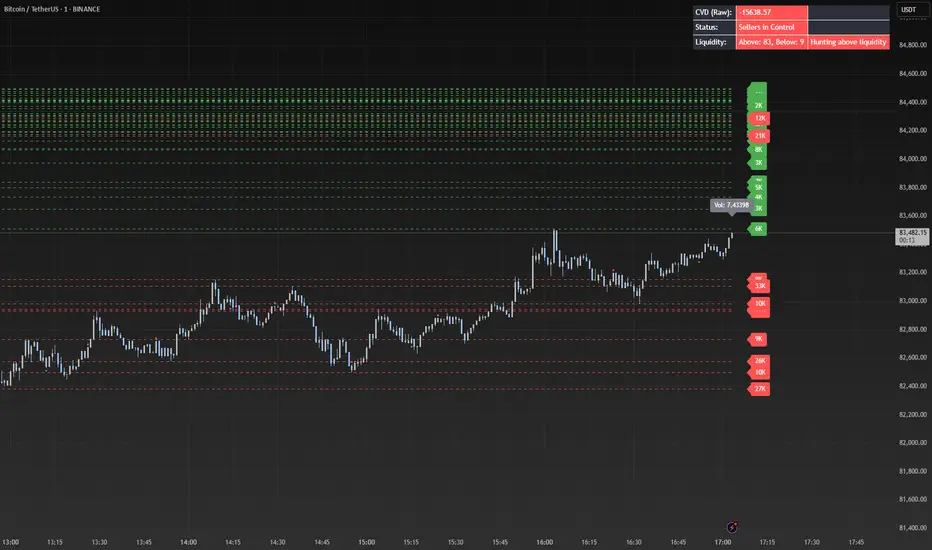
Liquidity Market Seeking SwiftEdgeThis indicator is designed to identify potential liquidity levels on the chart by detecting swing highs and lows, which are often areas where stop-loss orders or significant orders accumulate. It visualizes these levels with horizontal lines and labels on the right side of the chart, color-coded based on volume to help traders understand where the market might seek liquidity.
How It Works
Swing Highs and Lows: The indicator uses the ta.pivothigh and ta.pivotlow functions to identify significant swing points over a user-defined lookback period (Swing Length). These points are considered potential liquidity levels where stop-loss orders might be placed.
Volume Analysis: The indicator compares the volume at each swing point to the average volume over a specified period (Volume Average Length). Levels with above-average volume are colored red, indicating higher liquidity, while levels with below-average volume are colored green.
Liquidity Visualization: Horizontal dashed lines are drawn at each identified level, extending across the chart. Labels on the right side display the estimated liquidity amount (simulated based on volume and a multiplier, Volume Multiplier for Liquidity).
Sell Signal: A "SELL NOW" label appears when the price approaches a liquidity level after an uptrend (detected using a simple moving average crossover). This suggests a potential reversal as the market may target liquidity at that level.
Strategy Concept: Market Seeking Liquidity
The indicator is based on the concept that markets often move toward areas of high liquidity, such as clusters of stop-loss orders or significant order accumulations. These liquidity pools are typically found around swing highs and lows, where traders place their stop-losses or large orders. By identifying these levels and highlighting those with higher volume (red lines), the indicator aims to show where the market might move to "grab" this liquidity. For example, after an uptrend, the market may reverse at a swing high to take out stop-losses above that level, providing liquidity for larger players to enter or exit positions.
Settings
Swing Length: The number of bars to look back for detecting swing highs and lows. Default is 20.
Liquidity Threshold: The price threshold for merging nearby levels to avoid duplicates. Default is 0.001.
Volume Average Length: The period for calculating the average volume to compare against. Default is 20.
Volume Multiplier for Liquidity: A multiplier to scale the volume into a simulated liquidity amount (displayed as "K"). Default is 1000.
Usage Notes
Use this indicator on any timeframe, though it may be more effective on higher timeframes (e.g., 1H, 4H) where swing points are more significant.
Red lines indicate levels with higher volume, suggesting stronger liquidity pools that the market might target.
Green lines indicate levels with lower volume, which may be less significant.
The "SELL NOW" signal is a basic example of how to use liquidity levels for trading decisions. It appears when the price approaches a liquidity level after an uptrend, but it should be used in conjunction with other analysis.
Adjust the Volume Multiplier for Liquidity to scale the displayed liquidity amounts based on your instrument (e.g., forex pairs may need a higher multiplier than indices).
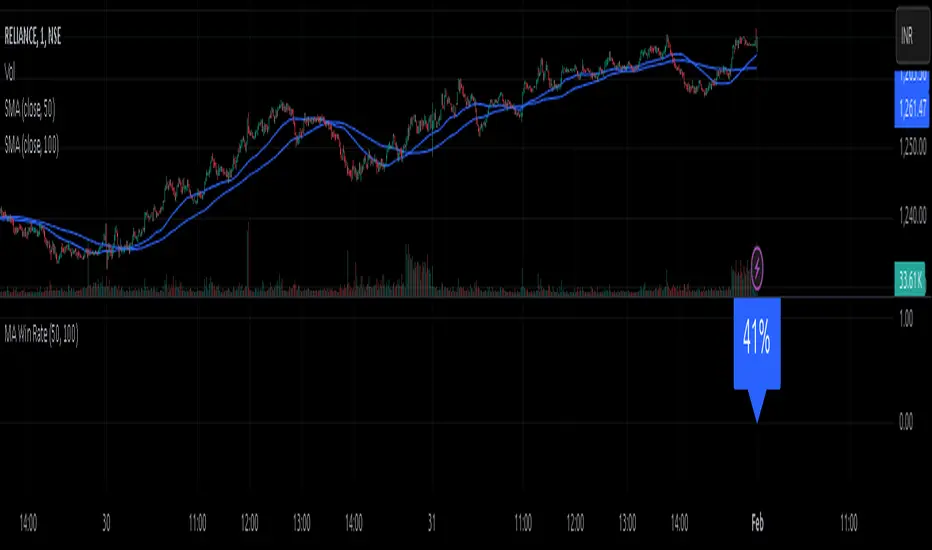
MA Win RateMoving Average Cross Win Rate
This simple yet useful script calculates the percentage of times a moving average crossover successfully predicts price movement.
Win Conditions:
1] A Golden Cross (fast MA crossing above slow MA) where the price moves up afterward.
2] A Death Cross (fast MA crossing below slow MA) where the price moves down afterward.
In this script, I have used a Simple Moving Average (SMA) for illustration.
You can modify the code to apply any type of moving average and test its accuracy.
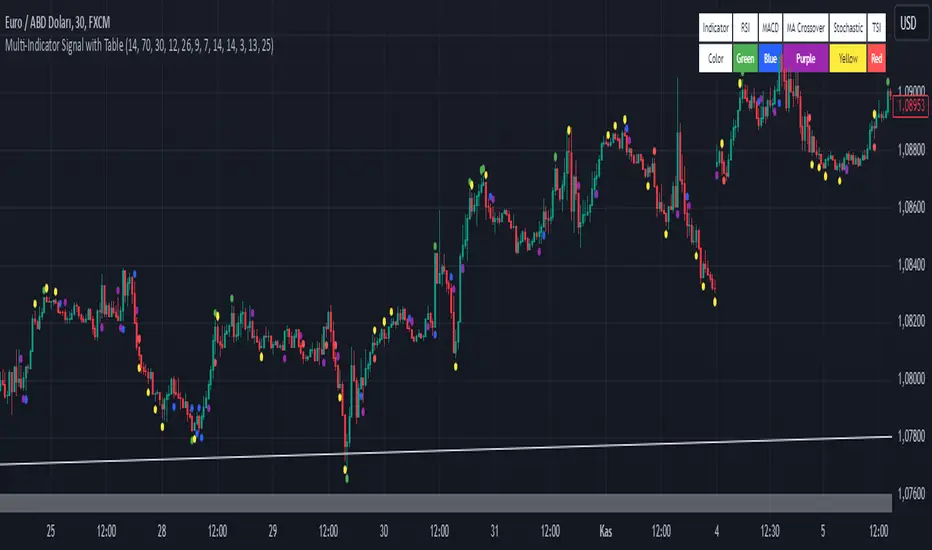
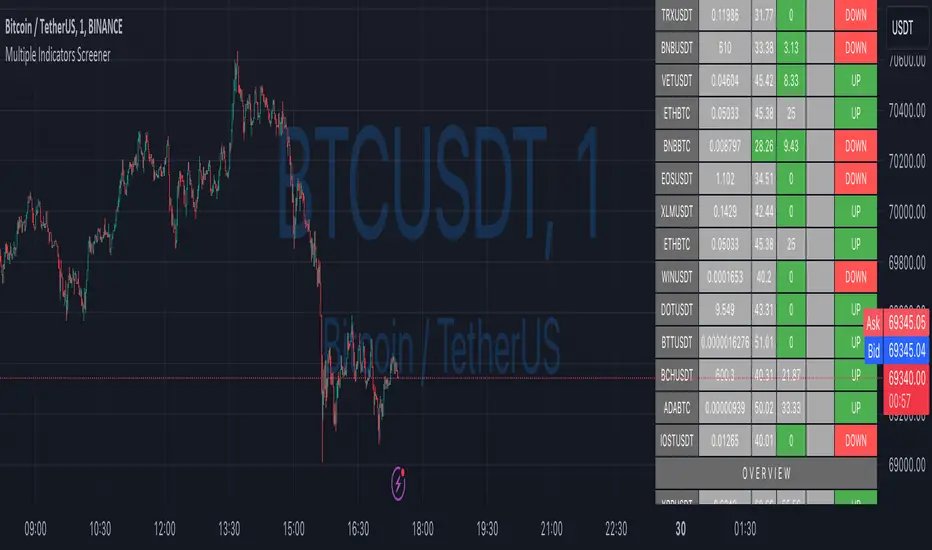
Multi-Indicator Signal with TableThis indicator is a versatile multi-indicator tool designed for traders who want to combine signals from various popular indicators into a single framework. It not only visualizes buy and sell signals but also provides a clear, easy-to-read table that summarizes the included indicators and their respective signal colors.
Key Features:
RSI (Relative Strength Index):
Buy Signal: RSI falls below the oversold level (default: 30).
Sell Signal: RSI rises above the overbought level (default: 70).
Signal Color: Green.
MACD (Moving Average Convergence Divergence):
Buy Signal: MACD line crosses above the signal line.
Sell Signal: MACD line crosses below the signal line.
Signal Color: Blue.
MA Crossover (Moving Average Crossover):
Buy Signal: Short EMA (default: 7) crosses above Long SMA (default: 14).
Sell Signal: Short EMA crosses below Long SMA.
Signal Color: Purple.
Stochastic Oscillator:
Buy Signal: Stochastic %K falls below 20 and crosses above %D.
Sell Signal: Stochastic %K rises above 80 and crosses below %D.
Signal Color: Yellow.
TSI (True Strength Index):
Buy Signal: TSI crosses above the zero line.
Sell Signal: TSI crosses below the zero line.
Signal Color: Red.
Dynamic Signal Table:
A clean, compact table displayed at the top-right corner of the chart, summarizing the indicators and their respective signal colors for quick reference.
Customization:
All indicator parameters are fully adjustable, allowing users to fine-tune settings to match their trading strategy.
Signal colors and table design ensure a visually intuitive experience.
Usage:
This tool is ideal for traders who prefer a multi-indicator approach for generating buy/sell signals.
The combination of different indicators helps to filter out noise and increase the accuracy of trade setups.
Notes:
Signals appear only after the confirmation of the current bar to avoid false triggers.
This indicator is designed for educational purposes and should be used in conjunction with proper risk management strategies.
Ultimate Custom MTF ScreenerThis indicator will allow you to make your custom TradingView MTF screener without coding. Add it to the chart, select up to 10 instruments, 4 timeframes, and 4 indicators, and the screener will do the rest for you. The indicator will form a lovely table with all values and highlighted signals.
The screener is highly customizable, and you can choose its position on the chart, sorting, order of the columns, and colors for the tables. You can easily change parameters for all supported indicators and their signals.
Currently, there are 21 different custom indicators available. Current list of indicators:
Average Directional Index (ADX) - displaying the value of ADX and checking if it's higher than the threshold
Average True Range (ATR) - showing the value of ATR
Awesome Oscillator (AO) - displaying the value of AO and highlighting positive/negative values.
Bollinger Bands (BB) - showing if the price is above/below/in the channel.
Breakout Pivots - Displaying when the price is below/above the most recent pivot low/high.
Commodity Channel Index (CCI) - shows the last CCI value and highlights overbought/oversold values.
Directional Movement Index (DMI) - Up/Down signal (+DI above or below -DI)
Donchian Channel (DC) - showing if the price is above/below/in the channel.
Heikin Ashi Count (HAC) - What is the current Heikin Ashi candle color and for how long was this color?
Historical Volatility (HV) - Current value of Historical Volatility
Keltner Channel (KC) -showing if the price is above/below/in the channel.
Moving Average Convergence Divergence (MACD) - Up/Down signal (MACD above / below signal)
Moving Average Crossover (MA Cross) - Displaying MA crosses signals (SMA, EMA, WMA, HMA, VWMA, SMMA, DEMA, VWAP supported)
Moving Average Distance (MA DIST) - Displaying distance to the MA (SMA, EMA, WMA, HMA, VWMA, SMMA, DEMA, VWAP supported)
Parabolic Stop and Reverse (PSAR) - Up or Down
Relative Strength Index (RSI) - Displaying the last RSI value and highlighting overbought/oversold values.
Stochastic (STOCH) - Displaying the last Stochastic value and highlighting overbought/oversold values.
Stochastic RSI (STOCH RSI) - Displaying the last Stochastic RSI value and highlighting overbought/oversold values.
SuperTrend - Current state of the SuperTrend.
Trailing Stop-Loss (TSL) - Up or Down
True Strength Index (TSI) - Displaying the last TSI value and highlighting overbought/oversold values.
We're already working on adding a few more supported indicators. If you have any ideas about the indicators you want to see in our screener, contact us, and we'll consider them.
Disclaimer
Please remember that past performance may not be indicative of future results.
Due to various factors, including changing market conditions, the strategy may no longer perform as well as in historical backtesting.
This post and the script don’t provide any financial advice.

Ultimate Custom ScreenerThis indicator will allow you to make your custom TradingView screener without coding. Add it to the chart, select up to 40 symbols and five indicators, and the screener will do the rest for you. The indicator will form a lovely table with all values and highlighted signals.
The screener is highly customizable, and you can choose its position on the chart, sorting, order of the columns, colors for the tables, and all signals separately. You can easily change parameters for all supported indicators and their signals.
Currently, there are 19 different custom indicators available. Current list of indicators:
Average Directional Index (ADX) - displaying the value of ADX and checking if it's higher than the threshold
Average True Range (ATR) - showing the value of ATR
Awesome Oscillator (AO) - displaying the value of AO and highlighting positive/negative values.
Bollinger Bands (BB) - showing if the price is above/below/in the channel.
Breakout Pivots - Displaying when the price is below/above the most recent pivot low/high.
Commodity Channel Index (CCI) - shows the last CCI value and highlights overbought/oversold values.
Directional Movement Index (DMI) - Up/Down signal (+DI above or below -DI)
Donchian Channel (DC) - showing if the price is above/below/in the channel.
Historical Volatility (HV) - Current value of Historical Volatility
Keltner Channel (KC) - showing if the price is above/below/in the channel.
Moving Average Convergence Divergence (MACD) - Up/Down signal (MACD above / below signal)
Moving Average Crossover (MA Cross) - Displaying MA crosses signals (SMA, EMA, WMA, HMA, VWMA, SMMA, DEMA, VWAP supported)
Moving Average Distance (MA DIST) - Displaying distance to the MA (SMA, EMA, WMA, HMA, VWMA, SMMA, DEMA, VWAP supported)
Price - Displaying the last price for the instrument
Relative Strength Index (RSI) - Displaying the last RSI value and highlighting overbought/oversold values.
Stochastic (STOCH) - Displaying the last Stochastic value and highlighting overbought/oversold values.
Stochastic RSI (STOCH RSI) - Displaying the last Stochastic RSI value and highlighting overbought/oversold values.
SuperTrend - Current state of the SuperTrend.
True Strength Index (TSI) - Displaying the last TSI value and highlighting overbought/oversold values.
We're already working on adding a few more supported indicators. If you have any ideas about the indicators you want to see in our screener, contact us, and we'll consider them.
Disclaimer
Please remember that past performance may not be indicative of future results.
Due to various factors, including changing market conditions, the strategy may no longer perform as well as in historical backtesting.
This post and the script don’t provide any financial advice.
TWAP + MA crossover Study [Dynamic Signal Lab]Dear TV'ers,
Hereby the study for the TWAP/moving average crossover, with taking profit options.
moving averages include: EMA , WMA , DEMA , TEMA , VAR, WWMA, ZLEMA , TSF , HULL, TILL
It is also possible to gradually take profit, using:
* minimum consecutive green/red candles
* minimum amount of green/red candles in the last 2-8 candles
* both of the above criteria
The slightly transparent green fill shows how much you are in profit from your entry point
The current default properties should be modified to make this strategy cost-effective, but typically 15 minutes and higher timeframes (up to 6hr) seem to work well for larger (top10 cap) crypto projects. Don't use this script for small-caps as it will get you rekt, due to wild volatility.
Additionally, you'll also be able to continuously take profit, making sure you lock in all those sweet profits. For backtesting: use the strategy version of this script

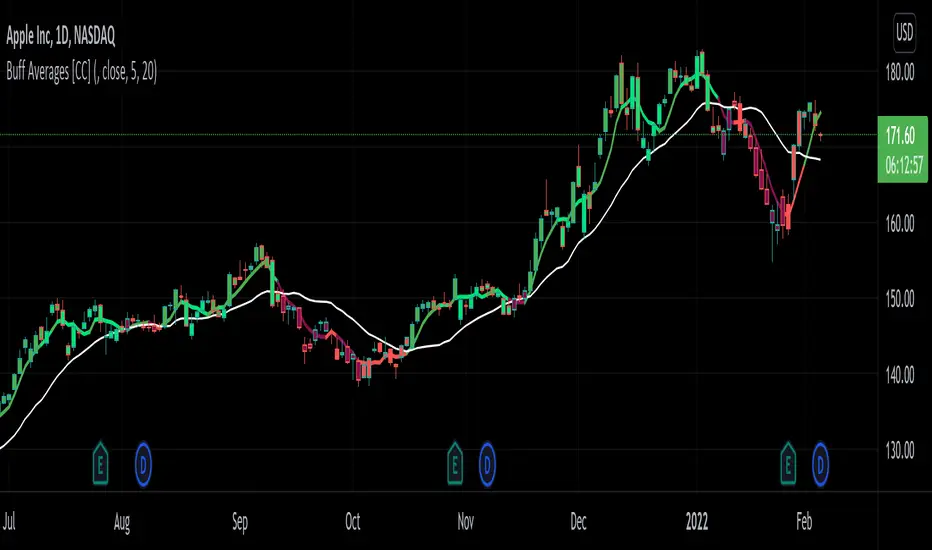
Buff Averages [CC]The Buff Averages were created by Buff Dormeier (Stocks and Commodities Feb 2001) and this is another hidden gem that is a combo of a volume weighted indicator and a moving average crossover system. It uses a special method to calculate the weighting based on volume. The colored line (fast buff) will follow the price closely and you use the other line to act as a trend confirmation. I have included strong buy and sell signals in addition to normal ones so strong signals are darker in color and normal signals are lighter in color. Buy when the line turns green and sell when it turns red.
Let me know if there are any other indicators or scripts you would like to see me publish!
Trend Analysis Index [CC]The Trend Analysis Index was created by Adam White and not to be confused with the Trend Analysis Indicator that I also published. This indicator operates under the same idea but using a completely different calculation to achieve similar results. The idea behind this indicator is for a combination of volatility and trend confirmation. If the indicator is above it's signal line then the stock is very volatile and vice versa. If the stock is currently trending as in above a chosen moving average for example and the indicator falls below the signal line then there is a pretty good chance in a trend reversal. The recommended buy and sell system to use is to pair this indicator with a moving average crossover system which I have included in the script. Buy when the indicator is above it's signal and the shorter moving average crosses above the longer moving average. For selling you would do the same and sell when the indicator is above it's signal and the shorter moving average crosses below the longer moving average. I have included strong buy and sell signals in addition to the normal ones so stronger signals are darker in color and normal signals are lighter in color.
Let me know what other indicators or scripts you would like to see me publish!

Relative Strength Exponential Moving Average [CC]The Relative Strength Exponential Moving Average was created by Vitali Apirine (Stocks and Commodities Jan 2022 pgs 22-25) and this is a handy moving average that combines a typical overbought/oversold mechanic with an overall trend indicator. Even though the typical length is so large it reacts extremely quickly when the stock becomes overbought or oversold. Because of this the indicator by itself doesn't work as well during choppy periods so Vitali recommends using a moving average crossover system during choppy so do one indicator with the default length of 50 and use a different length of 10 so when the shorter length crosses over the longer length then buy and vice versa you would sell. Generally speaking buy when the line turns green and sell when it turns red. I have used strong buy and sell signals in addition to normal signals so strong signals are darker in color and normal signals are lighter in color.
Let me know if there are any other scripts or indicators you would like me to publish!

QuantBot 3:Ultimate MA CrossoverThis is the 3rd indicator of quantbot indicator series.
This the names as ultimate moving average crossover as it considers 9 types of moving averages while generating signals.
The finctionality is pretty basic.
It comes with automated signal processing from tradingview to Indian brokers account via webhook, using our automation setup.
To get the access please text me in the chatbox, ACCESS is given for FREE.
This is purely for charting purpose, if you find it useful please let me know in the comment box below.
If you want me to code any particular strategy please mention this in the comment box.

Vertical Horizontal Moving Average [AneoPsy & alexgrover] Moving average adapting to the strength of the trend, this is made possible by using the square of the vertical-horizontal filter as a smoothing factor. Alerts are included with two different types of conditions available to the user.
Settings
Length : Period of the moving average
Src : Input data for the indicator
Alerts : Types of conditions to be used in the alerts, when set to "VHMA Direction Change" alerts are triggered once the VHMA is either rising or declining, else the alerts are based on the crosses between Src and the VHMA
Usage
The VHMA can be used as a fast or slow-moving average in a moving average crossover system, or as input for other indicators.
VHMA of with length = 25 and sma with length = 200.
VHMA with length = 25 used as input for the RSI with length = 14.
Details
The vertical-horizontal filter is a measure of the strength of the trend and lay in a (0,1) range, to calculate it you just need to divide the rolling range over with the rolling sum of the absolute price changes, squaring the result allow to get lower results with higher values of length .
Squared vertical horizontal filter with length = 50, the value is low when the market is ranging and high when trending.
To set the alerts go in the alert panel, click on create alert, and select VHMA in "condition", choose between the buy or sell alert. If Src = closing price or another indicator dependant on the closing price select in options "once per bar close", if the indicator using the opening or lagged closing prices values as input select "One per bar" instead.
Thanks
Thanks to AneoPsy for adding the color change, the idea to use two kinds of conditions for the alert, and for its feedback, you can follow him
www.tradingview.com
and finally thanks to you for reading and for your support, only one last script left for the month, then we'll start July with some pretty interesting indicators, I hope you'll like them ^^/

MA Crossover [Alerts]This is a Moving Average Crossover study .
The study comes with all alerts (Long, Short, Take Profit, and Stop Loss).
A few visuals like Exit Loss and Profit/Loss Boxes have been added as well.
The following Moving Averages are supported:
SMA
EMA
DEMA
TEMA
WMA
VWMA
SMMA
HullMA
LSMA
ALMA
SSMA
TMA
ZLEMA
If you’d like to automate this script you can do that by using AutoView, ProfitView, ProfitTrailer, CryptoHopper etc.
Feel free to leave a comment and share it with your friends. Enjoy!

Hull TrendHere we are using Hull Moving Average crossovers as an experiment in trend detection.
The Hull Moving Average (HMA) is an extremely fast and smooth moving average.
Credit to alexgrover & RicardoSantos:

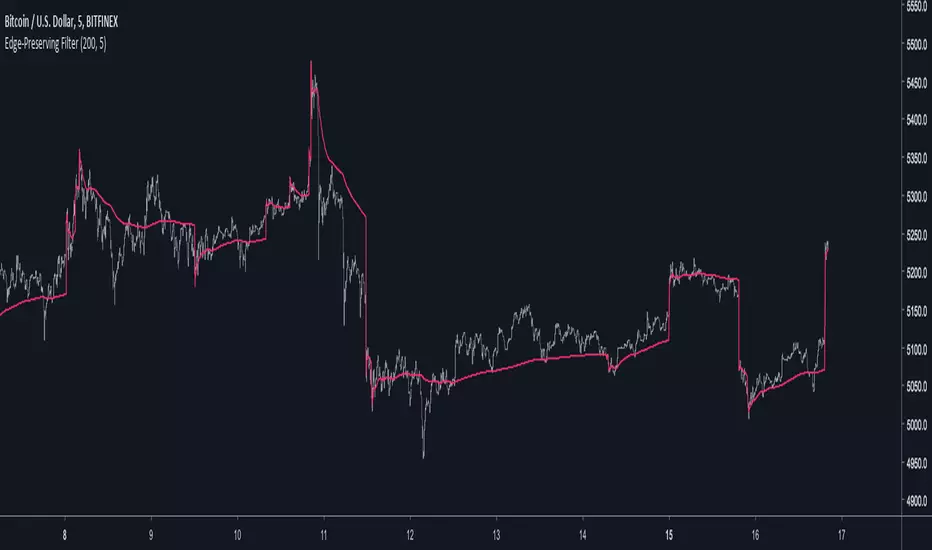
Edge-Preserving FilterIntroduction
Edge-preserving smoothing is often used in image processing in order to preserve edge information while filtering the remaining signal. I introduce two concepts in this indicator, edge preservation and an adaptive cumulative average allowing for fast edge-signal transition with period increase over time. This filter have nothing to do with classic filters for image processing, those filters use kernels convolution and are most of the time in a spatial domain.
Edge Detection Method
We want to minimize smoothing when an edge is detected, so our first goal is to detect an edge. An edge will be considered as being a peak or a valley, if you recall there is one of my indicator who aim to detect peaks and valley (reference at the bottom of the post) , since this estimation return binary outputs we will use it to tell our filter when to stop filtering.
Filtering Increase By Using Multi Steps Cumulative Average
The edge detection is a binary output, using a exponential smoothing could be possible and certainly more efficient but i wanted instead to try using a cumulative average approach because it smooth more and is a bit more original to use an adaptive architecture using something else than exponential averaging. A cumulative average is defined as the sum of the price and the previous value of the cumulative average and then this result is divided by n with n = number of data points. You could say that a cumulative average is a moving average with a linear increasing period.
So lets call CMA our cumulative average and n our divisor. When an edge is detected CMA = close price and n = 1 , else n is equal to previous n+1 and the CMA act as a normal cumulative average by summing its previous values with the price and dividing the sum by n until a new edge is detected, so there is a "no filtering state" and a "filtering state" with linear period increase transition, this is why its multi-steps.
The Filter
The filter have two parameters, a length parameter and a smooth parameter, length refer to the edge detection sensitivity, small values will detect short terms edges while higher values will detect more long terms edges. Smooth is directly related to the edge detection method, high values of smooth can avoid the detection of some edges.
smooth = 200
smooth = 50
smooth = 3
Conclusion
Preserving the price edges can be useful when it come to allow for reactivity during important price points, such filter can help with moving average crossover methods or can be used as a source for other indicators making those directly dependent of the edge detection.
Rsi with a period of 200 and our filter as source, will cross triggers line when an edge is detected
Feel free to share suggestions ! Thanks for reading !
References
Peak/Valley estimator used for the detection of edges in price.
Short-Term Trend MasterThis is a short-term trend-following trading strategy.
Buy when there is a moving average crossover and green background signal.
Sell when there is a moving average crossover and red background signal.
Try different timeframes to find the best one.
Cheers!

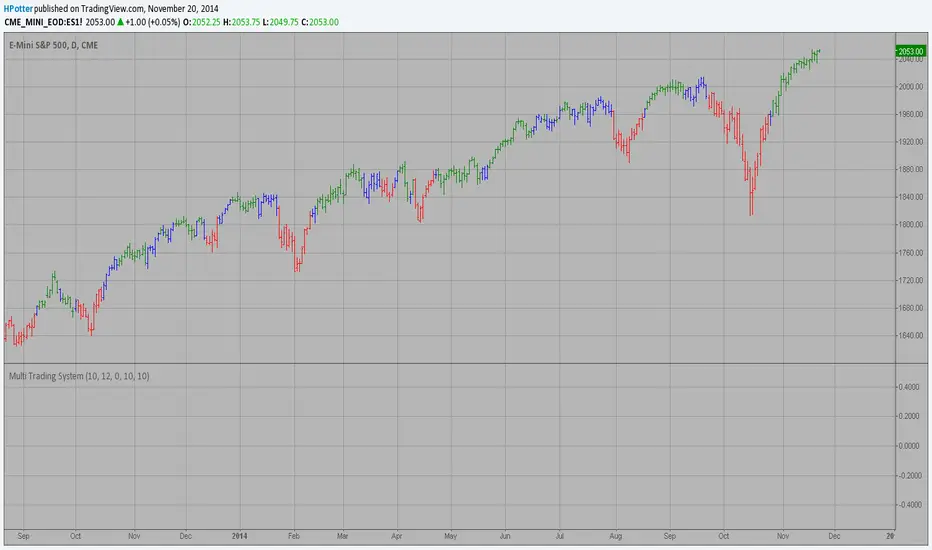
MultiTradingSystemThis is example to show how you can combine two and more strategies for get
a cumulative signal. Result signal will return 1 if two (or more) strategies
is long, -1 if all strategies is short and 0 if signals of strategies is not equal.
First strategy
Chaikin's Volatility indicator compares the spread between a security's
high and low prices. It quantifies volatility as a widening of the range
between the high and the low price.
You can use in the xPrice1 and xPrice2 any series: Open, High, Low, Close, HL2,
HLC3, OHLC4 and ect...
Secon strategy
The Moving Average Crossover trading strategy is possibly the most popular
trading strategy in the world of trading. First of them were written in the
middle of XX century, when commodities trading strategies became popular.
This strategy is a good example of so-called traditional strategies.
Traditional strategies are always long or short. That means they are never
out of the market. The concept of having a strategy that is always long or
short may be scary, particularly in today’s market where you don’t know what
is going to happen as far as risk on any one market. But a lot of traders
believe that the concept is still valid, especially for those of traders who
do their own research or their own discretionary trading.
This version uses crossover of moving average and its exponential moving average.
MTF Dashboard Table - Sachin ThakareOne Dashboard, Complete Market View!
By - Sachin Thakare (India, Mumbai)
MTF HUD Indicator - All-in-One Market Dashboard
📊 Basic Information
Indicator Name: MTF HUD Table - Bias Column
Created By: Sachin Thakare
Version: Pine Script v5
Type: Multi-Timeframe Heads-Up Display (HUD)
Category: Strategy/Utility Tool
🎯 What This Indicator Does
This is a comprehensive Multi-Timeframe Market Dashboard that displays key technical indicators across 8 different timeframes (3min to Monthly) in a single, easy-to-read table format. It helps traders quickly assess market bias and make informed decisions.
✨ Key Features
📈 Multi-Timeframe Analysis
8 Timeframes: 3m, 5m, 15m, 1H, 4H, Daily, Weekly, Monthly
Real-time Updates: All timeframes update simultaneously
Color-coded Signals: Instant visual feedback
🔢 Technical Indicators Included
Price Change & % Change - Immediate price movement
VWAP - Volume Weighted Average Price
EMA 9/21 - Exponential Moving Average crossover
200 MA - Long-term trend indicator
SuperTrend 10/3 - Trend-following indicator
RSI 9 - Momentum oscillator
MACD 8/21/5 - Moving Average Convergence Divergence
ADX 7/7 - Average Directional Index
Alligator - Bill Williams' trend indicator
Stochastic 5/3/3 - Overbought/Oversold levels
ATR 10 - Average True Range (volatility)
PH/PL - Previous Day High/Low position
🎨 Visual Design
Color Psychology:
🟢 Green: Strong Bullish
🟩 Light Green: Bullish
🔴 Red: Strong Bearish
🟥 Light Red: Bearish
⚪ Gray: Neutral
Customizable Position: Top/Bottom, Left/Right, Center
Clean Table Format: Professional HUD-style display
⚙️ Smart Features
Bias Column: Automatic market bias calculation
Score-based System: 11 indicators contribute to bias score
Customizable Thresholds: Adjust bull/bear levels
Multi-timeframe Security: Accurate timeframe calculations
🚀 How to Use
For Beginners:
Install the indicator on any chart
Look at the BIAS column for overall market direction
Check consistency across timeframes
Stronger signals when multiple timeframes agree
For Advanced Traders:
Identify confluence - When multiple indicators align
Timeframe alignment - Look for agreements across timeframes
Divergence spotting - When timeframes show conflicting signals
Entry/Exit points - Use with price action confirmation
Trading Strategies:
Trend Following: Follow the dominant bias across higher timeframes
Mean Reversion: Look for extreme readings in oscillator columns
Breakout Trading: Use PH/PL and ATR columns
Swing Trading: Focus on 4H and Daily timeframes
⚙️ Customization Settings
Position Settings:
Choose from 5 display positions
Adjust to your preferred chart layout
Indicator Parameters:
Adjust all indicator lengths and periods
Modify OB/OS levels for RSI and Stochastic
Change MA types (SMA/EMA) for 200 MA
Bias Thresholds:
Strong Bull Threshold: 8 (default)
Bull Threshold: 3 (default)
Bear Threshold: -3 (default)
Strong Bear Threshold: -8 (default)
💡 Pro Tips
Start with Higher Timeframes - Daily and Weekly first
Look for Alignment - Best trades when 3+ timeframes agree
Watch the BIAS Column - Quick market sentiment check
Combine with Price Action - Use support/resistance with signals
Risk Management - Never trade on indicator alone
⚠️ Important Notes
Not a Standalone System: Use with other analysis methods
Lagging Indicators: Most components are trend-following
Market Conditions: Works best in trending markets
Customize for Your Style: Adjust parameters for your trading style
🔄 Updates & Support
The indicator is regularly updated based on user feedback and market changes. For suggestions or issues, please leave a comment on the TradingView script page.
Perfect For: Day Traders, Swing Traders, Position Traders, Market Analysts, and anyone needing quick multi-timeframe analysis.
Best Results: When combined with fundamental analysis, risk management, and proper trading psychology.

Prowl's EMA 10/20/50 trend followingThis indicator is designed to simplify trend trading by visually filtering market noise. It removes the need to constantly analyze multiple moving average crossovers by converting complex trend alignment into a simple "Traffic Light" background system.
How it Works This script utilizes a triple-EMA (Exponential Moving Average) system to gauge market conditions on two levels:
Momentum: It analyzes the relationship between the Fast and Medium EMAs to determine immediate short-term momentum.
Trend Filter: It compares the current price action against a Slow (Baseline) EMA to ensure the major trend is respected.
Visual Guide
Green Background: This indicates a "High Probability Buy Zone." It only triggers when both the short-term momentum is positive (Fast EMA ≥ Medium EMA) AND the price is maintaining its structure above the long-term baseline (Price ≥ Trend EMA).
Red Background: Indicates neutral or bearish conditions where the trend alignment is broken.
The Lines:
Red Line: Fast EMA (Short-term reaction)
Orange Line: Medium EMA (Intermediate trend)
Green Line: Trend EMA (Long-term baseline)
Features
Visual Simplicity: The background color allows you to instantly see if the trend is in your favor without cluttering your mental space.
Fully Customizable: All EMA lengths are adjustable in the settings to fit your specific timeframe (Scalping vs. Swing Trading).
Gradient Colors: The lines are color-coded (Red to Green) to visually represent the time horizon.
Adjustable Opacity: Users can control the intensity of the background color to keep their charts clean.
Usage Strategy This tool is best used as a "Trend Filter." Traders can look for their specific entry setups (candlestick patterns, breakouts, etc.) only when the background is Green, and stand aside or look for shorts when the background is Red.

CS Institutional X-Ray (Perfect Sync)Title: CS Institutional X-Ray
Description:
CS Institutional X-Ray is an advanced Order Flow and Market Structure suite designed to reveal what happens inside Japanese candles.
Most traders only see open and close prices. This indicator utilizes VSA (Volume Spread Analysis) algorithms and Synthetic Footprint Logic to detect institutional intervention, liquidity manipulation, and market exhaustion.
🧠 1. The Mathematical Engine: Synthetic Footprint
The core of this indicator is not based on moving average crossovers, but on market physics: Effort vs. Result.
The script scans every candle and calculates:
Buy/Sell Pressure: Analyzes the close position relative to the total candle range and weights it by volume.
Synthetic Delta: Calculates the net difference between buyer and seller aggression.
Volume Anomalies: Detects when volume is abnormally high (Institutional) or low (Retail).
The Absorption Logic: The indicator hunts for divergences between candle color and internal flow.
Example: If price drops hard (Red Candle) with massive volume, but the close moves away from the low, the algorithm detects that massive LIMIT orders absorbed the selling pressure. Result: Institutional Buy Signal.
📊 2. The Institutional Semaphore (Visual Guide)
The indicator automatically recolors candles to show the real state of the auction:
🔵 CYAN (Whale Buy): Bullish Absorption. Institutions buying aggressively or absorbing selling pressure at support.
🟣 MAGENTA (Whale Sell): Bearish Absorption. Institutions selling into strength or stopping a rally with sell walls.
⚪ GREY (Exhaustion/Zombie): "No-Trade" Zone. Volume is extremely low. The movement lacks institutional backing and is prone to failure.
🟢/🔴 Normal: Market in equilibrium.
🛡️ 3. Smart Zone System (Market Memory)
The indicator draws and manages Support and Resistance levels based on volume events, not just pivots.
Virgin Zones (Bright): When a "Whale" appears, a solid line is projected. If price has not touched it again, it is a high-probability bounce zone.
Automatic Mitigation: The exact moment price touches a line, the indicator detects the mitigation. The line turns Grey and Dotted, and the label dims. This keeps the chart clean, showing only what is relevant now.
☠️ 4. Manipulation Detector (Liquidity Grabs)
The system distinguishes between a normal reversal and a "Stop Hunt".
Signal: ☠️ GRAB
Logic: If price breaks a previous Low/High to sweep liquidity and closes with an absorption candle (Whale), it is marked as a "Grab." This is the system's most powerful reversal signal.
🧱 5. FVG with Liquidity Score
The indicator draws Fair Value Gaps (Imbalances) and assigns them a volume score.
"Vol: 3.0x": Indicates that the gap was created with 3 times the average volume, making it a much stronger price magnet than a standard FVG.
🚀 How to Trade with CS Institutional X-Ray
Identify the Footprint: Wait for a Cyan or Magenta candle to appear.
Validate the Trap: If the signal comes with a "☠️ GRAB" label, the probability of success increases drastically.
The Retest (Entry): Do not chase price. Place a Limit order on the generated Zone Line or at the edge of the FVG.
Management: Use opposite zones or mitigated zones (grey) as Take Profit targets.
Included Settings:
Fully configurable Alerts for Whales, Grabs, and Retests.
Total customization of colors and styles.

One Minute AI scalper keep extended trading hours on# One Minute AI Scalper - Trading Indicator
## Overview
The One Minute AI Scalper is a precision-engineered trading indicator designed specifically for short-term scalping strategies on 1-minute timeframes. This indicator combines multiple technical analysis methods to identify high-probability entry points for both long and short positions, making it ideal for active traders seeking quick, momentum-based opportunities.
## Key Features
### Visual Signals
- **Long Entry Arrows**: Clear green triangle markers appear below price bars when bullish conditions align
- **Short Entry Arrows**: Clear red triangle markers appear above price bars when bearish conditions align
- Clean, uncluttered chart interface focusing on actionable signals
### Advanced Signal Generation
The indicator utilizes a sophisticated multi-factor approach to generate trading signals:
1. **Trend Analysis**: Employs moving average crossover methodology to identify the prevailing market direction
2. **Momentum Confirmation**: Analyzes candlestick patterns and price behavior to confirm momentum strength
3. **Volume Validation**: Incorporates volume analysis to distinguish between high-conviction and standard signals
4. **Reversal Detection**: Identifies potential trend reversals by examining recent price action patterns
5. **Precision Entry Filtering**: Uses specific candlestick characteristics to minimize false signals
### Alert System
Comprehensive alert functionality for all signal types:
- Long Entry alerts
- Short Entry alerts
## How It Works
### Long Position Signals
The indicator generates long entry signals when multiple bullish conditions simultaneously align, including:
- Confirmation of upward momentum through price action
- Specific candlestick structure indicating strong buying pressure
- Price position relative to key moving averages
- Recent price behavior suggesting reversal potential
- Volume characteristics supporting the move
### Short Position Signals
Short entry signals are generated when multiple bearish conditions converge, including:
- Confirmation of downward momentum through price action
- Specific candlestick structure indicating strong selling pressure
- Price position relative to key moving averages
- Recent price behavior suggesting reversal potential
- Volume characteristics supporting the move
### Position Management
The indicator includes intelligent position state tracking to:
- Prevent duplicate signals while in an active position
- Generate exit signals based on opposing price action
- Maintain clear status of whether you're in a long or short position
## Best Practices
### Recommended Usage
- **Timeframe**: Optimized for 1-minute charts
- **Extended Hours**: Keep extended trading hours enabled for full market coverage
- **Markets**: Works on stocks, forex, crypto, and futures
- **Strategy**: Best suited for scalping and day trading strategies
### Risk Management
- Always use proper stop-loss orders
- Consider position sizing based on account risk tolerance
- Pay attention to volume-indicated signals for higher conviction trades
- Avoid trading during low-liquidity periods
- Combine with your own risk management rules
### Trading Tips
- Higher volume signals generally indicate stronger conviction
- Wait for clear arrow signals rather than trying to anticipate them
- Monitor overall market conditions and major support/resistance levels
- Be aware of news events that may cause unusual volatility
- Practice in a paper trading account before using real capital
## Important Notes
### What This Indicator Does
✅ Provides clear visual entry signals for long and short positions
✅ Incorporates multiple technical factors for signal generation
✅ Includes volume analysis for conviction assessment
✅ Offers comprehensive alert options for all signal types
✅ Maintains position state awareness
### What This Indicator Doesn't Do
❌ Does not guarantee profitable trades
❌ Does not provide specific price targets or stop-loss levels
❌ Does not replace the need for proper risk management
❌ Does not account for fundamental analysis or news events
❌ Does not adapt settings automatically to market conditions
## Disclaimer
This indicator is provided for educational and informational purposes only. It is not financial advice, and past performance does not guarantee future results. Trading involves substantial risk of loss, and you should only trade with capital you can afford to lose. Always conduct your own research and consider consulting with a qualified financial advisor before making trading decisions.
## Configuration
This indicator uses fixed, optimized parameters that have been carefully calibrated for 1-minute scalping. No user configuration is required - simply add it to your chart and monitor for signals.
## Support
For questions, suggestions, or feedback about this indicator, please use the comments section or contact the author directly through TradingView.
---
**Version**: 6.0
**Category**: Momentum/Scalping
**Overlay**: Yes
**Timeframe**: 1 minute (optimized)

Quantum Range Filter by MRKcoin### Quantum Range Filter by MRKcoin
**Overview**
This indicator is a sophisticated range detection tool designed based on the principles of quantitative multi-factor models. Instead of relying on a single condition, it assesses the market from three different dimensions to provide a more robust and reliable identification of range-bound (sideways) markets.
When the background is highlighted in red, it indicates that the market is likely in a range phase, suggesting that trend-following strategies may be less effective, and mean-reversion (range trading) strategies could be more suitable.
---
**Core Logic: A Multi-Factor Approach**
The filter evaluates the market state using the following three independent factors:
1. **Momentum Volatility (RSI Bollinger Bandwidth):**
* **Question:** Is the momentum of the market contracting?
* **Method:** It measures the width of the Bollinger Bands applied to the RSI. A narrow bandwidth suggests that momentum is consolidating, which is a common characteristic of a range market.
2. **Price Volatility (ATR Ratio):**
* **Question:** Is the actual price movement shrinking?
* **Method:** It calculates the Average True Range (ATR) as a percentage of the closing price. A low ratio indicates that the price volatility itself is low, reinforcing the case for a range environment.
3. **Absence of Trend (ADX):**
* **Question:** Is there a lack of a clear directional trend?
* **Method:** It uses the Average Directional Index (ADX), a standard tool for measuring trend strength. A low ADX value provides active confirmation that the market is not in a trending phase.
---
**How to Use**
1. **Range Detection:** The primary use is to identify ranging markets. The red highlighted background serves as a visual cue.
2. **Strategy Selection:**
* **Inside the Red Zone:** Consider using range-trading strategies (e.g., buying at support, selling at resistance, using oscillators like RSI or Stochastics for overbought/oversold signals). Avoid using trend-following indicators like moving average crossovers, as they are prone to generating false signals in these conditions.
* **Outside the Red Zone:** The market is likely trending. Trend-following strategies are more appropriate.
3. **Parameter Tuning (In Settings):**
* **This is the key to adapting the filter to any market or timeframe.** Different assets (like BTC vs. ETH) and different timeframes have unique volatility characteristics. Don't hesitate to adjust the parameters to fit the specific chart you are analyzing.
* **Range Detection Score:** This is the most important setting. It determines how many of the three factors must agree to classify the market as a range. The default is `2`, which provides a good balance.
* If the filter seems **too sensitive** (highlighting too often), increase the score to `3`.
* If the filter seems **not sensitive enough** (missing obvious ranges), decrease the score to `1`.
* **Factor Thresholds:** For fine-tuning, adjust the thresholds for each factor.
* **`RSI BB Width Threshold`:** If you want to detect even tighter momentum consolidations, *decrease* this value.
* **`ATR Ratio Threshold`:** If you want to be stricter about price volatility, *decrease* this value.
* **`ADX Threshold`:** To be more lenient on what constitutes a "trendless" market, *increase* this value (e.g., to 30). To be stricter, *decrease* it (e.g., to 20).
* **Pro Tip:** Use the Debug Table (uncomment it in the script's code) to see the live values of each factor. This will give you a clear idea of how to set the thresholds for the specific asset you are trading.
**Disclaimer**
This indicator is a tool to assist in market analysis and should not be used as a standalone signal for making financial decisions. Always use it in conjunction with your own trading strategy, risk management, and analysis. Past performance is not indicative of future results.
**Credits**
* **Concept & Vision:** MRKcoin

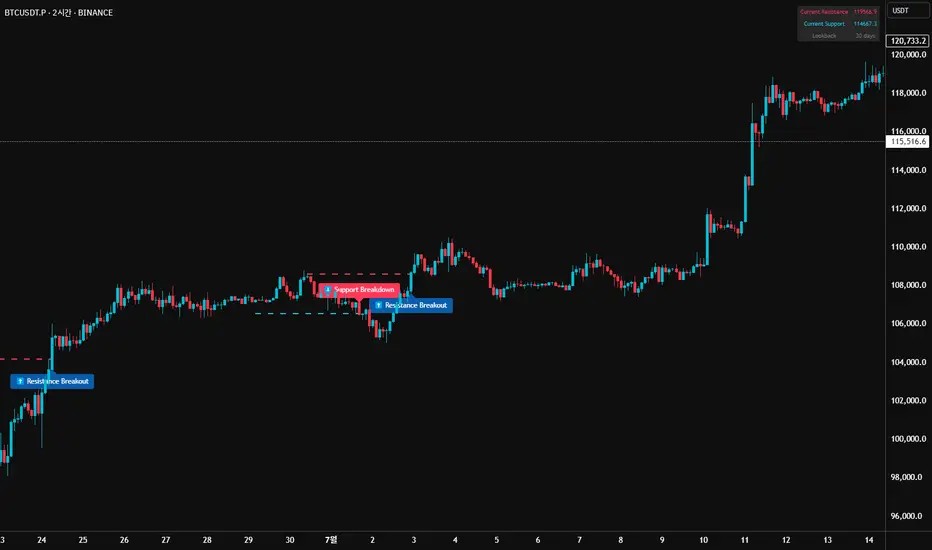
52SIGNAL RECIPE Market Structure Reversal Signals═══ 52SIGNAL RECIPE Market Structure Reversal Signals ═══
◆ Overview
52SIGNAL RECIPE Market Structure Reversal Signals is a technical indicator designed to detect structural changes in price charts and identify potential trend reversals. By tracking highs and lows over a specified period, this indicator provides clear visual signals when significant price breakouts occur, helping traders capture directional changes in the market early.
─────────────────────────────────────
◆ Key Features
• Structural Reversal Detection: Provides potential trend change signals when price breaks through recent N-day highs/lows
• Duplicate Signal Prevention: Filters out consecutive signals in the same direction
• Intuitive Visualization: Clearly distinguishes bullish/bearish reversal signals by color and position on the chart
• Confirmed Bar Based: Generates signals only after bars are completely closed, enhancing reliability
• Customizable Settings: Adjustable tracking period to optimize for various market environments and timeframes
─────────────────────────────────────
◆ Technical Foundation
■ Market Structure Analysis Principle
• High/Low Tracking: Identifies previous highs (LH) and lows (HL) over the specified period
• Structural Breakout: Interprets as structural change when closing price breaks above previous high or below previous low
• Confirmed Bar Verification: Minimizes false signals by generating signals only after the current bar has completely closed
■ Signal Filtering Mechanism
• Signal State Tracking: Prevents duplicate signals by tracking the direction of the last generated signal
• Directional Change Focus: Suppresses signals in the same direction until an opposite signal occurs
• Noise Reduction: Focuses only on important level breakouts, eliminating unnecessary signals
─────────────────────────────────────
◆ Practical Applications
■ Trend Reversal Point Identification
• Bullish Trend Starting Point:
▶ When bullish reversal signal occurs after a downtrend
▶ When upward momentum is confirmed by breaking previous high
• Bearish Trend Starting Point:
▶ When bearish reversal signal occurs after an uptrend
▶ When downward momentum is confirmed by breaking below previous low
• Range Breakout Detection:
▶ Potential trend formation signals when breaking upper/lower boundaries in a ranging market
■ Trading Strategy Application
• Trend Following Strategy:
▶ Consider buy entry when bullish reversal signal occurs
▶ Consider sell entry when bearish reversal signal occurs
• Reversal Trading:
▶ Signals occurring at support/resistance levels provide high-probability entry points
▶ Reversal signals in overbought/oversold conditions strengthen trend reversal possibility
• Risk Management:
▶ Consider closing or reducing positions when opposite signals occur
▶ Set precise stop-loss points by combining with key technical levels
─────────────────────────────────────
◆ Advanced Setting Options
■ Tracking Period (N-day) Adjustment
• Short-term Setting: 10-15 days (sensitive signals, quick reaction, suitable for short-term trading)
• Medium-term Setting: 20-30 days (balanced signals, general trend detection, recommended default)
• Long-term Setting: 40-50 days (strong filtering, detects only major trend reversals, suitable for long-term investment)
■ Timeframe Optimization
• Daily Chart: 20-30 day setting (medium-term trend change detection)
• 4-Hour Chart: 30-40 setting (short-term swing trading signals)
• Hourly Chart: 40-50 setting (intraday trend change detection)
• Intraday Chart: 10-20 setting (scalping and short-term trading)
■ Market Type Adjustment
• High Volatility Markets: Higher N values (30-50) to filter noise
• Trending Markets: Medium N values (20-30) to capture only major reversals
• Ranging Markets: Lower N values (10-20) to capture range-bound movements
─────────────────────────────────────
◆ Synergy with Other Indicators
• Moving Averages: Signal strength enhanced when Market Structure Reversal Signals align with key moving average crossovers
• RSI: Market Structure Reversal Signals occurring at overbought/oversold levels increase reversal probability
• Volume Indicators: Market Structure Reversal Signals accompanied by high volume enhance reliability
• Fibonacci Levels: Market Structure Reversal Signals occurring at key Fibonacci levels provide important turning points
• Channel Indicators: Powerful breakout confirmation when price channel upper/lower breakthroughs coincide with Market Structure Reversal Signals
─────────────────────────────────────
◆ Conclusion
52SIGNAL RECIPE Market Structure Reversal Signals objectively identifies structural changes in the market and clearly visualizes potential trend reversal points. Its simple yet powerful approach of detecting directional changes through recent N-day high/low breakouts provides flexibility applicable to various market environments and trading styles. The duplicate signal prevention mechanism and confirmed bar-based signal generation greatly enhance signal quality and reliability. When combined with other technical indicators, synergy effects can be maximized, providing traders with a valuable tool to capture market turning points early.
─────────────────────────────────────
※ Disclaimer: Past performance does not guarantee future results. Always use appropriate risk management strategies.
═══ 52SIGNAL RECIPE Market Structure Reversal Signals ═══
◆ 개요
52SIGNAL RECIPE Market Structure Reversal Signals는 가격 차트의 구조적 변화를 감지하여 잠재적인 추세 반전을 식별하는 기술적 지표입니다. 이 지표는 최근 N일 동안의 고점과 저점을 추적하여 의미 있는 가격 돌파가 발생할 때 명확한 시각적 신호를 제공함으로써, 트레이더가 시장의 방향성 변화를 조기에 포착할 수 있도록 도와줍니다.
─────────────────────────────────────
◆ 주요 특징
• 구조적 반전 탐지: 가격이 최근 N일 고점/저점을 돌파할 때 잠재적 추세 변화 신호 제공
• 중복 신호 방지: 동일한 방향의 신호가 연속으로 반복되지 않도록 필터링
• 직관적인 시각화: 상승/하락 반전 신호를 차트 상에서 색상과 위치로 명확히 구분
• 확정 봉 기반: 봉이 완전히 종료된 후에만 신호 생성하여 신뢰도 향상
• 사용자 정의 설정: 추적 기간을 조정하여 다양한 시장 환경과 타임프레임에 최적화 가능
─────────────────────────────────────
◆ 기술적 기반
■ 시장 구조 분석 원리
• 고점/저점 추적: 지정된 기간 동안의 이전 고점(LH)과 저점(HL) 식별
• 구조적 돌파: 종가가 이전 고점을 상향 돌파하거나 이전 저점을 하향 돌파할 때 구조적 변화로 해석
• 확정 봉 검증: 현재 봉이 완전히 종료된 후에만 신호 생성하여 오신호 최소화
■ 신호 필터링 메커니즘
• 신호 상태 저장: 마지막 생성된 신호의 방향을 추적하여 동일 방향 신호 중복 방지
• 방향성 전환 초점: 반대 방향 신호가 발생할 때까지 동일 방향 신호 억제
• 노이즈 감소: 중요 수준 돌파에만 집중하여 불필요한 신호 제거
─────────────────────────────────────
◆ 실용적 응용
■ 추세 전환점 식별
• 상승 추세 시작점:
▶ 하락 추세 후 상승 반전 신호 발생 시
▶ 이전 고점 돌파로 상승 모멘텀 확인 시
• 하락 추세 시작점:
▶ 상승 추세 후 하락 반전 신호 발생 시
▶ 이전 저점 이탈로 하락 모멘텀 확인 시
• 범위 돌파 감지:
▶ 횡보 시장에서 상/하 경계 돌파 시 잠재적 추세 형성 신호
■ 트레이딩 전략 적용
• 추세 추종 전략:
▶ 상승 반전 신호 발생 시 매수 진입 고려
▶ 하락 반전 신호 발생 시 매도 진입 고려
• 반전 트레이딩:
▶ 지지/저항 수준에서 반전 신호 발생 시 높은 확률의 진입점 제공
▶ 과매수/과매도 상태에서의 반전 신호는 추세 전환 가능성 강화
• 리스크 관리:
▶ 반대 방향 신호 발생 시 포지션 종료 또는 축소 고려
▶ 주요 기술적 수준과 결합하여 정밀한 손절점 설정 가능
─────────────────────────────────────
◆ 고급 설정 옵션
■ 추적 기간(N일) 조정
• 단기 설정: 10-15일 (민감한 신호, 빠른 반응, 단기 트레이딩에 적합)
• 중기 설정: 20-30일 (균형 잡힌 신호, 일반적 추세 감지, 기본 권장)
• 장기 설정: 40-50일 (강한 필터링, 주요 추세 전환만 감지, 장기 투자에 적합)
■ 타임프레임별 최적화
• 일봉 차트: 20-30일 설정 (중기 추세 변화 감지)
• 4시간 차트: 30-40 설정 (단기 스윙 트레이딩 신호)
• 시간봉 차트: 40-50 설정 (일중 추세 변화 감지)
• 일중 차트: 10-20 설정 (스캘핑 및 단기 거래)
■ 시장 유형별 조정
• 변동성 높은 시장: 높은 N값 (30-50) 설정으로 노이즈 필터링
• 추세 시장: 중간 N값 (20-30) 설정으로 주요 반전만 포착
• 횡보 시장: 낮은 N값 (10-20) 설정으로 범위 내 움직임 포착
─────────────────────────────────────
◆ 다른 지표와의 시너지
• 이동평균선: Market Structure Reversal Signals 신호와 주요 이동평균선 교차 지점이 일치할 때 신호 강화
• RSI: 과매수/과매도 수준에서의 Market Structure Reversal Signals 신호는 반전 가능성 높임
• 볼륨 지표: 높은 볼륨과 함께 발생하는 Market Structure Reversal Signals 신호는 신뢰도 향상
• 피보나치 레벨: 주요 피보나치 레벨에서 발생하는 Market Structure Reversal Signals 신호는 중요한 전환점 제공
• 채널 지표: 가격 채널의 상단/하단 돌파와 Market Structure Reversal Signals 신호 일치 시 강력한 돌파 확인
─────────────────────────────────────
◆ 결론
52SIGNAL RECIPE Market Structure Reversal Signals는 시장의 구조적 변화를 객관적으로 식별하여 잠재적인 추세 전환점을 명확하게 시각화합니다. 최근 N일 고점/저점 돌파를 통해 방향성 변화를 감지하는 단순하면서도 강력한 접근 방식은 다양한 시장 환경과 트레이딩 스타일에 적용할 수 있는 유연성을 제공합니다. 중복 신호 방지 메커니즘과 확정 봉 기반 신호 생성은 신호의 품질과 신뢰성을 크게 향상시킵니다. 다른 기술적 지표와 결합하여 사용할 때 시너지 효과를 극대화할 수 있으며, 트레이더에게 시장의 전환점을 조기에 포착할 수 있는 귀중한 도구를 제공합니다.
─────────────────────────────────────
※ 면책 조항: 과거 성과가 미래 결과를 보장하지 않습니다. 항상 적절한 리스크 관리 전략을 사용하세요.