Performance-based Asset Weighting(MTF)**Performance-Based Asset Weighting (MTF/Symbol Free Setting)**
#### Overview
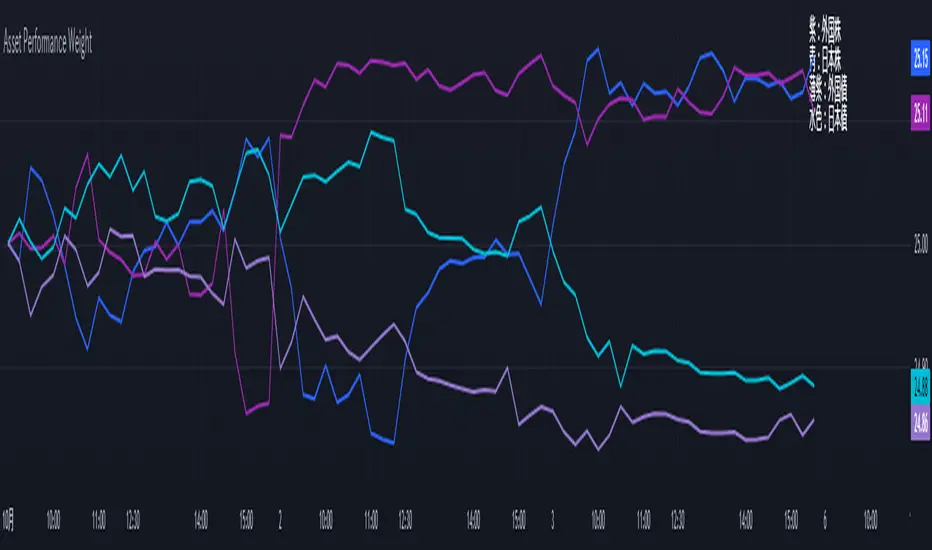
This indicator is a tool that visualizes the relative strength of performance (price change rate) as “weight (allocation ratio)” for **four user-defined stocks**.
By setting any specified past point in time as the baseline (where all symbols are equally weighted at 25%), it aims to provide an intuitive understanding of which symbols outperformed others and attracted capital, or underperformed and saw capital outflows.
**【Default Settings and Application Scenario: Pension Fund Rebalancing Analysis】**
The default settings reference the basic portfolio of Japan's Government Pension Investment Fund (GPIF), configuring four major asset classes: domestic equities, foreign equities, domestic bonds, and foreign bonds. It is known that when market fluctuations cause deviations from this equal-weighted ratio, rebalancing occurs to restore the original ratio (selling assets whose weight has increased and buying assets whose weight has decreased).
Analyzing using this default setting can serve as a reference point for considering **“whether rebalancing sales (or purchases) by pension funds and similar entities are likely to occur in the future.”**
**【Important: Usage Notes】**
The weights shown by this indicator are **theoretical reference values** calculated solely based on performance from the specified start date. Even if large investors conduct significant rebalancing (asset buying/selling) during the period, those transactions themselves are not reflected in this chart's calculations.
Therefore, please understand that the actual portfolio ratios may differ. **Use this solely as a rough guideline. **
#### Key Features
* **Freely configure the 4 assets for analysis:** You can freely set any 4 assets (stocks, indices, currencies, cryptocurrencies, etc.) you wish to compare via the settings screen.
* **Performance-based weight calculation:** Rather than simple price composition ratios, it calculates each asset's price change since the specified start date as a “performance index” and displays each asset's proportion of the total sum.
* **Freely set analysis start date:** You can set any desired starting point for analysis, such as “after the XX shock” or “after earnings announcements,” using the calendar.
* **Multi-Timeframe (MTF) Support:** Independently of the timeframe displayed on the chart, you can freely select the timeframe (e.g., 1-hour, 4-hour, daily) used by the indicator for calculations.
#### Calculation Principle
This indicator calculates weights in the following three steps:
1. **Obtaining the Base Price**
Obtain the closing price for each of the four stocks on the user-set “Start Date for Weight Calculation.” This becomes the **base price** for analysis.
2. **Calculating the Performance Index**
Divide the current price of each stock by the **base price** obtained in Step 1 to calculate the “Performance Index”.
`Performance Index = Current Price ÷ Base Date Price`
This quantifies how many times the current performance has increased compared to the base date performance, which is set to “1”.
3. **Calculating Weights**
Sum the “Performance Indexes” of the four stocks. Then, calculate the percentage contribution of each stock's Performance Index to this total sum and plot it on the chart.
`Weight (%) = (Individual Performance Index ÷ Total Performance Index of 4 Stocks) × 100`
Using this logic, on the analysis start date, all stocks' performance indices are set to “1”, so the weights start equally at 25%.
#### Usage
* **Application Example 1: Market Sentiment Analysis (Using Default Settings)**
Analyze using the default asset classes. By observing the relative strength between “Equities” and “Bonds”, you can assess whether the market is risk-on or risk-off.
* **Application Example 2: Sector/Theme Strength Analysis**
Configure settings for groups like “Top 4 semiconductor stocks” or “4 GAFAM stocks.” Setting the start date to the beginning of the year or earnings season allows you to instantly compare which stocks within the same sector are performing best.
* **Application Example 3: Cryptocurrency Power Map Analysis**
By setting major cryptocurrencies like “BTC, ETH, SOL, ADA,” you can analyze which currencies are attracting market capital.
**【About Legend Display】**
Due to Pine Script specification constraints, the legend on the chart will display fixed names: **“Stock 1” to “Stock 4”. **
Please note that the symbol you entered for “Symbol 1” in the settings corresponds to the “Symbol 1” line on the chart.
#### Settings
* **Symbol 1 to Symbol 4:** Set the four symbols you wish to analyze.
* **Timeframe for Calculation:** Select the timeframe the indicator references when calculating weights.
* **Start Date for Weight Calculation:** This serves as the base date for comparing performance.
#### Disclaimer
This script is solely a tool to assist with market analysis and does not recommend buying or selling any specific financial instruments. Please make all final investment decisions at your own discretion.
-------------------------------------------------------------------------------------------------------------------
**Performance-based Asset Weighting(MTF・シンボル自由設定)**
#### 概要
このインジケーターは、**ユーザーが自由に設定した4つの銘柄**について、パフォーマンス(騰落率)の相対的な強さを「ウェイト(構成比率)」として可視化するツールです。
指定した過去の任意の時点を基準(全銘柄が均等な25%)として、そこからどの銘柄のパフォーマンスが他の銘柄を上回り、資金が向かっているのか、あるいは下回っているのかを直感的に把握することを目的としています。
**【デフォルト設定と活用シナリオ:年金基金のリバランス考察】**
デフォルト設定では、日本の年金積立金管理運用独立行政法人(GPIF)の基本ポートフォリオを参考に、主要4資産クラス(国内株式, 外国株式, 国内債券, 外国債券)が設定されています。市場の変動によってこの均等な比率に乖離が生じると、元の比率に戻すためのリバランス(比率が増えた資産を売り、減った資産を買う)が行われることが知られています。
このデフォルト設定で分析することで、**「今後、年金基金などによるリバランスの売り(買い)が発生する可能性があるか」を考察するための、一つの目安として利用できます。**
**【重要:利用上の注意点】**
このインジケーターが示すウェイトは、あくまで指定した開始日からのパフォーマンスのみを基に算出した**理論上の参考値**です。実際に大口投資家などが途中で大規模なリバランス(資産の売買)を行ったとしても、その取引自体はこのチャートの計算には反映されません。
そのため、実際のポートフォリオ比率とは異なる可能性があることをご理解の上、**あくまで大まかな目安としてご活用ください。**
#### 主な特徴
* **分析対象の4銘柄を自由に設定可能:** 設定画面から、比較したい4つの銘柄(株式、指数、為替、仮想通貨など)を自由に設定できます。
* **パフォーマンス基準のウェイト計算:** 単純な価格の構成比ではなく、指定した開始日からの各銘柄の騰落を「パフォーマンス指数」として算出し、その合計に占める各銘柄の割合を表示します。
* **分析開始日の自由な設定:** 「〇〇ショック後」「決算発表後」など、分析したい任意の時点をカレンダーから設定できます。
* **マルチタイムフレーム(MTF)対応:** チャートに表示している時間足とは別に、インジケーターが計算に使う時間足(1時間足、4時間足、日足など)を自由に選択できます。
#### 計算の原理
このインジケーターは、以下の3ステップでウェイトを算出しています。
1. **基準価格の取得**
ユーザーが設定した「ウェイト計算の開始日」における、4つの各銘柄の終値を取得し、これを分析の**基準価格**とします。
2. **パフォーマンス指数の算出**
現在の各銘柄の価格を、ステップ1で取得した**基準価格**で割ることで、「パフォーマンス指数」を算出します。
`パフォーマンス指数 = 現在の価格 ÷ 基準日の価格`
これにより、基準日のパフォーマンスを「1」とした場合、現在のパフォーマンスが何倍になっているかが数値化されます。
3. **ウェイトの算出**
4つの銘柄の「パフォーマンス指数」の合計値を算出します。そして、合計値に占める各銘柄のパフォーマンス指数の割合(%)を計算し、チャートに描画します。
`ウェイト (%) = (個別のパフォーマンス指数 ÷ 4銘柄のパフォーマンス指数の合計) × 100`
このロジックにより、分析開始日には全銘柄のパフォーマンス指数が「1」となるため、ウェイトは均等に25%からスタートします。
#### 使用方法
* **応用例1:市場のセンチメント分析(デフォルト設定利用)**
デフォルト設定の資産クラスで分析し、「株式」と「債券」の力関係を見ることで、市場がリスクオンなのかリスクオフなのかを判断する材料になります。
* **応用例2:セクター・テーマ別の強弱分析**
設定画面で、例えば「半導体関連の主要4銘柄」や「GAFAMの4銘柄」などを設定します。開始日を年初や決算時期に設定することで、同セクター内でどの銘柄が最もパフォーマンスが良いかを一目で比較できます。
* **応用例3:仮想通貨の勢力図分析**
「BTC, ETH, SOL, ADA」など、主要な仮想通貨を設定することで、市場の資金がどの通貨に向かっているのかを分析できます。
**【凡例の表示について】**
Pine Scriptの仕様上の制約により、チャート上の凡例は**「銘柄1」〜「銘柄4」という固定名で表示されます。**
お手数ですが、設定画面でご自身が「銘柄1」に入力したシンボルが、チャート上の「銘柄1」のラインに対応する、という形でご覧ください。
#### 設定項目
* **銘柄1〜銘柄4:** 分析したい4つのシンボルをそれぞれ設定します。
* **計算に使う時間足:** インジケーターがウェイトを計算する際に参照する時間足を選択します。
* **ウェイト計算の開始日:** パフォーマンスを比較する上での基準日となります。
#### 免責事項
このスクリプトはあくまで市場分析を補助するためのツールであり、特定の金融商品の売買を推奨するものではありません。投資の最終的な判断は、ご自身の責任において行ってください。
Search in scripts for "mtf"
Combo RSI + MACD + ADX MTF (Avec Alertes)✅ Recommended Title:
Multi-Signal Oscillator: ADX Trend + DI + RSI + MACD (MTF, Cross Alerts)
✅ Detailed Description
📝 Overview
This indicator combines advanced technical analysis tools to identify trend direction, capture reversals, and filter false signals.
It includes:
ADX (Multi-TimeFrame) for trend and trend strength detection.
DI+ / DI- for directional bias.
RSI + ZLSMA for oscillation analysis and divergence detection.
Zero-Lag Normalized MACD for momentum and entry timing.
⚙️ Visual Components
✅ Green/Red Background: Displays overall trend based on Multi-TimeFrame ADX.
✅ DI+ / DI- Lines: Green and red curves showing directional bias.
✅ Normalized RSI: Blue oscillator with orange ZLSMA smoothing.
✅ Zero-Lag MACD: Violet or fuchsia/orange oscillator depending on the version.
✅ Crossover Points: Colored circles marking buy and sell signals.
✅ ADX Strength Dots: Small black dots when ADX exceeds the strength threshold.
🚨 Included Alert System
✅ RSI / ZLSMA Crossovers (Buy / Sell).
✅ MACD / Signal Line Crossovers (Buy / Sell).
✅ DI+ / DI- Crossovers (Buy / Sell).
✅ Double Confirmation DI+ / RSI or DI+ / MACD.
✅ Double Confirmation DI- / RSI or DI- / MACD.
✅ Trend Change Alerts via Background Color.
✅ ADX Strength Alerts (Above Threshold).
🛠️ Suggested Configuration Examples
1. Short-Term Reversal Detection:
RSI Length: 7 to 14
ZLSMA Length: 7 to 14
MACD Fast/Slow: 5 / 13
ADX MTF Period: 5 to 15
ADX Threshold: 15 to 20
2. Long-Term Trend Following:
RSI Length: 21 to 30
ZLSMA Length: 21 to 30
MACD Fast/Slow: 12 / 26
ADX MTF Period: 30 to 50
ADX Threshold: 20 to 25
3. Scalping / Day Trading:
RSI Length: 5 to 9
ZLSMA Length: 5 to 9
MACD Fast/Slow: 3 / 7
ADX MTF Period: 5 to 10
ADX Threshold: 10 to 15
🎯 Why Use This Tool?
Filters false signals using ADX-based background coloring.
Provides multi-source alerting (RSI, MACD, ADX).
Helps identify true market strength zones.
Works on all markets: Forex, Crypto, Stocks, Indices.

Context MTF [Th16rry]Context MTF
A multi-timeframe trend context indicator that overlays an Exponential Moving Average (EMA) and a Weighted Moving Average (WMA) whose look-back periods adapt automatically to your chart’s timeframe. Inspired by Mike Bellafore and Brian Shannon (Multi timeframe analysis)
🔍 Overview
Context MTF helps you quickly gauge the prevailing trend and its strength by plotting two complementary moving averages in a single view:
* EMA (solid line) for smooth, responsive trend direction
* WMA (dotted line) for emphasis on recent price action
By automatically selecting period lengths that reflect meaningful market cycles, Context MTF provides intuitive context at a glance:
| Timeframe | Period | Market Cycle Represented |
| :--------: | :----: | :----------------------: |
| Daily (D) | 63 | Quarterly trend |
| Weekly (W) | 52 | Yearly trend |
| 1H (60) | 126 | Monthly trend |
| 15m (15) | 130 | Weekly trend |
| 5m (5) | 78 | Last 24 hours |
⚙️ How It Works
1. Automatic Period Selection
The script detects your chart’s timeframe and applies the appropriate look-back for both EMA and WMA.
2. Solid vs. Dotted
* EMA is drawn as a continuous solid line.
* WMA is rendered as a dotted line of the same color, highlighting short-term momentum within the broader trend.
3. Visual Trend Context
* Widening Gap : Indicates strengthening trend momentum.
* Convergence/Overlap : Suggests a market in consolidation or range.
🎯 Benefits
* Multi-Timeframe Context in a single pane—no need to switch charts.
* Instant trend strength assessment by comparing EMA vs. WMA divergence.
* Clear identification of range conditions when averages align.
* Fully automated period adjustment —set and forget.
⚙️ Settings
* Color : Shared color for both lines (default blue).
* Line Width : Adjustable via script inputs (default 2).
* Dotted WMA : Simulated using built-in dotted line styling for precise rendering.
Use Context MTF to enhance trend-based strategies, confirm breakout momentum, or filter ranging markets. Ideal for swing traders, day traders, and anyone who values clear, time-aligned trend information on every timeframe.
SMC Entry Signals MTF v2📘 User Guide for the SMC Entry Signals MTF v2 Indicator
🎯 Purpose of the Indicator
This indicator is designed to identify reversal entry points based on Smart Money Concepts (SMC) and candlestick confirmation. It’s especially useful for traders who use:
Imbalance zones, order blocks, breaker blocks
Liquidity grabs
Multi-timeframe confirmation (MTF)
📈 How to Use the Signals on the Chart
✅ LONG Signal (green triangle below the candle):
Conditions:
Price is in a discount zone (below the FIB 50% level)
A bullish engulfing candle appears
A bullish Order Block (OB) or Breaker Block is detected
There’s an upward imbalance
A bullish OB is confirmed on the higher timeframe
➡️ How to act:
Consider entering long on the current or next candle.
Place your stop-loss below the OB or the nearest swing low.
Take profit at the nearest liquidity zone or premium area (above FIB 50%).
🔻 SHORT Signal (red triangle above the candle):
Conditions:
Price is in a premium zone (above FIB 50%)
A bearish engulfing candle appears
A bearish OB or Breaker Block is detected
There’s a downward imbalance
A bearish OB is confirmed on the higher timeframe
➡️ How to act:
Consider short entry after the signal.
Place your stop-loss above the OB or swing high.
Target the discount zone or the next liquidity pocket.
⚙️ Recommended Settings by Trading Style
Trading Style Suggested Settings Notes
Intraday (1–15m) fibLookback = 20–50, obLookback = 5–10, htf_tf = 1H/4H Fast signals. Use Discount/Premium + Engulfing.
Swing/Position (1H–1D) fibLookback = 50–100, obLookback = 10–20, htf_tf = 1D/1W Higher trust in MTF confirmation. Ideal with fundamentals.
Scalping (1m) fibLookback = 10–20, obLookback = 3–5, htf_tf = 15m/1H Remove Breaker and MTF for quick reaction trades.
🧠 Best Practices for Traders
Trend Filtering:
Use EMAs or volume to confirm the current trend.
Take longs only in uptrends, shorts in downtrends.
Liquidity Zones:
Use this indicator after liquidity grabs.
OBs and Breakers often appear right after stop hunts.
Combine with Manual Zones:
This works best when paired with manually drawn OBs and key levels.
Backtest the Signals:
Use Bar Replay mode on TradingView to test past signals.
🧪 Example Trade Setup
Example on BTCUSDT 15m:
Price drops into the discount zone.
A green triangle appears (bullish engulfing + OB + imbalance + HTF OB).
You enter long, stop below the OB, target the premium zone.
🎯 This type of setup often gives a risk/reward ratio of 1:2 or better — profitable even with a 40% win rate.
⏰ Alerts & Automation
Enable alerts:
"SMC Long Entry" — fires when a long signal appears.
"SMC Short Entry" — fires when a short signal appears.
You can integrate this with bots via webhook, like:
TradingConnector, 3Commas, Alertatron, etc.
✅ What This Indicator Gives You
High-probability entries using SMC logic
Customizable filters for entry logic
Multi-timeframe confirmation for stronger setups
Suitable for both intraday and swing trading

Demand and Supply MTF with SMC By StockFusion - 3.0Demand and Supply MTF with SMC By StockFusion - 3.0 - Indicator Description
Concepts
What is Supply & Demand?
Supply and Demand are foundational forces driving market dynamics. Demand reflects the presence of buyers willing to purchase a security, while Supply indicates sellers offering it for sale. These forces create zones on the chart where price tends to react—either reversing or continuing—based on the balance between buying and selling pressure. This indicator identifies these zones using price action patterns, focusing on impulsive moves (strong directional momentum) and retracement phases (consolidation or pullbacks).
What is SMC (Smart Money Concepts)?
Smart Money Concepts (SMC) revolve around tracking the behavior of institutional traders, often called "smart money." By analyzing price action, market structure shifts, and liquidity, SMC helps retail traders align with the moves of larger players. Key SMC signals like Change of Character (CHoCH), Break of Structure (BOS), liquidity sweeps, and swing points provide insights into potential trend changes or continuations.
Overview
Demand and Supply MTF with SMC By StockFusion - 3.0 is a sophisticated, price action-based indicator designed to plot real-time Supply and Demand zones across multiple timeframes (MTF) directly on your chart. It goes beyond simple zone plotting by integrating Smart Money Concepts (SMC) and Inside Candle detection, offering traders a powerful tool for spotting high-probability reversal or continuation areas. The indicator highlights zones with customizable boxes, labels them for clarity, and provides additional SMC-driven insights such as CHoCH, BOS, liquidity sweeps, and swing high/low levels. This combination of multi-timeframe analysis, SMC, and consolidation detection creates a unique and highly practical tool for traders seeking an edge in the markets.
How It Works
The indicator operates by analyzing price action across two user-defined timeframes (Higher TF and Lower TF) to detect Supply and Demand zones. It identifies these zones based on specific price patterns:
Rally Base Rally (RBR): A bullish impulsive move, followed by consolidation, then another bullish move—indicating a Demand zone.
Drop Base Drop (DBD): A bearish impulsive move, consolidation, then another bearish move—indicating a Supply zone.
Drop Base Rally (DBR): A bearish move, consolidation, then a bullish reversal—indicating a Demand zone.
Rally Base Drop (RBD): A bullish move, consolidation, then a bearish reversal—indicating a Supply zone.
These patterns are detected using criteria like explosive candle movements (based on range-to-body ratios and ATR multipliers), volume thresholds, and base candle counts (configurable from 1 to 5 candles). Zones are plotted as horizontal bands, with Higher TF zones taking precedence to avoid overlap with Lower TF zones, ensuring clarity on the chart.
Smart Money Integration:
The indicator enhances zone analysis with SMC features:
CHoCH (Change of Character): Detects shifts in market sentiment by comparing price action against recent swing highs/lows over a customizable period.
BOS (Break of Structure): Identifies when price breaks key structural levels, signaling a potential trend shift.
Liquidity Sweeps: Marks areas where price briefly exceeds swing points before reversing, often targeting stop-loss orders.
Swings: Highlights significant swing highs and lows to track momentum and structure.
Inside Candle Detection:
Inside Candles—smaller candles contained within the range of a prior candle—are plotted to indicate consolidation or indecision, often preceding breakouts. Optional lines can be drawn around these candles for better visibility.
Key Features & How to Use
Real-Time Zone Plotting:
Automatically identifies and marks Supply and Demand zones as they form, using the RBR, RBD, DBR, and DBD patterns. Zones are color-coded (e.g., green for Demand, red for Supply) and can extend rightward for visibility.
Multi-Timeframe Analysis:
Operates on all timeframes, with separate settings for Higher TF (e.g., weekly) and Lower TF (e.g., daily) zones. This allows traders to see both macro and micro levels of market structure.
Automatic Detection:
No manual input is required—zones are plotted based on price action, volume, and SMA trends. Live candle volume is displayed for context.
Tested Zone Management:
Optionally removes zones after they’re tested (price revisits and reverses) or after a second leg-out move, keeping the chart uncluttered.
Customizable Display:
Choose which patterns to detect (RBR, RBD, etc.).
Adjust base candle counts (1-5), explosive candle parameters (Range-Body Ratio, Multiplier), and quality filters (SMA length, Volume Multiplier).
Customize colors for zones, borders, labels, and candles (boring, bullish explosive, bearish explosive).
Enable/disable labels and pattern names on boxes.
Alerts:
Set notifications for zone formation, CHoCH, BOS, and liquidity sweeps on your chosen timeframe.
Inside Candle Visualization:
Highlights consolidation phases with color-coded candles and optional lines, aiding breakout anticipation.
SMC Insights:
Visualizes CHoCH, BOS, liquidity sweeps, and swings with distinct lines and labels, helping traders follow institutional moves.
How to Use It:
Approaching Zones: When price nears a Supply or Demand zone, watch for reversal patterns (e.g., pin bars, engulfing candles) or SMC signals (e.g., BOS, liquidity sweeps) to confirm entries. Combine with your tested strategy—don’t trade zones blindly.
SMC Signals: Use CHoCH for early trend reversal clues, BOS for trend continuation, and liquidity sweeps to gauge manipulation.
Inside Candles: Monitor for breakouts after consolidation periods marked by Inside Candles.
Why It’s Unique & Valuable
This indicator stands out by blending multi-timeframe Supply and Demand analysis with Smart Money Concepts and Inside Candle detection into a single, cohesive tool. While it uses classic elements like price action and volume, its proprietary logic—combining specific pattern detection (RBR, RBD, DBR, DBD), SMC signals (CHoCH, BOS, etc.), and consolidation tracking—offers a fresh approach. Unlike generic trend-following or scalping tools, it provides actionable insights into market structure and institutional behavior, making it worth considering for traders willing to invest in a premium tool. The flexibility of customization and MTF functionality further enhances its utility across trading styles, from scalping to swing trading.

Austin MTF EMA Entry PointsAustin MTF EMA Entry Points
Overview
The Austin MTF EMA Entry Points is a custom TradingView indicator designed to assist traders in identifying high-probability entry points by combining multiple time frame (MTF) analysis. It leverages exponential moving averages (EMAs) from the daily, 1-hour, and 15-minute charts to generate buy and sell signals that align with the overall trend.
This indicator is ideal for traders who:
Want to trade in the direction of the broader daily trend.
Seek precise entry points on lower time frames (1H and 15M).
Prefer using EMAs as their main trend-following tool.
How It Works
Daily Trend Filter:
The indicator calculates the 50 EMA on the daily chart.
The daily EMA acts as the primary trend filter:
If the current price is above the daily 50 EMA, the trend is bullish.
If the current price is below the daily 50 EMA, the trend is bearish.
Lower Time Frame Entry Points:
The indicator calculates the 20 EMA on both the 1-hour (1H) and 15-minute (15M) time frames.
Buy and sell signals are generated when the price aligns with the trend on all three time frames:
Buy Signal: Price is above the daily 50 EMA and also above the 20 EMA on both the 1H and 15M charts.
Sell Signal: Price is below the daily 50 EMA and also below the 20 EMA on both the 1H and 15M charts.
Visual and Alert Features:
Plot Lines:
The daily 50 EMA is plotted in yellow for easy identification of the main trend.
The 20 EMA from the 1H chart is plotted in blue, and the 15M chart's EMA is in purple for comparison.
Buy/Sell Markers:
Green "Up" arrows appear for buy signals.
Red "Down" arrows appear for sell signals.
Alerts:
Alerts notify users when a buy or sell signal is triggered, making it easier to act on trading opportunities in real-time.
How to Use the Indicator
Identify the Main Trend:
Check the relationship between the price and the daily 50 EMA (yellow line):
Only look for buy signals if the price is above the daily 50 EMA.
Only look for sell signals if the price is below the daily 50 EMA.
Wait for Lower Time Frame Alignment:
For a valid signal, ensure that the price is also above or below the 20 EMA (blue and purple lines) on both the 1H and 15M time frames:
This alignment confirms short-term momentum in the same direction as the daily trend.
Act on Signals:
Use the arrows as visual cues for entry points:
Enter long trades on green "Up" arrows.
Enter short trades on red "Down" arrows.
The alerts will notify you of these signals, so you don’t have to monitor the chart constantly.
Exit Strategy:
Use your preferred stop-loss, take-profit, or trailing stop strategy.
You can also exit trades if the price crosses back below/above the daily 50 EMA, signaling a potential reversal.
Use Cases
Swing Traders: Use the daily trend filter to trade in the direction of the dominant trend, while using 1H and 15M signals to fine-tune entries.
Day Traders: Leverage the 1H and 15M time frames to capitalize on short-term momentum while respecting the broader daily trend.
Position Traders: Monitor the indicator to determine potential reversals or significant alignment across time frames.
Customizable Inputs
The indicator includes the following inputs:
Daily EMA Length: Default is 50. Adjust this to change the length of the trend filter EMA.
Lower Time Frame EMA Length: Default is 20. Adjust this to change the short-term EMA for the 1H and 15M charts.
Time Frames: Hardcoded to "D", "60", and "15", but you can modify the script for different time frames if needed.
Example Scenarios
Buy Signal:
Price is above the daily 50 EMA.
Price crosses above the 20 EMA on both the 1H and 15M time frames.
A green "Up" arrow is displayed, and an alert is triggered.
Sell Signal:
Price is below the daily 50 EMA.
Price crosses below the 20 EMA on both the 1H and 15M time frames.
A red "Down" arrow is displayed, and an alert is triggered.
Strengths and Limitations
Strengths:
Aligns trades with the higher time frame trend for increased probability.
Uses multiple time frame analysis to identify precise entry points.
Visual signals and alerts make it easy to use in real-time.
Limitations:
May produce fewer signals in choppy or ranging markets.
Requires discipline to avoid overtrading when conditions are unclear.
Lag in EMAs could result in late entries in fast-moving markets.
Final Notes
The Austin MTF EMA Entry Points indicator is a powerful tool for traders who value multiple time frame alignment and trend-following strategies. While it simplifies decision-making, it is always recommended to backtest and practice proper risk management before using it in live markets.
Try it out and make smarter, trend-aligned trades today! 🚀

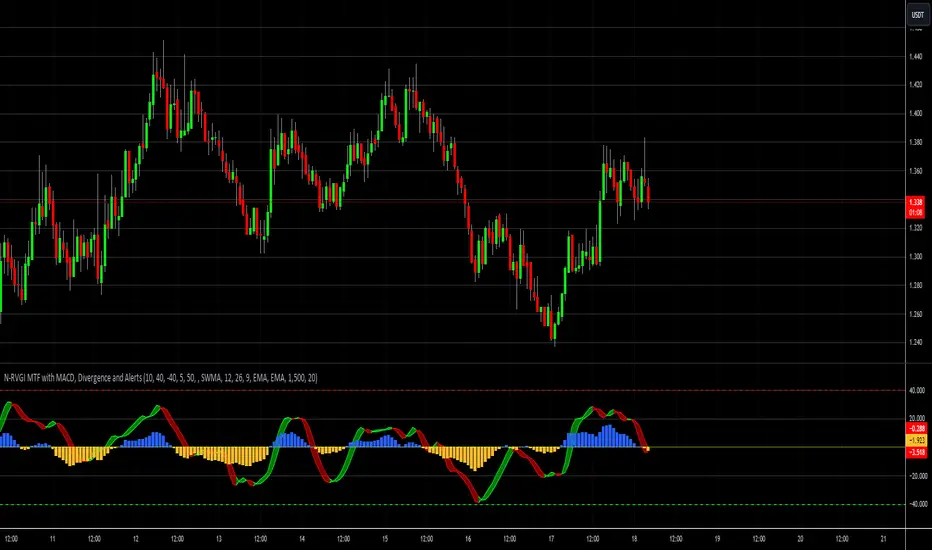
Relative Vigor Index [MTF] with MACD, Divergence and AlertsThis advanced indicator integrates the Normalized Relative Vigor Index (RVGI) with Multi-Timeframe (MTF) analysis, MACD, divergence detection, and customizable alert features. It provides a comprehensive toolkit for traders to analyze market momentum, identify trend changes, and react to significant technical signals.
Key Features:
Normalized Relative Vigor Index (RVGI):
Calculation: Computes the RVGI and its signal line using various smoothing methods (SWMA, EMA, SMA). The RVGI measures the strength of price movement relative to its historical volatility, providing insights into market momentum.
Plotting: Visualizes the RVGI and signal line on the chart. Users can customize the colors and transparency of the plots and the ribbon that fills the area between them.
Overbought/Oversold Levels: Displays horizontal lines to mark overbought and oversold zones, helping to identify potential reversal points.
Multi-Timeframe (MTF) Analysis:
Timeframe Selection: Allows users to select different timeframes for RVGI analysis, providing a broader perspective on market trends and signals.
Integration: Combines MTF data with the main indicator calculations to offer a more comprehensive view of market conditions.
MACD Integration:
Calculation: Computes MACD, MACD signal line, and MACD histogram with options for different moving average types (SMA, EMA) and a customizable scaling factor.
Plotting: Plots the MACD histogram, zero line, and signal line, with color and transparency settings to distinguish between positive and negative values.
Divergence Detection:
Bullish Divergence: Identifies and plots bullish divergence when the price makes a lower low while the RVGI makes a higher low, suggesting potential upward reversals.
Bearish Divergence: Identifies and plots bearish divergence when the price makes a higher high while the RVGI makes a lower high, indicating potential downward reversals.
Alerts:
Divergence Alerts: Configurable alerts for bullish and bearish divergences, notifying traders of significant potential reversals.
RVGI Alerts: Alerts for RVGI crossovers, overbought/oversold conditions, and trend changes based on RVGI and signal line crossovers.
MACD Alerts: Alerts for MACD line crossovers, histogram crossovers, and MACD zero line crossovers, helping traders stay informed of key MACD signals.
Customization Options:
Ribbon Colors and Transparency: Users can adjust the colors and transparency of the RVGI ribbon, enhancing visual clarity.
MACD Histogram Colors and Transparency: Customizable colors and transparency settings for the MACD histogram improve visibility and differentiation of positive and negative values.
Smoothing Methods: Choose between different smoothing methods for RVGI, tailoring the indicator to specific trading strategies.
Use Cases:
Trend Analysis: Utilize RVGI and MACD signals to analyze market trends, identify potential trend reversals, and assess momentum.
Divergence Identification: Detect and act on divergences between price and RVGI to spot potential trading opportunities.
Alert Management: Customize and receive alerts based on various conditions, ensuring timely responses to market signals.
Conclusion:
This indicator is designed for traders who seek a comprehensive tool combining momentum analysis, divergence detection, and signal alerts. By integrating RVGI, MACD, and MTF analysis, it provides a powerful suite of features to enhance market analysis and trading decisions
Momentum Trend Fusion (MTF)The Momentum Trend Fusion (MTF) is a composite indicator that combines the Awesome Oscillator and the Relative Strength Index to provide a unique perspective on market momentum and trend strength. The MTF is calculated by first running the Relative Strength Index (RSI) on the Awesome Oscillator (AO) and then applying an Exponential Moving Average (EMA) on the RSI value. The MTF is designed to help traders detect market phases and confirm trend direction by analyzing the cross of the EMA and RSI, as well as divergences between the AO and price. The MTF can be customized by the user by providing the lengths of the RSI and EMA calculations, making it an ideal tool for traders with different time frames and risk tolerances.

REDWOOD MTF Stochastic RSI
This MTF Stochastic RSI is custom made to help give you an edge while trading.
As you see the MTF Stochastic RSI is colored depending on the trend and if "K" is above or below "D".
This indicator shows the crossover or crossunder of these values with the colored circles that
are plotted. This can be a very useful indicator to show you Oversold or Overbought areas of an
asset, giving you ideas of when to take profit or enter a new trade.
For more information on Stochastic RSI in general (for reference) Please see the detailed
description here : www.investopedia.com(StochRSI)%20is,than%20to%20standard%20price%20data.
This Stochastic RSI is a Multi Time frame Stochastic, meaning it can show you higher or lower
timeframes of the Stochastic RSI no matter what current time frame your chart is on. This is
applied in the settings of the indicator by default, with a default timeframe of 1hr.
You can easily change back to the current time frame by checking the box "Use current Timeframe?".
This can be very useful to get into a trend early, entering or exiting on low time frame bars while
seeing the live Long time frame Stoch RSI.
All inputs of K, D, RSIlength, Stochlength, Overbought and Oversold areas can be customized to
your liking. By default these run on the recommended Stoch RSI settings and values on tradingview
with overbought and oversold areas at 80 & 20.
There are inputs that will color the bars depending on if the Stoch is showing Overbought(red) or
Oversold(lime) regions, and a separate color setting that colors bars with the color of the Stoch
itself, showing when K is over D and vise versa.
For trading with this indicator, it works very well with a indicator confirming the position or
potential change that is happening, I recommend the MacD. Specifically, the REDWOOD MTF MacD.
When K crosses D and is showing the Stoch green or lime, this is when to take a Long or buy
position.
When D crosses K and is showing the Stoch red, this is when to take a short or sell position.
To filter out false crosses or trades, this is where I recommend the MacD, taking trades on the
Stoch when the MacD is showing signs of a reversal or crosses itself. These provide the strongest
signals and buy and sell positions.
This is recommended as a swing indicator, but can be used for scalping at your own risk.
As for recommended time frames to use for the MTF settings, I would stick to longer timeframes to
show the overall trend. With that being said, it can be used on shorter timeframes as well and
works good. I would sick to the 1hr or 4hr timeframes, and for lower I recommend the 15min or
30min timeframes. The lower you go the more signals will be provided, but with that lots more
false signals will show as well if the asset is volatile.
All settings, colors, and plots can be customized, and all are labeled to make it easy for you.
Alerts for each setting will be added in the future for simplicity, as of now the alerts can be
made as usual, having the indicator plot K crossing the indicator plot D, telling you of a change
in the Stoch.
This can be a very useful indicator, and I'm sure some may find settings that work even better
than the default or recommended settings.
This indicator works on all markets, forex, cryptocurrency, and stocks.
For access to this and all indicators available, please DM me here or See profile. We are here
to help each other succeed! The more one succeeds the more we all succeed! We are all in this
together and every person deserves to be financially independent and confident when taking trades
and investing.

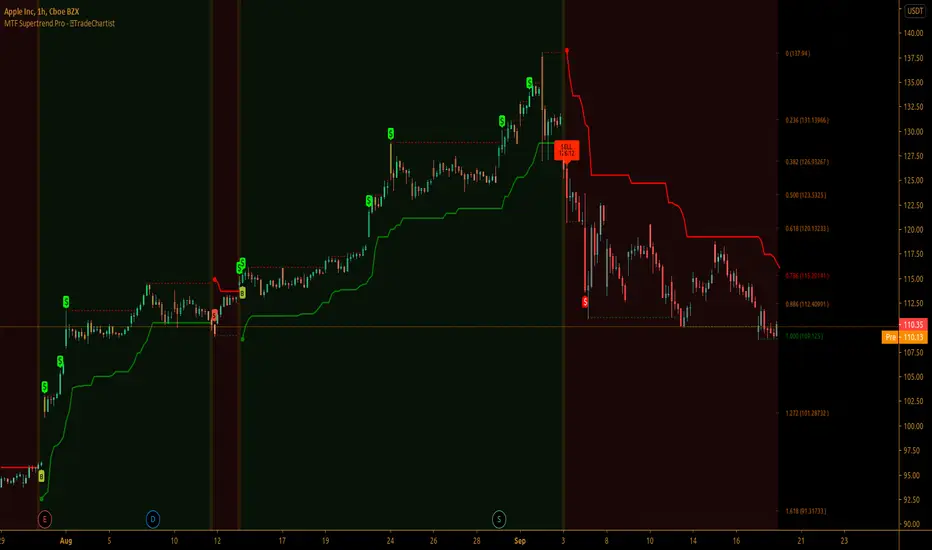
TradeChartist MTF Supertrend Pro™TradeChartist MTF SuperTrend Pro is the Multi Time-Frame version (using timeframe multiplier) of classic Volatility Stop or SuperTrend (Stop and Reverse indicator using multiple of Average True Range of lookback period trailing behind the price acting as both trend reversal signifier and StopLoss trigger at the same time ).
What does ™TradeChartist MTF SuperTrend Pro include?
Multi Time-Frame option using Time-Frame Multiplier to plot Higher Time Frame SuperTrend plot on Lower Time-Frame chart.
Auto-fibs - 2 types (1. Retracement from last significant high/low to previous significant low/high, 2. Retracement from Current High/Low to previous significant Low/High).
Trend identifying color bars.
Trend identifying Background colour.
Option to detect bars where Profit Taking is recommended using $ sign.
How to create Alerts for ™TradeChartist MTF SuperTrend Pro Long and Short Entries?
Alerts can be created for Long or Short entries using Once Per Bar as BUY and SELL labels appear with entries only on confirmation after bar close.
Does the indicator include Stop Loss and Take Profit plots?
This script doesn't have Stop Loss and Take Profit plots, but it can be connected to TradeChartist Plug and Trade as Non-Oscillatory signal to generate Automatic Targets, user set StopLoss and Take Profit plots and to create all types of alerts too.
Does this indicator repaint?
No. This script doesn't repaint as it confirms its signals only after close above/below SuperTrend plot and also uses security function to call higher time-frame values in the right way to avoid repainting. This can be verified using Bar Replay to check if the plots and fills stay in the same bar in real time as the Bar Replay.
===================================================================================================================
Tip 1: Using 1.618 as Timeframe Multiplier results in lucrative trades on most timeframes with ATR multiplier 1.618, 2.618 or 3.618. (Best Practice: Test with various values first on asset using Paper Trades before trading with real money)
Tip 2: Using bars, candles with no borders or Hollow Candles results in clear trend spotting with Bar color option enabled in settings.
===================================================================================================================
Chart below shows Performance of MTF SuperTrend Pro connected to Plug and Trade using Default settings.
===================================================================================================================
This is not a free to use indicator. Get in touch with me (PM me directly if you would like trial access to test the indicator)
Premium Scripts - Trial access and Information
Trial access offered on all Premium scripts.
PM me directly to request trial access to the scripts or for more information.
===================================================================================================================
WaveTrend mtfThis is based on Lazy Bear famous script of Wave trend
So in basic we do MTF on it
One can choose to use the signal of the MTF (circles red or green for buy and sell)
or the regular buy and sell by cross green /red
to the script one can add if it cross the 0 above or bellow (not done here)
the MTF is taken from pinescripter example how to avoid repainting , so it good also for using your indicator to make MTF scripts
alerts included

lazy weis MTFSo here was my problem and the way we fix it . We all know lazy bear weis model of volume . if we make it to MTF then we use security and it will repaint all over . since its hard to convert it to version 3 in order to fix the problem ,then it was impossible so far to make it a good MTF model.
By changing the length to time function we do not need to use the security and by this we can create an MTF model with no repaint ( i hope).
Now in setting you see int2 (now its on 60 min) , this you can change to any min value that you want. TV will consider it as length and not as time and by this way you can manipulate it to be an MTF model of your choosing . The int1 is minimum min always need to be smaller then int2
lets say you want 5 min chart and on 10 min time frame. so set it as int1=1 and int=15. if you want 45 min frame on the 5 min so set int 2 to 45
if you want it to be daily just set it to 1440 ,
I hope you like this solution
Unmitigated High Low (Day/MTF)
# Unmitigated High Low (Day/MTF)
## Overview
The **Unmitigated High Low (Day/MTF)** indicator tracks previous timeframe highs and lows that remain "unmitigated" (untouched by price) and displays them as dynamic support and resistance levels. By default, the indicator monitors daily highs and lows, making it ideal for intraday traders seeking key institutional levels, though it supports any multi-timeframe (MTF) interval. The indicator extends horizontal lines from each level until price touches them, creating visual "zones of interest" where price action may react.
## What It Does
This indicator identifies and plots two types of levels on your chart:
- **High Levels** (yellow lines) - Previous timeframe highs that price has not yet reached or exceeded
- **Low Levels** (cyan lines) - Previous timeframe lows that price has not yet broken below
Each time a new timeframe period completes (e.g., daily candle closes), the indicator captures that period's high and low and extends them forward as horizontal reference lines. When price finally touches or crosses these levels, they become "mitigated" - the line stops extending, becomes transparent (60% opacity), and is marked as historical.
## Key Features
**Multi-Timeframe Capability**: While defaulting to daily ("D") timeframe, you can switch to any interval (15-minute, 4-hour, weekly, etc.) to match your trading style.
**Band Visualization**: The indicator creates colored bands between the two most recent active levels in each direction - an upper band (purple fill) between the 1st and 2nd unmitigated highs, and a lower band (cyan fill) between the 1st and 2nd unmitigated lows.
**Visual Clarity**: Active unmitigated levels display in full color with customizable line width (default: 2), while mitigated levels fade to 60% transparency, helping you distinguish between current zones and historical references.
## How to Use It
Add the indicator to your chart and observe where unmitigated levels cluster - these zones often act as magnets for institutional order flow. The most recent unmitigated high represents overhead supply/resistance, while the most recent unmitigated low represents underlying demand/support. Traders commonly use these levels for:
- Entry zones when price approaches unmitigated levels with confluent signals
- Stop-loss placement beyond unmitigated levels to avoid institutional sweeps
- Profit targets at the next unmitigated level in the direction of your trade
- Breakout confirmation when price finally mitigates a long-standing level
The colored bands between the 1st and 2nd levels highlight "zones of friction" where price may consolidate or reverse before continuing its trend.
## Settings
**HL interval**: Select your desired timeframe (default: "D" for daily)
**High Line Color**: Color for unmitigated high levels (default: yellow #fff176)
**Low Line Color**: Color for unmitigated low levels (default: cyan #00bcd4)
**Upper Band Fill**: Fill color between 1st and 2nd highs (default: purple #880e4f at 85% transparency)
**Lower Band Fill**: Fill color between 1st and 2nd lows (default: cyan #00bcd4 at 85% transparency)
**Line Width**: Thickness of level lines (default: 2, range: 1-5)

BIG Fibo-X MTF✨ BIG Fibo-X MTF – Multi-Timeframe Fibo/EMA Cross System with RSI & Volume Confirmation
The BIG Fibo-X MTF indicator is a rule-based trend and momentum system that combines Fibo-EMA cross signals, RSI filtering, volume confirmation, multi-timeframe validation and ATR-based risk management. It generates precise long and short entries and automatically plots dynamic stop-loss and take-profit levels on the chart.
---
🔥 Key Features
• 📈 Fibo/EMA Cross Logic
Uses a dual EMA structure to detect trend shifts.
– Long signal: short EMA crosses above long EMA
– Short signal: short EMA crosses below long EMA
Reliable for identifying trend reversals and trend continuation phases.
• 📊 RSI Filtering (Current TF + Higher TF)
Signals must pass RSI conditions on both:
– the current timeframe
– a higher timeframe (MTF confirmation)
This ensures only high-probability momentum zones trigger an entry.
• 📉 Volume Confirmation
Signals require volume exceeding the moving average multiplied by your chosen factor.
This filters out low-activity market phases and increases signal accuracy.
• 📐 ATR-Based Stop-Loss & Take-Profit
The indicator automatically calculates:
– Entry level
– ATR-based dynamic stop-loss
– Take-profit using a customizable risk-reward ratio
Ideal for systematic and automated trading setups.
• ⏰ CEST Session Filter
Signals appear only within the defined trading session.
This is especially useful for DAX, Forex and Futures during European market hours.
• 🔔 Visuals & Alerts
The indicator provides:
– Long/Short labels
– Dynamic ATR SL/TP lines
– RSI with overbought/oversold levels
– Data-window signal output
– Alert conditions for long and short entries
Fully compatible with alert-based automation.
---
🎯 Ideal For
• Scalping
• Intraday trading
• Swing trading
• Breakout strategies
• Trend & momentum systems
• Systematic RR-based setups
---
⭐ Advantages
• Clear rule-based signals
• Multi-timeframe validation
• Volume-enhanced filtering
• Dynamic ATR risk management
• Clean visual structure
• Works for manual trading and automated alerts

QFT MTF Range DetectorQFT MTF Range Detector — QuantumFlowTrader
Description:
The QFT MTF Range Detector is a multi-timeframe (MTF) tool designed to identify consolidation zones or ranging conditions across multiple intraday timeframes — from 1 minute up to 4 hours. This indicator is optimized for high-frequency trading environments such as scalping and day trading.
How it works:
For each selected timeframe, the indicator evaluates five key technical conditions:
- Low ADX (less than 17) – suggesting weak trend strength.
- Range width within a specific normalized threshold.
- Normalized ATR (volatility filter) in a defined range.
- RSI near the neutral zone (40–60) with low volatility.
- Price proximity to the mid-range (consolidation center).
Each condition contributes a score. If at least 3 out of 5 conditions are met, that timeframe is considered to be in a range (consolidation).
Visual output:
A compact table is displayed on the chart showing all selected timeframes:
Black box = Timeframe is in a range (consolidation).
Purple box = Not in a range (likely trending or volatile).
Timeframes are labeled (e.g., "4H", "15M") for clarity.
Customization:
Choose display corner (top/bottom, left/right).
Enable or disable table borders.
Set custom colors for range and non-range signals.
Use case:
Traders can quickly assess which timeframes are in a range, helping them:
Avoid choppy markets,
Time entries and exits better,
Confirm multi-timeframe alignment.
Note: This is not a buy/sell signal indicator. It is a market condition filter to enhance decision-making.

[CT] Kurutoga MTF HistogramWhat is Kurutoga MTF Histogram?
The Kurutoga MTF Histogram is a multi-time-frame momentum and mean-deviation tool.
It measures how far the current close is trading away from a rolling midpoint of price and then displays that deviation as a color-coded histogram.
Instead of looking only at one lookback, this version plots three Kurutoga “leads” at the same time:
Kurutoga Lead (x1) – base length
Kurutoga Lead 2x – slower, 2 × base length
Kurutoga Lead 4x – slowest, 4 × base length
Each lead is calculated both on the chart’s timeframe (LTF) and on a Higher Time Frame (HTF) of your choice, so you can see short-term deviation inside a higher-time-frame structure.
4-color Kurutoga scheme
Each Kurutoga lead uses a 4-color MACD-style scheme:
For a given lead:
Up Light – divergence ≥ 0 and rising compared to the previous bar
Up Dark – divergence ≥ 0 and falling (positive but losing momentum)
Down Light – divergence < 0 and falling (bearish momentum increasing)
Down Dark – divergence < 0 and rising (negative but contracting)
By default the same four teal / red hues are shared across x1, x2, and x4. The only difference between the leads is transparency:
x1 = strongest (least transparent)
x2 = medium opacity
x4 = faintest
This lets you see all three layers at once without the chart becoming a solid block of color.
The HTF areas use the same palette but with an extra transparency offset applied, so they appear as soft background bands rather than competing with the histograms.
Inputs and how to use them
1. Base Length
Defines the lookback for the main Kurutoga Lead.
The script automatically creates:
len1 = baseLength
len2 = baseLength × 2
len3 = baseLength × 4
Smaller base lengths → faster, more reactive histograms.
Larger base lengths → smoother, trend-focused behavior.
2. Higher Time Frame
This is the HTF used for the area plots and HTF midpoints.
Examples:
5-minute chart with HTF = 30 or 60 minutes
15-minute chart with HTF = 4H or 1D
The idea is to trade on the lower timeframe while seeing how far price is stretched relative to a higher-time-frame range midpoint.
3. Show / Hide toggles
Under “Show / Hide” you can independently turn on/off:
Kurutoga Lead (x1)
Kurutoga Lead 2x
Kurutoga Lead 4x
HTF Lead, HTF Lead 2x, HTF Lead 4x
This lets you:
Run only a single Kurutoga if you want a clean panel, or
Stack multiple leads for a “multi-speed” view of extension and mean reversion.
4. Color Scheme (4-color Kurutoga)
Up Light / Up Dark / Down Light / Down Dark – base hues used for every lead.
Lead opacity (x1, 2x, 4x) – sets how strong or faint each lead appears.
x1 is usually your primary “trading speed.”
x2 and x4 can be faded so they act as context.
Extra transparency for HTF areas – additional opacity applied on top of each lead’s opacity when drawing HTF areas. This keeps the HTF layer subtle.
You can fine-tune the exact teal/red values here to match your personal palette.
Practical reading & trade ideas
Trend alignment
When all three Kurutoga leads (x1, 2x, 4x) are above zero, price is trading above its rolling mid-range on multiple speeds → bullish environment.
When all three are below zero, you have a multi-speed bearish environment.
Mixed readings (e.g., x1 above zero, x4 below zero) can signal transition or mean-reversion areas.
Momentum vs exhaustion
Up Light / Down Light (light colors) show momentum expanding in that direction.
Up Dark / Down Dark (dark colors) show momentum contracting – price still on that side of zero, but the push is weakening.
After a run of Up Light bars, a shift to Up Dark may hint at a stall or pullback.
After a run of Down Light bars, a shift to Down Dark may hint at short covering / bounce potential.
Multi-time-frame confluence
Use the HTF areas as a backdrop:
If LTF Kurutoga leads are above zero while the HTF area is also positive (and ideally expanding), that’s strong bullish alignment.
If LTF leads are trying to flip up while HTF divergence is still deeply negative, you may be looking at a counter-trend bounce rather than a true trend change.
Example setups
Trend-following entries:
Look for x2 & x4 leads on the same side of zero as the HTF area, then use x1 color shifts (from Down Dark → Up Light or vice versa) to fine-tune entries in the direction of that higher-time-frame bias.
Mean-reversion fades:
Watch for extreme Kurutoga values where x1/x2 are strongly extended beyond zero while color flips from Light to Dark (momentum stalling) against an opposing HTF backdrop .
Notes
The indicator is non-directional by itself – it measures distance from a rolling midpoint rather than trend structure or order flow. It works best when combined with your existing price action/trend tools (moving averages, HLBO, structure zones, etc.).
Because HTF values are brought down via request.security, choose HTF settings that make sense for your product and session (for example, don’t use very high HTFs on thin intraday markets).
Use the Kurutoga MTF Histogram as a visual scanner for extension, momentum regime, and multi-speed alignment, then layer your own entry/exit rules on top.

Turtle System 1 (20/10) + N-Stop + MTF Table V7.2🐢 Description: Turtle System 1 (20/10) IndicatorThis indicator implements the original trading signals of the Turtle Trading System 1 based on the classic Donchian Channels. It incorporates a historically correct, volatility-based Trailing Stop (N-Stop) and a Multi-Timeframe (MTF) status dashboard. The script is written in Pine Script v6, optimized for performance and reliability.📊 Core Logic and ParametersThe system is a pure trend-following model, utilizing the more widely known, conservative parameters of the Turtle System 1:FunctionParameterValueDescriptionEntry$\text{Donchian Breakout}$$\mathbf{20}$Buy/Sell upon breaking the 20-day High/Low.Exit (Turtle)$\text{Donchian Breakout}$$\mathbf{10}$Close the position upon breaking the 10-day Low/High.Volatility$\mathbf{N}$ (ATR Period)$\mathbf{20}$Calculation of market volatility using the Average True Range (ATR).Stop-LossMultiplier$\mathbf{2.0} BER:SETS the initial and Trailing Stop at $\mathbf{2N}$.🛠️ Key Technical Features1. Original Turtle Trailing Stop (Section 4)The stop-loss mechanism is implemented with the historically accurate Turtle Trailing Logic. The stop is not aggressively tied to the current candle's low/high, which often causes premature exits. Instead, the stop only trails in the direction of the trend, maximizing the previous stop price against the new calculated $\text{Close} \pm 2N$:$$\text{New Trailing Stop} = \text{max}(\text{Previous Stop}, \text{Close} \pm (2 \times N))$$2. Reliable Multi-Timeframe (MTF) Status (Section 6)The indicator features a robust MTF status table.Purpose: It calculates and persistently stores the Turtle System 1 status (LONG=1, SHORT=-1, FLAT=0) for various timeframes (1H, 4H, 8H, 1D, and 1W).Method: It uses global var int variables combined with request.security(), ensuring the status is accurately maintained and updated across different bars and timeframes, providing a reliable higher-timeframe context.3. VisualizationsChannels: The 20-period (Entry) and 10-period (Exit) Donchian Channels are plotted.Stop Line: The dynamic $\mathbf{2N}$ Trailing Stop is visible as a distinct line.Signals: plotshape markers indicate Entry and Exit.MTF Table: A clean, color-coded status summary is displayed in the upper right corner.

Turtle System 2 (55/20) + N-Stop + MTF Table V7.2🐢 Description: Turtle System 2 (55/20) IndicatorThis indicator implements the trading signals of the Turtle Trading System 2 based on the classic Donchian Channels, supplemented by a historically correct, volatility-based Trailing Stop (N-Stop) and a Multi-Timeframe (MTF) status overview. The script was developed in Pine Script v6 and is optimized for performance and robustness.📊 Core Logic and ParametersThe indicator is based on the rule-based trend-following system developed by Richard Dennis and William Eckhardt, utilizing the more aggressive Entry/Exit parameters of System 2:FunctionParameterValueDescriptionEntry$\text{Donchian Breakout}$$\mathbf{55}$Buy/Sell upon breaking the 55-day High/Low.Exit (Turtle)$\text{Donchian Breakout}$$\mathbf{20}$Close the position upon breaking the 20-day Low/High.Volatility$\mathbf{N}$ (ATR Period)$\mathbf{20}$Calculation of market volatility using the Average True Range (ATR).Stop-LossMultiplier$\mathbf{2.0} BER:SETS the initial and Trailing Stop at $\mathbf{2N}$.🛠️ Technical Implementation1. Correct Trailing Stop (Section 4)In contrast to many flawed implementations, the Trailing Stop is implemented here according to the Original Turtle Logic. The stop price (current_stop_price) is not aggressively tied to the current low or high. Instead, at the close of each bar, it is only trailed in the direction of the trade (math.max for long positions) based on the formula:$$\text{New Trailing Stop} = \text{max}(\text{Previous Stop}, \text{Close} \pm (2 \times N))$$This ensures the stop is only adjusted upon sustained positive movement and is not prematurely triggered by short-term, deep price shadows.2. Reliable Multi-Timeframe (MTF) Logic (Section 6)The MTF section utilizes global var int variables (mtf_status_1h, mtf_status_D, etc.) in conjunction with the request.security() function.Purpose: Calculates and persistently stores the current Turtle System 2 status (LONG=1, SHORT=-1, FLAT=0) for the timeframes 1H, 4H, 8H, 1D, and 1W.Advantage: By persistently storing the status using the var variables, the critical error of single-update status is eliminated. The states shown in the table are reliable and accurately reflect the Turtle System's position status on the respective timeframes.3. Visual ComponentsDonchian Channels: The entry (55-period) and exit (20-period) channels are drawn with color highlighting.N-Stop Line: The dynamically calculated Trailing Stop ($\mathbf{2N}$) is displayed as a magenta line.Visual Signals: plotshape markers indicate Entry and Exit points.MTF Table: A compact status summary with color coding (Green/Red/Gray) for the higher timeframes is displayed in the upper right corner.

💎 Trend Master Pro Scalping MTFTrend Master Pro Scalping MTF is a professional-grade indicator designed for intraday trading and scalping, optimized for 1M, 5M, and 15M timeframes. It combines multiple technical filters to provide high-confidence breakout and trend signals with visual clarity.
Key Features:
Multi-indicator analysis: EMA, RSI, ATR, SuperTrend, and volume.
Multi-Timeframe (MTF) filter: signals are validated only if the higher timeframe trend is aligned.
Clear visual signals: colored triangles and dynamic labels showing signal strength: A++, A+, A, B.
Confirmation dashboard: instantly see EMA trend, RSI strength, volume, ATR activity, SuperTrend direction, and final signal on your chart.
Reliable alerts: fixed alert messages compatible with TradingView, avoiding Pine Script errors.
Customizable parameters: adjust EMA, RSI, ATR, volume, and SuperTrend settings to match your scalping or day trading style.
How to Use:
Select your desired timeframe: 1M, 5M, or 15M.
Look for signals rated A++ or A+ for maximum probability.
Confirm trends using labels and the dashboard before entering trades.
Receive real-time notifications via alerts when confirmed signals occur.
Benefits:
Ideal for quick scalping and intraday strategies.
Reduces false signals with MTF trend filtering.
Professional visualization for fast and confident decision-making.
Recommendations:
Test on a demo account before trading live.
Adjust parameters to fit your asset and timeframe.
Combine with proper risk management strategies.

Pinbar MTF - No Repaint# Pinbar MTF - No Repaint Indicator
## Complete Technical Documentation
---
## 📊 Overview
**Pinbar MTF (Multi-Timeframe) - No Repaint** is a professional-grade TradingView Pine Script indicator designed to detect high-probability pinbar reversal patterns with advanced filtering systems. The indicator is specifically engineered to be **100% non-repainting**, making it reliable for both live trading and backtesting.
### Key Features
✅ **Non-Repainting** - Signals only appear AFTER bar closes, never disappear
✅ **Three-Layer Filter System** - ATR, SWING, and RSI filters
✅ **Automatic SL/TP Calculation** - Based on risk:reward ratios
✅ **Real-time Alerts** - TradingView notifications for all signals
✅ **Visual Trade Management** - Lines, labels, and areas for entries, stops, and targets
✅ **Backtesting Ready** - Reliable historical data for strategy testing
---
## 🎯 What is a Pinbar?
A **Pinbar (Pin Bar/Pinocchio Bar)** is a single candlestick pattern that indicates a potential price reversal:
### Bullish Pinbar (BUY Signal)
- **Long lower wick** (rejection of lower prices)
- **Small body at the top** of the candle
- Shows buyers rejected sellers' attempt to push price down
- Forms at support levels or swing lows
- Entry signal for LONG positions
### Bearish Pinbar (SELL Signal)
- **Long upper wick** (rejection of higher prices)
- **Small body at the bottom** of the candle
- Shows sellers rejected buyers' attempt to push price up
- Forms at resistance levels or swing highs
- Entry signal for SHORT positions
---
## 🔧 How the Indicator Works
### 1. **Pinbar Detection Logic**
The indicator analyzes the **previous closed bar ** to identify pinbar patterns:
```
Bullish Pinbar Requirements:
- Lower wick > 72% of total candle range (adjustable)
- Upper wick < 28% of total candle range
- Close > Open (bullish candle body)
Bearish Pinbar Requirements:
- Upper wick > 72% of total candle range (adjustable)
- Lower wick < 28% of total candle range
- Close < Open (bearish candle body)
```
**Why check ?** By analyzing the previous completed bar, we ensure the pattern is fully formed and won't change, preventing repainting.
---
### 2. **Three-Layer Filter System**
#### 🔍 **Filter #1: ATR (Average True Range) Filter**
- **Purpose**: Ensures the pinbar has significant size
- **Function**: Only signals if pinbar range ≥ ATR value
- **Benefit**: Filters out small, insignificant pinbars
- **Settings**:
- Enable/Disable toggle
- ATR Period (default: 7)
**Example**: If ATR = 50 pips, only pinbars with 50+ pip range will signal.
---
#### 🔍 **Filter #2: SWING Filter** (Always Active)
- **Purpose**: Confirms pinbar forms at swing highs/lows
- **Function**: Validates the pinbar is an absolute high/low
- **Benefit**: Identifies true reversal points
- **Settings**:
- Swing Candles (default: 3)
**How it works**:
- For bullish pinbar: Checks if low is lowest of past 3 bars
- For bearish pinbar: Checks if high is highest of past 3 bars
**Example**: With 3 swing candles, a bullish pinbar must have the lowest low among the last 3 bars.
---
#### 🔍 **Filter #3: RSI (Relative Strength Index) Filter**
- **Purpose**: Confirms momentum conditions
- **Function**: Prevents signals in extreme momentum zones
- **Benefit**: Avoids counter-trend trades
- **Settings**:
- Enable/Disable toggle
- RSI Period (default: 7)
- RSI Source (Close, Open, High, Low, HL2, HLC3, OHLC4)
- Overbought Level (default: 70)
- Oversold Level (default: 30)
**Logic**:
- Bullish Pinbar: Only signals if RSI < 70 (not overbought)
- Bearish Pinbar: Only signals if RSI > 30 (not oversold)
---
### 3. **Stop Loss Calculation**
Two methods available:
#### Method A: ATR-Based Stop Loss (Recommended)
```
Bullish Pinbar:
SL = Pinbar Low - (1 × ATR)
Bearish Pinbar:
SL = Pinbar High + (1 × ATR)
```
**Benefit**: Dynamic stops that adapt to market volatility
#### Method B: Fixed Pips Stop Loss
```
Bullish Pinbar:
SL = Pinbar Low - (Fixed Pips)
Bearish Pinbar:
SL = Pinbar High + (Fixed Pips)
```
**Settings**:
- Calculate Stop with ATR (toggle)
- Stop Pips without ATR (default: 5)
---
### 4. **Take Profit Calculation**
Take Profit is calculated based on Risk:Reward ratio:
```
Bullish Trade:
TP = Entry + (Entry - SL) × Risk:Reward Ratio
Bearish Trade:
TP = Entry - (SL - Entry) × Risk:Reward Ratio
```
**Example**:
- Entry: 1.2000
- SL: 1.1950 (50 pip risk)
- RR: 2:1
- TP: 1.2100 (100 pip reward = 50 × 2)
**Settings**:
- Risk:Reward Ratio (default: 1.0, range: 0.1 to 10.0)
---
## 📈 Visual Elements
### On-Chart Displays
1. **Signal Markers**
- 🟢 **Green Triangle Up** = Bullish Pinbar (BUY)
- 🔴 **Red Triangle Down** = Bearish Pinbar (SELL)
- Placed directly on the pinbar candle
2. **Entry Labels**
- Green "BUY" label with entry price
- Red "SELL" label with entry price
- Shows exact entry level
3. **Stop Loss Lines**
- 🔴 Red horizontal line
- "SL" label
- Extends 20 bars forward
4. **Take Profit Lines**
- 🟢 Green horizontal line
- "TP" label
- Extends 20 bars forward
5. **Risk/Reward Areas** (Optional)
- Red shaded box = Risk zone (Entry to SL)
- Green shaded box = Reward zone (Entry to TP)
- Visual risk:reward visualization
6. **Info Table** (Top Right)
- Displays current settings
- Shows filter status (ON/OFF)
- Real-time RSI value
- Quick reference panel
---
## 🔔 Alert System
Three alert types available:
### 1. Combined Alert: "Pinbar Signal (Any Direction)"
- Fires for BOTH bullish and bearish pinbars
- **Best for**: General monitoring
- **Message**: "Pinbar Signal Detected on {TICKER} at {PRICE}"
### 2. Bullish Alert: "Bullish Pinbar Alert"
- Fires ONLY for BUY signals
- **Best for**: Long-only strategies
- **Message**: "BUY Signal on {TICKER} at {PRICE}"
### 3. Bearish Alert: "Bearish Pinbar Alert"
- Fires ONLY for SELL signals
- **Best for**: Short-only strategies
- **Message**: "SELL Signal on {TICKER} at {PRICE}"
---
## ⚙️ Input Parameters Reference
### **Filters Group**
| Parameter | Default | Range | Description |
|-----------|---------|-------|-------------|
| ATR Filter on Pinbar Range? | ✅ ON | Boolean | Enable/disable ATR filter |
| ATR Period | 7 | 1+ | Lookback period for ATR calculation |
| Swing Candles | 3 | 1+ | Bars to check for swing high/low |
| RSI Filter on Pinbar? | ❌ OFF | Boolean | Enable/disable RSI filter |
| RSI Period | 7 | 2+ | Lookback period for RSI calculation |
| RSI Source | Close | Multiple | Price data for RSI (Close/Open/High/Low/etc) |
| RSI Overbought Level | 70 | 50-100 | Upper threshold for RSI filter |
| RSI Oversold Level | 30 | 0-50 | Lower threshold for RSI filter |
### **Pinbar Detection Group**
| Parameter | Default | Range | Description |
|-----------|---------|-------|-------------|
| Shadow % vs Body | 72 | 50-95 | Minimum wick size as % of total range |
### **Visualization Group**
| Parameter | Default | Range | Description |
|-----------|---------|-------|-------------|
| Show SL and TP Lines? | ✅ ON | Boolean | Display stop loss and take profit lines |
| Show SL and TP Area? | ❌ OFF | Boolean | Show shaded risk/reward boxes |
### **Risk Management Group**
| Parameter | Default | Range | Description |
|-----------|---------|-------|-------------|
| Risk:Reward Ratio | 1.0 | 0.1-10.0 | Target profit vs risk (1.0 = 1:1, 2.0 = 1:2) |
| Calculate Stop with ATR? | ✅ ON | Boolean | Use ATR for stop calculation |
| Stop Pips without ATR | 5 | 1+ | Fixed pip stop when ATR disabled |
---
## 🚫 Non-Repainting Architecture
### What is Repainting?
**Repainting** occurs when an indicator's historical signals differ from what appeared in real-time. This makes backtesting unreliable and can lead to false confidence in a strategy.
### How This Indicator Prevents Repainting
1. **Closed Bar Analysis**
- All calculations use ` ` offset (previous bar)
- Only analyzes COMPLETED candles
- Signals appear on the bar AFTER the pinbar closes
2. **Confirmed Swing Points**
- Waits for sufficient bar history before signaling
- Only checks historical bars that cannot change
- Prevents premature swing detection
3. **Static Alert Timing**
- Alerts fire only after bar completion
- No conditional logic that changes historically
- Same results in replay mode and live trading
### Verification Method
To verify non-repainting behavior:
1. Apply indicator to chart
2. Note signal locations and prices
3. Refresh browser / reload chart
4. **Signals remain in exact same locations**
---
## 💼 Trading Strategy Guidelines
### Entry Rules
**For Bullish Pinbar (LONG):**
1. Wait for green triangle to appear
2. Enter at close of pinbar (shown in label)
3. Alternative: Enter on break of pinbar high
4. Place stop loss at red SL line
5. Set target at green TP line
**For Bearish Pinbar (SHORT):**
1. Wait for red triangle to appear
2. Enter at close of pinbar (shown in label)
3. Alternative: Enter on break of pinbar low
4. Place stop loss at red SL line
5. Set target at green TP line
### Risk Management
- **Position Sizing**: Risk only 1-2% of account per trade
- **Stop Loss**: Always use the calculated SL (never move it wider)
- **Take Profit**: Use calculated TP or trail stop after 1:1 RR
- **Multiple Timeframes**: Confirm signals on higher timeframe
### Best Practices
✅ **DO:**
- Wait for bar to close before entering
- Trade in direction of higher timeframe trend
- Use on liquid markets with clear support/resistance
- Combine with price action analysis
- Keep a trading journal
❌ **DON'T:**
- Enter before bar closes (prevents seeing full pattern)
- Trade against strong trends
- Ignore the filters (they improve win rate)
- Risk more than 2% per trade
- Trade every signal (be selective)
---
## 📊 Backtesting & Data Export
### Available Data Points
The indicator exports these values for strategy development:
| Output | Description |
|--------|-------------|
| Bullish Signal | 1 = BUY signal, 0 = No signal |
| Bearish Signal | 1 = SELL signal, 0 = No signal |
| Bull SL | Stop loss level for long trades |
| Bull TP | Take profit level for long trades |
| Bull Entry | Entry price for long trades |
| Bear SL | Stop loss level for short trades |
| Bear TP | Take profit level for short trades |
| Bear Entry | Entry price for short trades |
### How to Use in Strategy
These values can be accessed by Pine Script strategies using:
```pine
indicator_values = request.security(syminfo.tickerid, timeframe.period,
)
```
---
## 🎓 Understanding the Filters
### Why Use Multiple Filters?
Single-indicator systems often generate too many false signals. This indicator uses a **confluence approach**:
1. **Pinbar Pattern** = Price rejection detected
2. **+ SWING Filter** = Rejection at key level
3. **+ ATR Filter** = Significant move
4. **+ RSI Filter** = Favorable momentum
**Result**: Higher probability setups with better risk:reward
### Filter Optimization
**Conservative Settings** (Fewer, Higher Quality Signals):
- ATR Filter: ON
- Swing Candles: 5
- RSI Filter: ON
- Shadow %: 75%
**Aggressive Settings** (More Signals, More Noise):
- ATR Filter: OFF
- Swing Candles: 2
- RSI Filter: OFF
- Shadow %: 65%
**Balanced Settings** (Recommended):
- ATR Filter: ON
- Swing Candles: 3
- RSI Filter: OFF (or ON for trending markets)
- Shadow %: 72%
---
## 🔍 Troubleshooting
### "No Signals Appearing"
**Possible Causes:**
1. Filters are too strict
2. No pinbars forming on chart
3. Insufficient bar history
**Solutions:**
- Reduce Shadow % to 65%
- Reduce Swing Candles to 2
- Disable ATR or RSI filters temporarily
- Check that chart has enough data loaded
### "Too Many Signals"
**Solutions:**
- Enable ATR filter
- Increase Swing Candles to 4-5
- Enable RSI filter
- Increase Shadow % to 75-80%
### "Signals Appearing Late"
**This is normal behavior!** The indicator:
- Analyzes previous closed bar
- Signals appear on the bar AFTER the pinbar
- This is what prevents repainting
- Signal latency is 1 bar (by design)
---
## 📝 Technical Specifications
**Indicator Type:** Overlay (displays on price chart)
**Pine Script Version:** 5
**Max Labels:** 500
**Max Lines:** 500
**Repainting:** None (100% non-repainting)
**Data Window Values:** 8 exported values
**Alert Types:** 3 (Combined, Bullish, Bearish)
**Performance:**
- Lightweight script (fast execution)
- Works on all timeframes
- Compatible with all markets (Forex, Crypto, Stocks, Futures)
- No data snooping bias
---
## 🎯 Use Cases
### 1. **Swing Trading**
- Timeframe: Daily, 4H
- Filter Settings: All enabled
- Best for: Catching major reversals
### 2. **Day Trading**
- Timeframe: 15m, 1H
- Filter Settings: ATR + SWING only
- Best for: Intraday reversals
### 3. **Scalping**
- Timeframe: 5m, 15m
- Filter Settings: SWING only (aggressive)
- Best for: Quick reversals (requires experience)
### 4. **Position Trading**
- Timeframe: Weekly, Daily
- Filter Settings: All enabled + high RR (2:1 or 3:1)
- Best for: Long-term trend reversal catches
---
## 🏆 Advantages Over Other Pinbar Indicators
✅ **Guaranteed Non-Repainting** - Many pinbar indicators repaint; this one never does
✅ **Automatic SL/TP** - No manual calculation needed
✅ **Multi-Layer Filtering** - Reduces false signals significantly
✅ **Visual Trade Management** - Clear entry, stop, and target levels
✅ **Flexible Configuration** - Adaptable to any trading style
✅ **Alert System** - Never miss a setup
✅ **Backtesting Ready** - Reliable historical data
✅ **Professional Grade** - Suitable for live trading
---
## 📚 Educational Resources
### Recommended Reading on Pinbars
- "The Pin Bar Trading Strategy" by Nial Fuller
- "Price Action Trading" by Al Brooks
- TradingView Education: Price Action Patterns
### Practice Recommendations
1. Paper trade signals for 20+ trades before live trading
2. Backtest on different timeframes and markets
3. Keep detailed records of all trades
4. Analyze winning vs losing setups
5. Refine filter settings based on results
---
## ⚖️ Disclaimer
This indicator is a tool for technical analysis and does not guarantee profits. Trading involves substantial risk of loss. Past performance is not indicative of future results.
- Always use proper risk management
- Never risk more than you can afford to lose
- Consider your trading experience and objectives
- Seek independent financial advice if needed
---
## 📧 Version Information
**Current Version:** 1.0
**Last Updated:** 2024
**Compatibility:** TradingView Pine Script v5
**Status:** Production Ready
---
## 🔄 Future Enhancements (Potential)
Possible future additions:
- Multi-timeframe confirmation option
- Volume filter integration
- Customizable color schemes
- Win rate statistics display
- Partial profit taking levels
- Trailing stop functionality
---
## 📖 Quick Start Guide
### 5-Minute Setup
1. **Add to Chart**
- Open TradingView
- Go to Pine Editor
- Paste the code
- Click "Add to Chart"
2. **Configure Settings**
- Open indicator settings (gear icon)
- Start with default settings
- Enable "Show SL and TP Lines"
3. **Set Alert**
- Right-click indicator name
- Click "Add Alert"
- Select "Pinbar Signal (Any Direction)"
- Configure notification method
4. **Test**
- Scroll back on chart
- Verify signals make sense
- Check that signals don't repaint
5. **Trade** (After Practice!)
- Wait for alert
- Verify signal quality
- Enter, place SL/TP
- Manage trade
---
## 🎯 Final Thoughts
The **Pinbar MTF - No Repaint** indicator is designed for serious traders who value:
- **Reliability** over flashy signals
- **Quality** over quantity
- **Honesty** over false promises
This indicator will NOT:
- Make you rich overnight
- Win every trade
- Replace proper trading education
This indicator WILL:
- Identify high-probability reversal setups
- Save you analysis time
- Provide consistent, non-repainting signals
- Help you develop a systematic trading approach
**Success in trading comes from:**
1. Proper education (60%)
2. Risk management (30%)
3. Technical tools like this indicator (10%)
Use this tool as part of a complete trading plan, not as a standalone solution.

VWMA Series (Dynamic) mtf - Dual Gradient Colored"VWMA Series (Dynamic) mtf - Dual Gradient Colored" is a multi-timeframe (MTF) Volume-Weighted Moving Average (VWMA) ribbon indicator that plots up to 60 sequential VWMAs with arithmetic progression periods (e.g., 1, 4, 7, 10…). Each VWMA line is dual-gradient colored: Base hue = Greenish (#2dd204) if close > VWMA (bullish), Magenta (#ff00c8) if close < VWMA (bearish)
Brightness gradient = fades from base → white as period increases (short → long-term)
Uses daily resolution by default (timeframe="D"), making it ideal for higher-timeframe trend filtering on lower charts.Key FeaturesFeature
Description
Dynamic Periods
Start + i × Increment → e.g., 1, 4, 7, 10… up to 60 terms
Dual Coloring
Bull/Bear + Gradient (short = vivid, long = pale)
MTF Ready
Plots daily VWMAs on any lower timeframe (1H, 15M, etc.)
No Lag on Long Sets
Predefined "best setups" eliminate repainting/lag
Transparency Control
Adjustable line opacity for clean visuals
Scalable
Up to 60 VWMAs (max iterations)
Recommended Setups (No Lag)Type
Example Sequence (Start, Inc, Iter)
Long-Term Trend
1, 3, 30 → 1, 4, 7 … 88
93, 3, 30 → 93, 96 … 180
372, 6, 30 → 372, 378 … 546
Short-Term Momentum
1, 1, 30 → 1, 2, 3 … 30
94, 2, 30 → 94, 96 … 152
1272, 5, 30 → 1272, 1277 … 1417
Key Use CasesUse Case
How to Use
1. Multi-Timeframe Trend Alignment
On 1H chart, use 1, 3, 30 daily VWMAs → price above all green lines = strong uptrend
2. Dynamic Support/Resistance
Cluster of long-term pale VWMAs = major S/R zone
3. Early Trend Change Detection
Short-term vivid lines flip from red → green before longer ones = early bullish signal
4. Ribbon Compression/Expansion
Tight bundle → consolidation; fanning out → trend acceleration
5. Mean Reversion Entries
Price far from long-term VWMA cluster + short-term reversal = pullback trade
6. Volume-Weighted Fair Value
Long-period VWMAs reflect true average price paid over weeks/months
Visual Summary
Price ↑
████ ← Short VWMA (vivid green = close > VWMA)
███
██
█
. . . fading to white
█
██
███
████ ← Long VWMA (pale = institutional average)
Green lines = price above VWMA (bullish bias)
Magenta lines = price below VWMA (bearish bias)
Gradient = shorter (left) → brighter; longer (right) → whiter
Ribbon thickness = trend strength (wide = strong, narrow = weak)
Best For Swing traders using daily trend on intraday charts
Volume-based strategies (VWMA > SMA)
Clean, colorful trend visualization without clutter
Institutional fair value anchoring via long-period VWMAs
Pro Tip:
Use Start=1, Increment=3, Iterations=30 on a 4H chart with timeframe="D" → perfect daily trend filter with zero lag and beautiful gradient flow.

ZEN MTF Price ProjectionZEN MTF Price Projection
A lightweight, multi‑timeframe price projection that extends a ZigZag‑style path into the future. It chains six timeframes (1m → 5m → 15m → 1H → 4H → 1D) where each segment continues the previous one, creating a continuous forward path of arrows. The engine blends expected move and volatility to estimate the next leg for each TF. Calculations are proprietary and optimized for real‑time updates.
Caution
Treat the projection as a guide, not a guarantee. Avoid trading directly against higher‑TF segment direction.
Key features
MTF chained path: each TF continues the previous, producing a continuous forward “ZigZag‑style” projection.
Real‑time or timed updates: redraws every bar (Realtime) or every N minutes.
Visual arrows every N bars for readability; configurable segment length per TF.
Resource‑safe rendering with automatic cleanup.
Inputs (quick guide)
Bars per timeframe: number of bars each TF projects forward.
Arrow every N bars: density of arrows along each segment.
Update mode: Realtime or Every N minutes (default 1).
Colors: up/down palette for projected segments.
Alerts and workflow tips
Use Trading Panel alerts on color changes of the active segment (manual rule).
Combine with your execution playbook (e.g., candle confirmation, volume burst, or LTF pullback).
Best with liquid markets and regular sessions; widen SL on high‑volatility assets.
What this indicator is not
Not a crystal ball; it’s a probabilistic forward path based on proprietary MTF expectations and volatility scaling.
Not a replacement for risk management or market context.
Disclaimer
For educational purposes only. Past performance is not indicative of future results. Trade at your own risk.

Entry (MTF) - Three phase Reversal patternOf course. We can absolutely reframe the explanation to give the strategy a more unique or generalized name, focusing on the concepts rather than the specific mentor.
Here is a revised, in-depth guide for your "Entry(MTF)" indicator, presented as the **"Momentum Shift Entry Model."**
***
### Entry (MTF) Indicator: A Guide to the Momentum Shift Model
This powerful indicator is designed to automatically detect a high-probability **Momentum Shift Entry Pattern**. The core strategy is to identify moments where the market's direction is likely to make a significant and sustained reversal, often driven by institutional order flow.
The indicator's key advantage is its **Multi-Timeframe (MTF)** functionality. It allows you to find these robust setups on a higher timeframe (like the daily chart) and then projects those signals onto your active, lower timeframe chart (like the 15-minute), providing a clear strategic edge for timing your entries.
---
## The Core Logic: The Three-Phase Reversal Pattern
This indicator is not based on a simple lagging condition. It looks for a specific three-step sequence of events. This sequence validates a genuine shift in market control from sellers to buyers (or vice-versa), filtering out false moves.
### Step 1: The Liquidity Purge 🎯
First, the indicator identifies recent, significant swing highs and lows on the chart. These price levels are natural magnets for liquidity, as many traders place their stop-loss orders there.
* **A Bullish Setup** begins when the price first dips **below a recent swing low**. This action is often an engineered move to "purge" or "sweep" the sell-side liquidity resting there before a move higher.
* **A Bearish Setup** begins with a price spike **above a recent swing high**, clearing out the buy-side liquidity.
This initial phase is designed to trap traders on the wrong side of the market before the true move begins.
### Step 2: The Market Structure Shift (The Confirmation) 🔄
After the liquidity has been taken, the indicator needs confirmation that a real power shift has occurred. This is confirmed by a **Market Structure Shift (MSS)**.
* After a **bullish purge (of a low)**, an MSS is confirmed when the price aggressively rallies and closes **above a recent swing *high***. This proves that buyers have not only absorbed all the selling but are now strong enough to break previous resistance levels.
* After a **bearish purge (of a high)**, an MSS is confirmed when the price falls and closes **below a recent swing *low***, showing that sellers are now decisively in command.
### Step 3: The Price Imbalance (The Entry Zone) GAP) is created during the same powerful move that caused the Market Structure Shift. A Fair Value Gap, or **price imbalance**, is a three-candle pattern that signifies a very aggressive, one-sided move, leaving a gap in the market that price will often seek to re-fill.
This FVG acts as the signature of institutional activity and becomes a high-probability zone for planning a trade entry.
---
## How to Use the Indicator in Your Trading
The true strength of this indicator lies in combining the higher-timeframe signal with the immediate context of your trading timeframe.
### Reading the Signals and Visuals
* **`BUY` / `SELL` Labels:** These are your primary signals, generated from the **"Signal Timeframe"** you select (e.g., Daily). A "BUY" label indicates that the complete three-phase bullish pattern has been confirmed on that higher timeframe.
* **Dotted Lines (Liquidity Levels):** The red and green dotted lines on your chart mark the most recent swing high and low on your **current timeframe**. These are the levels to watch for a potential "Liquidity Purge."
* **Colored Boxes (Imbalance Zones):** The green (bullish) and red (bearish) boxes highlight the Fair Value Gaps on your **current timeframe**. These are your potential entry zones.
### A Potential Trading Strategy
1. **Set Your Signal Timeframe:** Choose a higher timeframe that you use to define the overall trend (e.g., 'D' for daily, '4H' for 4-hour).
2. **Wait for an HTF Signal:** Patiently wait for a `BUY` or `SELL` label to appear. This is your cue to begin actively looking for an entry.
3. **Find a Local Entry Zone:** Once a `BUY` signal from the higher timeframe appears, look for the price on your current chart to retrace into a nearby **bullish FVG (green box)**. For a `SELL` signal, look for a pullback into a **bearish FVG (red box)**.
4. **Entry:** Plan your entry as the price tests this imbalance zone.
5. **Stop Loss:** A logical stop loss is critical. For a buy trade, place your stop below the swing low that was formed during the MSS. For a sell trade, place it above the corresponding swing high.
6. **Take Profit:** Aim for a significant liquidity level on a higher timeframe or use a predetermined risk-to-reward ratio (e.g., 1:2, 1:3).
---
## Customizing the Settings
* **`Signal Timeframe`**: The most critical setting. It determines the timeframe from which the core buy/sell logic originates. A Daily signal will carry more weight than an H1 signal.
* **`Liquidity/MSS Lookback`**: This controls the significance of the swing points the indicator uses.
* **Higher value:** Finds major, long-term swing points, leading to fewer but more powerful signals.
* **Lower value:** Finds minor, short-term swing points, leading to more frequent but potentially less reliable signals.
* **`Show Current TF Fair Value Gaps`**: This toggles the visibility of the imbalance zones (FVG boxes) on your chart. It is highly recommended to keep this enabled to easily spot your entry areas.
