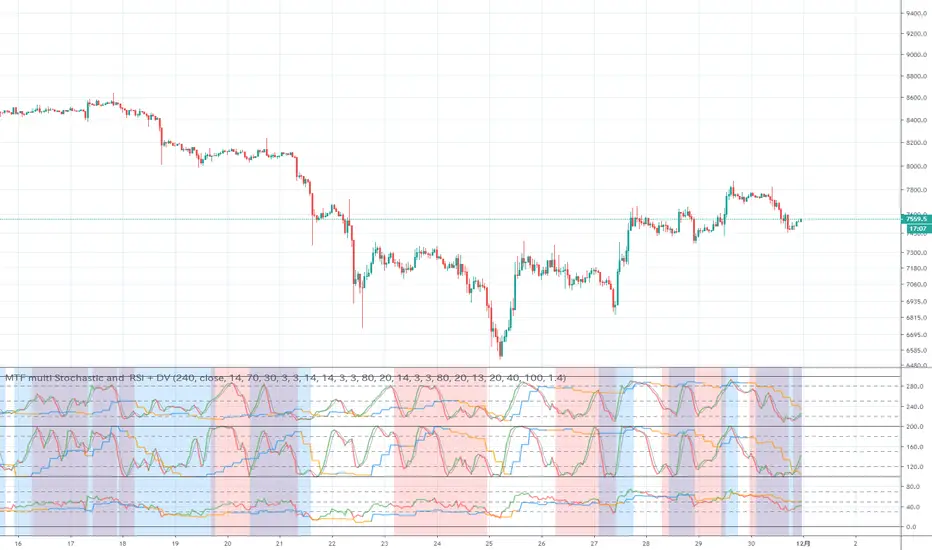
MTF multi Stochastic and RSI + DVIt is an indicator that it is going to see stochastic, stochast RSI, RSI, and Damiani Volatmeter v3.2 at a stretch.
In order from the top, stochastic, stochastic RSI, and RSI.
Due to the specifications of pine, the overall numerical value is +200 for stochastic and +100 for stochastic RSI.
The line that the current foot displays in two colors, green and red, and the signal gray line. This is a line with the upper legs displayed in blue and orange.
Damiani Volatmeter v3.2 is displayed in the background color.
Red is when the current foot is in the range market, blue is when the upper foot is in the range market. In the case of both ranges, the colors will overlap and become purple.
It was created with the idea that it might be relatively safe if you reverse the tension when the color of the stochastic changes in the purple area.
ストキャスティック、ストキャスRSI、RSI、Damiani Volatmeter v3.2を一気に見ようというというインジケーターです。
上から順番にストキャスティック、ストキャスRSI、RSIとなっています。
pineの仕様上、全体の数値が、ストキャスティックが+200、ストキャスRSIが+100となっています。
現在の足が緑と赤の2色で表示している線とシグナルの灰色の線。上位足が青とオレンジ色で表示している線です。
Damiani Volatmeter v3.2はバックグランドの色で表示しています。
赤色が現在の足がレンジ相場の場合、青色が上位足がレンジ相場の場合です。両方レンジ相場の場合は色が重なって紫色になると思われます。
紫色の所でストキャスティックなどの色が変わった時に逆張りをすれば比較的安全かもしれないという考えで作成しました。
Search in scripts for "mtf"
MTF VWAP WITH STDEVSThis script displays multiple standard deviations for multiple vwaps. It also has options to use custom methods of calculating standard deviations.

MTF CMO (Chande Momentum Oscillator)Simple Multi-Timeframe version of the Chande Momentum Oscillator . Many thanks to HPotter whos script I used as a starting point. This displays 1, 2, 3, 4, and 24 period CMOs on the graph. 1, 2, 3, and 4 periods are smoothed by using their simple moving averages. 24 period is unsmoothed. I prefer to set my chart to a 1 hour timeframe and look for bottoming or topping patterns in the momentum. Strongest topping or bottoming patterns are when all timeframes roll over including the 24 period.

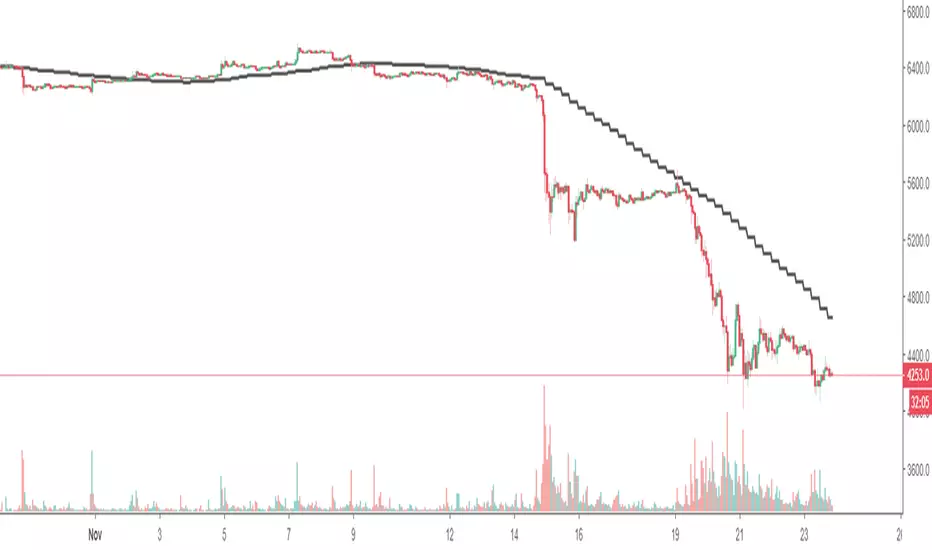
MTF-TTP-SThis indicator makes it easy to identify the trend transition and OHLC-ZONE. Use it as a hint to validate the Dow theory.


MTF Ichimoku Cloud(tandoori_chicken)通常の一目均衡表に加え、1つ上の主要時間足の一目均衡表をプロットします。
これにより、上位時間足を常に意識した立ち回りとなります。

MTF-COLORFUL_PivotsIt's a pivot indicator that can analyze multiple time frames at once. Use it as a hint to validate SR-ZONE.


MTF H/L RangeThis indicator will let you have multiple timeframe support and resistance levels on any timeframe!

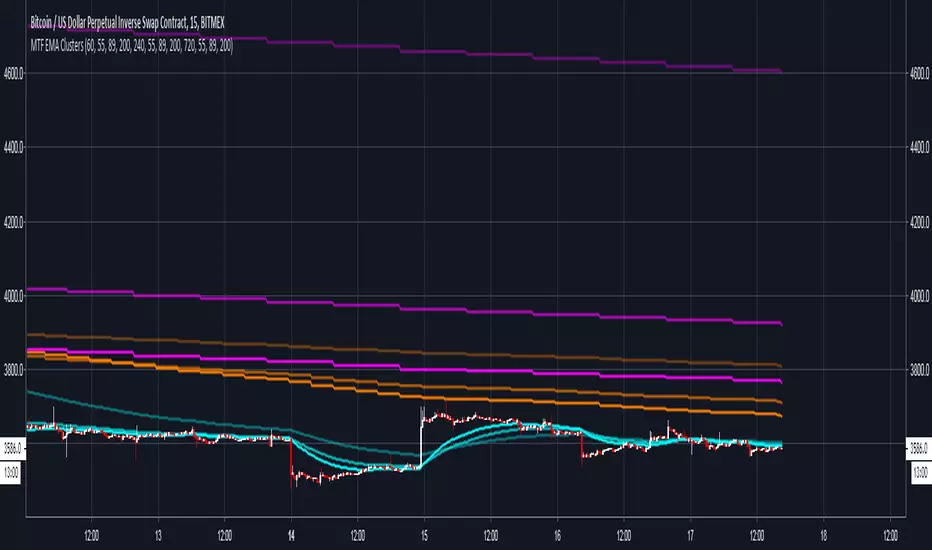
MTF EMA ClustersThis indicator can display three different timeframe EMA clusters simultaneously.
The default timeframe of three EMA clusters is 1 hour, 4 hours, 12 hours, and each EMA cluster contains three lines: ema55, ema89 and ema200, respectively.
In addition, this script supplys user to customize EMA cluster 1 whether to use the current timeframe and whether to display EMA cluster 2 and EMA cluster 3.
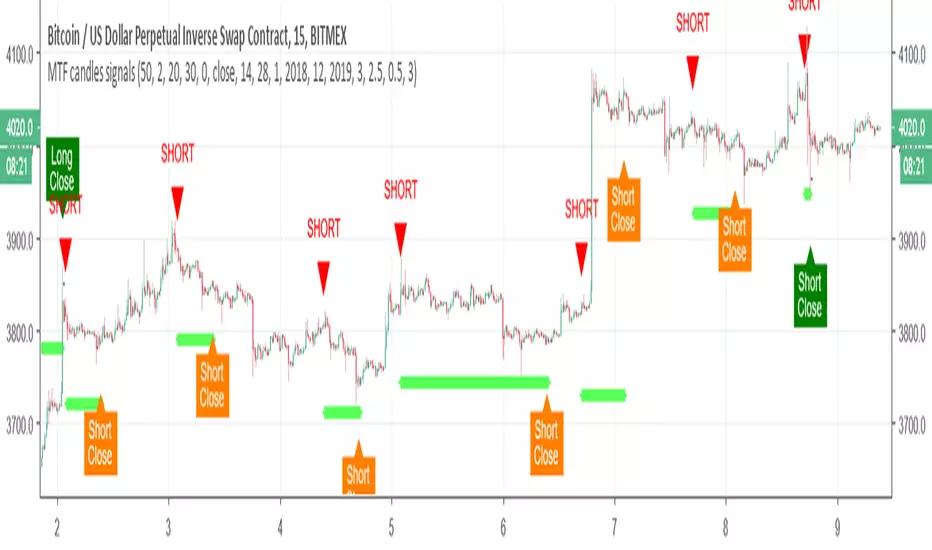
MTF candles by yatrader2 signalsthis is the signal version of this study
alerts included
for more detail look at original study
MTF Candles - RyanLeeFX.comMultiple Time Frame Candles is a unique script that allows traders to quickly and easily analyze price action candles across multiple time frames all from one chart. Multiple Time Frame Candles eliminates the need for price action traders to change chart time frames when trying to analyze multiple time frames. With this script, traders can easily see the candles from a lower time frame inside candles from a higher time frame.
For example, traders can see 1 Hour candles inside Daily candles. Or 5 Min candles inside Hourly candles. Or Daily candles inside Weekly candles. Or Hourly candles inside Daily candles inside Weekly candles. The options for comparing multiple time frame candles on one screen are almost limitless.
This script differs from other Multiple Time Frame Candle scripts by displaying the open, high, low and close of the larger time frame candle as well as highlighting the close price due to its proven importance.
The ability to quickly analyze multiple time frames from a single chart will make you more confident in your trades as well as save you valuable time during your analysis.
Multiple Time Frame Candles is also an amazing script to help beginning to experienced traders better visualize price movement across multiple time frames all from a single chart.

MTF SMAThis script overcomes the issues with TV multitimeframe being wrong due to its bugs. It generates higher timeframe SMA on a lower timeframe chart. Enter the number of minutes of the higher timeframe as a setting.
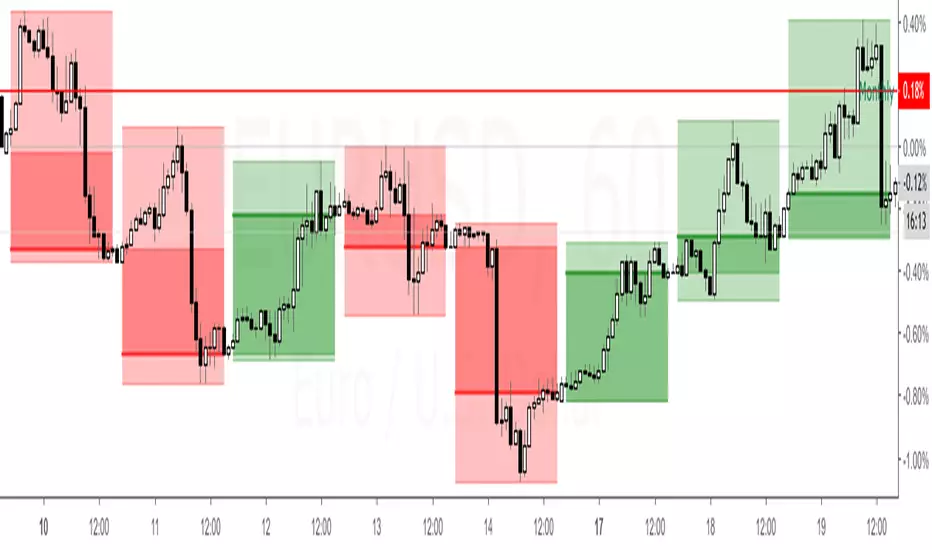
MTF Deviation - Mtrl_ScientistHi everyone,
There are a lot of possible ways to look at markets and find valid patterns.
This time, I've looked at how shorter time frames deviate from the overall price consensus.
What you're seeing here is a range-bound difference of the lowest time frame from the overall price consensus (baseline), represented as blue line.
When lower time frames agree with the baseline, the difference becomes 0.
Logically, this difference cannot deviate too much from the baseline, and to quantify that, I've added fib-levels based on a deviation percentage that depends on price volatility and can be adjusted in the settings.
How it works:
First of all, you need to switch to the 1min time frame to get access to the lowest time frame data.
Look at how the blue line follows the support/resistance fib levels.
Oversold conditions are usually given by entering the lowest red band, whereas overbought conditions are given by entering the upper red band.
However, there are also extreme cases, where the blue line exceeds the set fib levels. In that case, price will reverse with very high likelihood.
Alternatively you can also ping-pong between two fib levels for frequent small trades.
Note that this indicator doesn't use any security functions to access time frame data. Instead, I found a different way to avoid repainting.
At the moment I'm just playing around with this to see how I can improve it. Feedback is very welcome!

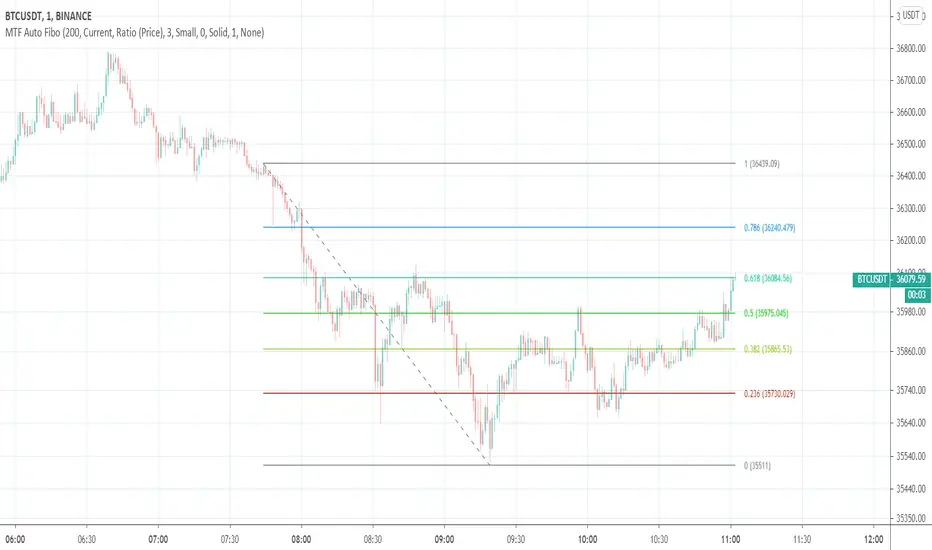
MTF Auto Fibonacci LevelsDear traders,
It is time to diversify and to "fibonaccify" my developer experience.
On the preview you can see the daily chart with fibo levels from 3h timeframe.
Features
24 Fibonacci levels
24 timeframes
Ability to customize levels
Ability to specify a preferred timeframe
Supported levels
0
0.236
0.382
0.5
0.618
0.786
1
1.272
1.414
1.618
2
2.272
2.414
2.618
3
3.272
3.414
3.618
4
4.236
4.272
4.414
4.618
4.764
Supported resolutions
"1"
"3"
"5"
"10"
"15"
"30"
"45"
"60"
"120"
"180"
"240"
"300"
"360"
"420"
"480"
"540"
"600"
"660"
"720"
"D"
"2D"
"3D"
"W"
"M"
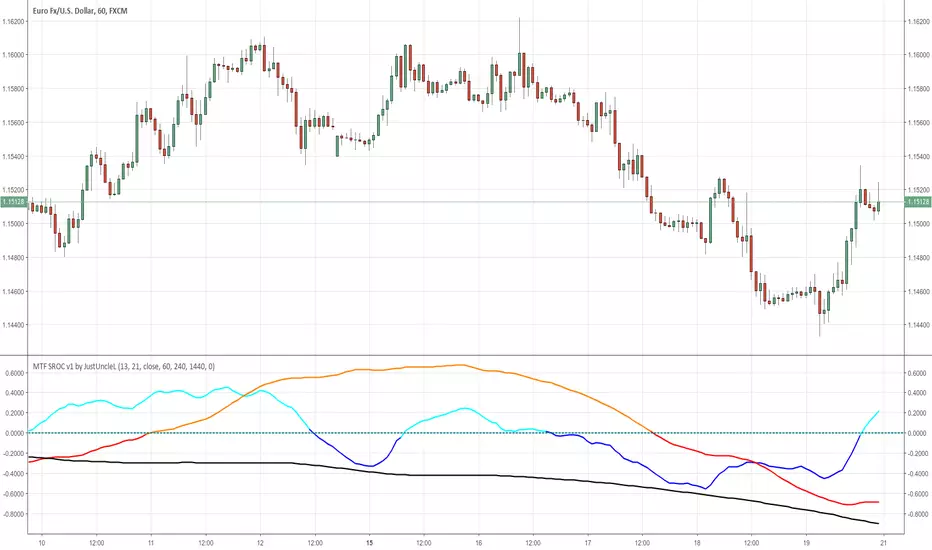
MTF SROC v1 by JustUncleLDescription:
This study plots Smoothed Rate of Change (SROC) indicators for up to 4 different time frames. The indicator does not use higher time frame data, so will not re-paint. The SROC is a momentum indicator and can be used in ranging or trending markets, please refer to the reference for further details of how to use the indicators.
References:
www.incrediblecharts.com

MTF MAA multi timeframe version of the SMA.
You can select one of the proposed timeframes in the input box or you can modify the code at line 5 :
>>>
>>> tf = input("D", title = "TimeFrame", type = resolution)
>>>
Change the D by your desired timeframe => 1, 7, 555 (minutes up to 1440) => D, 2D... => W, 2W... => M, 2M....
