Crypto Options Greeks & Volatility Analyzer [BackQuant]Crypto Options Greeks & Volatility Analyzer
Overview
The Crypto Options Greeks & Volatility Analyzer is a comprehensive analytical tool that calculates Black-Scholes option Greeks up to the third order for Bitcoin and Ethereum options. It integrates implied volatility data from VOLMEX indices and provides multiple visualization layers for options risk analysis.
Quick Introduction to Options Trading
Options are financial derivatives that give the holder the right, but not the obligation, to buy or sell an underlying asset at a predetermined price (strike price) within a specific time period (expiration date). Understanding options requires grasping two fundamental concepts:
Call Options : Give the right to buy the underlying asset at the strike price. Calls increase in value when the underlying price rises above the strike price.
Put Options : Give the right to sell the underlying asset at the strike price. Puts increase in value when the underlying price falls below the strike price.
The Language of Options: Greeks
Options traders use "Greeks" - mathematical measures that describe how an option's price changes in response to various factors:
Delta : How much the option price moves for each $1 change in the underlying
Gamma : How fast delta changes as the underlying moves
Theta : Daily time decay - how much value erodes each day
Vega : Sensitivity to implied volatility changes
Rho : Sensitivity to interest rate changes
These Greeks are essential for understanding risk. Just as a pilot needs instruments to fly safely, options traders need Greeks to navigate market conditions and manage positions effectively.
Why Volatility Matters
Implied volatility (IV) represents the market's expectation of future price movement. High IV means:
Options are more expensive (higher premiums)
Market expects larger price swings
Better for option sellers
Low IV means:
Options are cheaper
Market expects smaller moves
Better for option buyers
This indicator helps you visualize and quantify these critical concepts in real-time.
Back to the Indicator
Key Features & Components
1. Complete Greeks Calculations
The indicator computes all standard Greeks using the Black-Scholes-Merton model adapted for cryptocurrency markets:
First Order Greeks:
Delta (Δ) : Measures the rate of change of option price with respect to underlying price movement. Ranges from 0 to 1 for calls and -1 to 0 for puts.
Vega (ν) : Sensitivity to implied volatility changes, expressed as price change per 1% change in IV.
Theta (Θ) : Time decay measured in dollars per day, showing how much value erodes with each passing day.
Rho (ρ) : Interest rate sensitivity, measuring price change per 1% change in risk-free rate.
Second Order Greeks:
Gamma (Γ) : Rate of change of delta with respect to underlying price, indicating how quickly delta will change.
Vanna : Cross-derivative measuring delta's sensitivity to volatility changes and vega's sensitivity to price changes.
Charm : Delta decay over time, showing how delta changes as expiration approaches.
Vomma (Volga) : Vega's sensitivity to volatility changes, important for volatility trading strategies.
Third Order Greeks:
Speed : Rate of change of gamma with respect to underlying price (∂Γ/∂S).
Zomma : Gamma's sensitivity to volatility changes (∂Γ/∂σ).
Color : Gamma decay over time (∂Γ/∂T).
Ultima : Third-order volatility sensitivity (∂²ν/∂σ²).
2. Implied Volatility Analysis
The indicator includes a sophisticated IV ranking system that analyzes current implied volatility relative to its recent history:
IV Rank : Percentile ranking of current IV within its 30-day range (0-100%)
IV Percentile : Percentage of days in the lookback period where IV was lower than current
IV Regime Classification : Very Low, Low, High, or Very High
Color-Coded Headers : Visual indication of volatility regime in the Greeks table
Trading regime suggestions based on IV rank:
IV Rank > 75%: "Favor selling options" (high premium environment)
IV Rank 50-75%: "Neutral / Sell spreads"
IV Rank 25-50%: "Neutral / Buy spreads"
IV Rank < 25%: "Favor buying options" (low premium environment)
3. Gamma Zones Visualization
Gamma zones display horizontal price levels where gamma exposure is highest:
Purple horizontal lines indicate gamma concentration areas
Opacity scaling : Darker shading represents higher gamma values
Percentage labels : Shows gamma intensity relative to ATM gamma
Customizable zones : 3-10 price levels can be analyzed
These zones are critical for understanding:
Pin risk around expiration
Potential for explosive price movements
Optimal strike selection for gamma trading
Market maker hedging flows
4. Probability Cones (Expected Move)
The probability cones project expected price ranges based on current implied volatility:
1 Standard Deviation (68% probability) : Shown with dashed green/red lines
2 Standard Deviations (95% probability) : Shown with dotted green/red lines
Time-scaled projection : Cones widen as expiration approaches
Lognormal distribution : Accounts for positive skew in asset prices
Applications:
Strike selection for credit spreads
Identifying high-probability profit zones
Setting realistic price targets
Risk management for undefined risk strategies
5. Breakeven Analysis
The indicator plots key price levels for options positions:
White line : Strike price
Green line : Call breakeven (Strike + Premium)
Red line : Put breakeven (Strike - Premium)
These levels update dynamically as option premiums change with market conditions.
6. Payoff Structure Visualization
Optional P&L labels display profit/loss at expiration for various price levels:
Shows P&L at -2 sigma, -1 sigma, ATM, +1 sigma, and +2 sigma price levels
Separate calculations for calls and puts
Helps visualize option payoff diagrams directly on the chart
Updates based on current option premiums
Configuration Options
Calculation Parameters
Asset Selection : BTC or ETH (limited by VOLMEX IV data availability)
Expiry Options : 1D, 7D, 14D, 30D, 60D, 90D, 180D
Strike Mode : ATM (uses current spot) or Custom (manual strike input)
Risk-Free Rate : Adjustable annual rate for discounting calculations
Display Settings
Greeks Display : Toggle first, second, and third-order Greeks independently
Visual Elements : Enable/disable probability cones, gamma zones, P&L labels
Table Customization : Position (6 options) and text size (4 sizes)
Price Levels : Show/hide strike and breakeven lines
Technical Implementation
Data Sources
Spot Prices : INDEX:BTCUSD and INDEX:ETHUSD for underlying prices
Implied Volatility : VOLMEX:BVIV (Bitcoin) and VOLMEX:EVIV (Ethereum) indices
Real-Time Updates : All calculations update with each price tick
Mathematical Framework
The indicator implements the full Black-Scholes-Merton model:
Standard normal distribution approximations using Abramowitz and Stegun method
Proper annualization factors (365-day year)
Continuous compounding for interest rate calculations
Lognormal price distribution assumptions
Alert Conditions
Four categories of automated alerts:
Price-Based : Underlying crossing strike price
Gamma-Based : 50% surge detection for explosive moves
Moneyness : Deep ITM alerts when |delta| > 0.9
Time/Volatility : Near expiration and vega spike warnings
Practical Applications
For Options Traders
Monitor all Greeks in real-time for active positions
Identify optimal entry/exit points using IV rank
Visualize risk through probability cones and gamma zones
Track time decay and plan rolls
For Volatility Traders
Compare IV across different expiries
Identify mean reversion opportunities
Monitor vega exposure across strikes
Track higher-order volatility sensitivities
Conclusion
The Crypto Options Greeks & Volatility Analyzer transforms complex mathematical models into actionable visual insights. By combining institutional-grade Greeks calculations with intuitive overlays like probability cones and gamma zones, it bridges the gap between theoretical options knowledge and practical trading application.
Whether you're:
A directional trader using options for leverage
A volatility trader capturing IV mean reversion
A hedger managing portfolio risk
Or simply learning about options mechanics
This tool provides the quantitative foundation needed for informed decision-making in cryptocurrency options markets.
Remember that options trading involves substantial risk and complexity. The Greeks and visualizations provided by this indicator are tools for analysis - they should be combined with proper risk management, position sizing, and a thorough understanding of options strategies.
As crypto options markets continue to mature and grow, having professional-grade analytics becomes increasingly important. This indicator ensures you're equipped with the same analytical capabilities used by institutional traders, adapted specifically for the unique characteristics of 24/7 cryptocurrency markets.
Search in scripts for "order"

Long/Short/Exit/Risk management Strategy # LongShortExit Strategy Documentation
## Overview
The LongShortExit strategy is a versatile trading system for TradingView that provides complete control over entry, exit, and risk management parameters. It features a sophisticated framework for managing long and short positions with customizable profit targets, stop-loss mechanisms, partial profit-taking, and trailing stops. The strategy can be enhanced with continuous position signals for visual feedback on the current trading state.
## Key Features
### General Settings
- **Trading Direction**: Choose to trade long positions only, short positions only, or both.
- **Max Trades Per Day**: Limit the number of trades per day to prevent overtrading.
- **Bars Between Trades**: Enforce a minimum number of bars between consecutive trades.
### Session Management
- **Session Control**: Restrict trading to specific times of the day.
- **Time Zone**: Specify the time zone for session calculations.
- **Expiration**: Optionally set a date when the strategy should stop executing.
### Contract Settings
- **Contract Type**: Select from common futures contracts (MNQ, MES, NQ, ES) or custom values.
- **Point Value**: Define the dollar value per point movement.
- **Tick Size**: Set the minimum price movement for accurate calculations.
### Visual Signals
- **Continuous Position Signals**: Implement 0 to 1 visual signals to track position states.
- **Signal Plotting**: Customize color and appearance of position signals.
- **Clear Visual Feedback**: Instantly see when entry conditions are triggered.
### Risk Management
#### Stop Loss and Take Profit
- **Risk Type**: Choose between percentage-based, ATR-based, or points-based risk management.
- **Percentage Mode**: Set SL/TP as a percentage of entry price.
- **ATR Mode**: Set SL/TP as a multiple of the Average True Range.
- **Points Mode**: Set SL/TP as a fixed number of points from entry.
#### Advanced Exit Features
- **Break-Even**: Automatically move stop-loss to break-even after reaching specified profit threshold.
- **Trailing Stop**: Implement a trailing stop-loss that follows price movement at a defined distance.
- **Partial Profit Taking**: Take partial profits at predetermined price levels:
- Set first partial exit point and percentage of position to close
- Set second partial exit point and percentage of position to close
- **Time-Based Exit**: Automatically exit a position after a specified number of bars.
#### Win/Loss Streak Management
- **Streak Cutoff**: Automatically pause trading after a series of consecutive wins or losses.
- **Daily Reset**: Option to reset streak counters at the start of each day.
### Entry Conditions
- **Source and Value**: Define the exact price source and value that triggers entries.
- **Equals Condition**: Entry signals occur when the source exactly matches the specified value.
### Performance Analytics
- **Real-Time Stats**: Track important performance metrics like win rate, P&L, and largest wins/losses.
- **Visual Feedback**: On-chart markers for entries, exits, and important events.
### External Integration
- **Webhook Support**: Compatible with TradingView's webhook alerts for automated trading.
- **Cross-Platform**: Connect to external trading systems and notification platforms.
- **Custom Order Execution**: Implement advanced order flows through external services.
## How to Use
### Setup Instructions
1. Add the script to your TradingView chart.
2. Configure the general settings based on your trading preferences.
3. Set session trading hours if you only want to trade specific times.
4. Select your contract specifications or customize for your instrument.
5. Configure risk parameters:
- Choose your preferred risk management approach
- Set appropriate stop-loss and take-profit levels
- Enable advanced features like break-even, trailing stops, or partial profit taking as needed
6. Define entry conditions:
- Select the price source (such as close, open, high, or an indicator)
- Set the specific value that should trigger entries
### Entry Condition Examples
- **Example 1**: To enter when price closes exactly at a whole number:
- Long Source: close
- Long Value: 4200 (for instance, to enter when price closes exactly at 4200)
- **Example 2**: To enter when an indicator reaches a specific value:
- Long Source: ta.rsi(close, 14)
- Long Value: 30 (triggers when RSI equals exactly 30)
### Best Practices
1. **Always backtest thoroughly** before using in live trading.
2. **Start with conservative risk settings**:
- Small position sizes
- Reasonable stop-loss distances
- Limited trades per day
3. **Monitor and adjust**:
- Use the performance table to track results
- Adjust parameters based on how the strategy performs
4. **Consider market volatility**:
- Use ATR-based stops during volatile periods
- Use fixed points during stable markets
## Continuous Position Signals Implementation
The LongShortExit strategy can be enhanced with continuous position signals to provide visual feedback about the current position state. These signals can help you track when the strategy is in a long or short position.
### Adding Continuous Position Signals
Add the following code to implement continuous position signals (0 to 1):
```pine
// Continuous position signals (0 to 1)
var float longSignal = 0.0
var float shortSignal = 0.0
// Update position signals based on your indicator's conditions
longSignal := longCondition ? 1.0 : 0.0
shortSignal := shortCondition ? 1.0 : 0.0
// Plot continuous signals
plot(longSignal, title="Long Signal", color=#00FF00, linewidth=2, transp=0, style=plot.style_line)
plot(shortSignal, title="Short Signal", color=#FF0000, linewidth=2, transp=0, style=plot.style_line)
```
### Benefits of Continuous Position Signals
- Provides clear visual feedback of current position state (long/short)
- Signal values stay consistent (0 or 1) until condition changes
- Can be used for additional calculations or alert conditions
- Makes it easier to track when entry conditions are triggered
### Using with Custom Indicators
You can adapt the continuous position signals to work with any custom indicator by replacing the condition with your indicator's logic:
```pine
// Example with moving average crossover
longSignal := fastMA > slowMA ? 1.0 : 0.0
shortSignal := fastMA < slowMA ? 1.0 : 0.0
```
## Webhook Integration
The LongShortExit strategy is fully compatible with TradingView's webhook alerts, allowing you to connect your strategy to external trading platforms, brokers, or custom applications for automated trading execution.
### Setting Up Webhooks
1. Create an alert on your chart with the LongShortExit strategy
2. Enable the "Webhook URL" option in the alert dialog
3. Enter your webhook endpoint URL (from your broker or custom trading system)
4. Customize the alert message with relevant information using TradingView variables
### Webhook Message Format Example
```json
{
"strategy": "LongShortExit",
"action": "{{strategy.order.action}}",
"price": "{{strategy.order.price}}",
"quantity": "{{strategy.position_size}}",
"time": "{{time}}",
"ticker": "{{ticker}}",
"position_size": "{{strategy.position_size}}",
"position_value": "{{strategy.position_value}}",
"order_id": "{{strategy.order.id}}",
"order_comment": "{{strategy.order.comment}}"
}
```
### TradingView Alert Condition Examples
For effective webhook automation, set up these alert conditions:
#### Entry Alert
```
{{strategy.position_size}} != {{strategy.position_size}}
```
#### Exit Alert
```
{{strategy.position_size}} < {{strategy.position_size}} or {{strategy.position_size}} > {{strategy.position_size}}
```
#### Partial Take Profit Alert
```
strategy.order.comment contains "Partial TP"
```
### Benefits of Webhook Integration
- **Automated Trading**: Execute trades automatically through supported brokers
- **Cross-Platform**: Connect to custom trading bots and applications
- **Real-Time Notifications**: Receive trade signals on external platforms
- **Data Collection**: Log trade data for further analysis
- **Custom Order Management**: Implement advanced order types not available in TradingView
### Compatible External Applications
- Trading bots and algorithmic trading software
- Custom order execution systems
- Discord, Telegram, or Slack notification systems
- Trade journaling applications
- Risk management platforms
### Implementation Recommendations
- Test webhook delivery using a free service like webhook.site before connecting to your actual trading system
- Include authentication tokens or API keys in your webhook URL or payload when required by your external service
- Consider implementing confirmation mechanisms to verify trade execution
- Log all webhook activities for troubleshooting and performance tracking
## Strategy Customization Tips
### For Scalping
- Set smaller profit targets (1-3 points)
- Use tighter stop-losses
- Enable break-even feature after small profit
- Set higher max trades per day
### For Day Trading
- Use moderate profit targets
- Implement partial profit taking
- Enable trailing stops
- Set reasonable session trading hours
### For Swing Trading
- Use longer-term charts
- Set wider stops (ATR-based often works well)
- Use higher profit targets
- Disable daily streak reset
## Common Troubleshooting
### Low Win Rate
- Consider widening stop-losses
- Verify that entry conditions aren't triggering too frequently
- Check if the equals condition is too restrictive; consider small tolerances
### Missing Obvious Trades
- The equals condition is extremely precise. Price must exactly match the specified value.
- Consider using floating-point precision for more reliable triggers
### Frequent Stop-Outs
- Try ATR-based stops instead of fixed points
- Increase the stop-loss distance
- Enable break-even feature to protect profits
## Important Notes
- The exact equals condition is strict and may result in fewer trade signals compared to other conditions.
- For instruments with decimal prices, exact equality might be rare. Consider the precision of your value.
- Break-even and trailing stop calculations are based on points, not percentage.
- Partial take-profit levels are defined in points distance from entry.
- The continuous position signals (0 to 1) provide valuable visual feedback but don't affect the strategy's trading logic directly.
- When implementing continuous signals, ensure they're aligned with the actual entry conditions used by the strategy.
---
*This strategy is for educational and informational purposes only. Always test thoroughly before using with real funds.*

Polarity-VoVix Fusion Index (PVFI) Polarity-VoVix Fusion Index (PVFI) - Order Flow and Volatility Regime Detector
The PVFI is a next-generation indicator that fuses the Order Flow Polarity Index (OFPI) with a proprietary VoVix Volume Delta (VVD) engine. This tool is designed for traders who want to see not just how much volume is trading, but who is in control and how volatility is shifting beneath the surface.
What Makes PVFI Standout from the rest?
- Dual Engine: PVFI combines two advanced signals:
* OFPI: Measures real-time buy/sell pressure using candle body position and volume, then smooths it with a T3 moving average for clarity and responsiveness.
* VVD: Captures the "volatility of volume delta" - a normalized, memory-boosted measure of aggressive buying/selling, with a custom non-linear clamp for organic, non-pegged signals.
- Visual Clarity: Neon-glow OFPI line and shadowed, color-gradient VVD area make regime shifts and momentum instantly visible.
- Adaptive Dashboard: Toggle between a full-featured dashboard (desktop) and a compact info line (mobile) for seamless use on any device.
- Universal: Works on any asset - crypto, stocks, futures, forex - and any timeframe.
- No Chart Clutter: Clean, modern visuals and toggles for a pro look.
Inputs:
OFPI Lookback Length (ofpi_len): Sets the window for order flow pressure calculation. Shorter = more sensitive, longer = smoother. For scalping, try 5-10. For swing trading, 15-30. Crypto often benefits from shorter windows due to volatility.
OFPI T3 Smoothing Length (t3_len): Controls the smoothness of the OFPI line. Lower = more responsive, higher = smoother. Use 3-7 for fast markets, 8-15 for slow or higher timeframes.
OFPI T3 Volume Factor (t3_vf): Adjusts the T3’s sensitivity. Higher = more responsive, lower = more stable. 0.6-0.8 is typical. Raise for more “snappy” signals, lower for less noise.
VVD Delta Lookback (delta_len): Sets the window for VVD’s volume delta calculation. 10-20 for most assets. Shorter for high-volatility, longer for slow markets.
VVD Volatility Normalization Length (vol_norm_len): Normalizes VVD by recent volume. 15-30 is typical. Use higher for assets with wild volume swings.
VVD Momentum Memory (momentum_mem): Adds a “memory” boost to VVD, amplifying persistent buying/selling. 2-5 is common. Lower for choppy markets, higher for trending.
Show Dashboard (showDash): Toggles the full dashboard table (best for desktop). Turn off for a minimalist or mobile setup.
Show Compact Info Line (showInfoLabel): Toggles a single-line info label (best for mobile). Turn on for mobile or minimalist setups.
How PVFI Works:
- OFPI Calculation: Splits each candle’s volume into buy/sell pressure based on where the close is within the range. Aggregates over your chosen lookback, then smooths with a T3 moving average for a neon, lag-minimized signal.
- VVD Calculation: Measures the “aggression” of volume (body-weighted), normalizes by recent volume, and applies a memory boost for persistent trends. Uses a custom tanh clamp for a natural, non-pegged range.
- Visuals: OFPI is plotted as a neon line (with glow). VVD is a color-gradient area with a soft shadow, instantly showing regime shifts.
- Dashboard/Info Line: Desktop: Full dashboard with all key stats, color-coded and branded. Mobile: Compact info line with arrows for quick reads.
How you'll use PVFI:
- Bullish OFPI (Teal Neon, Up Arrow): Buyers are dominating. Look for breakouts, trend continuations, or confirmation with your own system.
- Bearish OFPI (Green Neon, Down Arrow): Sellers are in control. Watch for breakdowns or short setups.
- VVD Positive (Teal Area): Aggressive buying is increasing. Confirm with price action.
- VVD Negative (Purple Area): Aggressive selling is increasing. Use for risk management or short bias.
- Neutral/Flat: Market is balanced or indecisive. Consider waiting for a clear regime shift.
- Dashboard/Info Line: Use the dashboard for full context, or the info line for a quick glance on mobile.
Tips:
- For scalping, use lower lookbacks and smoothing.
- For swing trading, increase lookbacks and smoothing for stability.
- Works on all assets and timeframes - tune to your style.
Why PVFI is Unique:
- Fusion of Order Flow and Volatility: No other indicator combines body-based order flow with a volatility-of-volume delta, both visualized with modern, pro-grade graphics.
- Adaptive, Not Static: PVFI adapts to market regime, not just price movement.
- Mobile-Ready: Dashboard and info line toggles for any device.
- No Chart Clutter: Clean, color-coded, and easy to read.
For Educational Use Only
PVFI is a research and educational tool, not financial advice. Always use proper risk management and combine with your own strategy.
Trade with clarity. Trade with edge.
— Dskyz , for DAFE Trading Systems

VWAP Predictive Breakout + RSI + OB + Trend/Chop📈 VWAP Predictive Breakout + RSI + Order Blocks + Trend/Chop Filter
This multi-layered day trading and scalping tool is designed to predict price direction after a VWAP breakout, rather than react to it. It combines volume, RSI, candlestick structure, order blocks, and trend/chop analysis to improve the accuracy of intraday signals.
🔍 Core Features
VWAP Predictive Breakout
Signals are generated when price breaks above/below VWAP with strength (volume spike + strong candle body), supported by trend confirmation.
RSI Momentum Filter
Uses RSI divergence behavior to validate breakouts, filtering out weak or exhausted moves.
Order Block Detection
Marks bullish and bearish engulfing patterns and checks for proximity to these zones as confirmation for breakouts.
Trend vs Chop Detection
Uses ADX, ATR, EMA distance, Bollinger Band width, and candlestick cleanliness to dynamically identify whether the market is trending or choppy.
Clean Candle Behavior
Filters out noisy or indecisive candles by analyzing wick-to-body ratio and ATR-based body size.
📌 Visual Markers
🟢 Buy Signal: Green triangle below bar
🔴 Sell Signal: Red triangle above bar
🟢⚪ Bullish Order Block: Green circle
🔴⚪ Bearish Order Block: Red circle
🟩 Trending Background: Light green
🟥 Choppy Background: Light red
🛎 Alerts Included
Long signal: VWAP breakout + RSI + Order Block + Clean Candle
Short signal: VWAP breakdown + RSI + Order Block + Clean Candle
🧠 Best Use Cases
Scalping high-probability VWAP reversals or continuations
Day trading in markets where trend clarity is critical
Filtering noise in sideways conditions using real-time chop detection

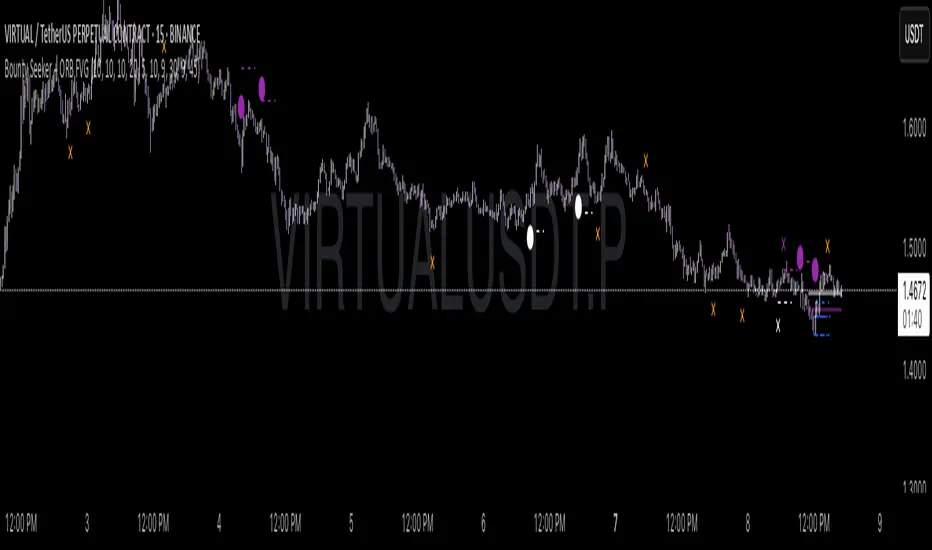
Bounty SeekerBounty Seeker - Advanced Market Structure & Order Block Detection
A sophisticated indicator that identifies high-probability reversal zones through the analysis of market structure, volume patterns, and institutional order blocks. This tool helps traders spot potential reversals and fake-outs with precision.
Core Components:
1. Pivot Detection System
• Smart pivot high/low identification
• Volume-enhanced confirmation
• RSI confluence validation
• Real-time market structure analysis
2. Order Block Detection
• Institutional buying/selling zones
• Historical support/resistance levels
• Smart volume threshold analysis
• Dynamic level adaptation
Signal Types:
1. Bull Pivots (White X)
• Strong volume confirmation
• RSI oversold conditions
• Price action validation
• Order block confluence
2. Bear Pivots (Purple X)
• Volume surge confirmation
• RSI overbought alignment
• Bearish price action
• Resistance zone validation
3. Fake Pivots (Orange X)
• Low volume warning signals
• Trap zone identification
• False breakout detection
• Risk management guide
Visual Elements:
• Dashed Lines: Order block zones
• White/Purple X's: Major pivot points
• Orange X's: Potential fake moves
• Dynamic support/resistance levels
Best Usage Practices:
• Most effective on 1H+ timeframes
• Focus on major market pairs
• Wait for complete signal formation
• Combine with trend direction
• Monitor volume confirmation
• Use proper position sizing
The indicator excels at:
1. Identifying potential reversal zones
2. Detecting institutional order blocks
3. Warning of potential fake moves
4. Providing clear entry/exit levels
5. Highlighting strong volume zones
Risk Management:
• Always wait for signal confirmation
• Use appropriate stop loss levels
• Consider multiple timeframe analysis
• Don't trade against major trends
• Monitor volume for validation
This indicator combines advanced market structure analysis with volume profiling to help traders identify high-probability trading opportunities while warning of potential traps and fake-outs.
Note: Past performance does not guarantee future results. Always use proper risk management techniques.
02 SMC + BB Breakout (Improved)This strategy combines Smart Money Concepts (SMC) with Bollinger Band breakouts to identify potential trading opportunities. SMC focuses on identifying key price levels and market structure shifts, while Bollinger Bands help pinpoint overbought/oversold conditions and potential breakout points. The strategy also incorporates higher timeframe trend confirmation to filter out trades that go against the prevailing trend.
Key Components:
Bollinger Bands:
Calculated using a Simple Moving Average (SMA) of the closing price and a standard deviation multiplier.
The strategy uses the upper and lower bands to identify potential breakout points.
The SMA (basis) acts as a centerline and potential support/resistance level.
The fill between the upper and lower bands can be toggled by the user.
Higher Timeframe Trend Confirmation:
The strategy allows for optional confirmation of the current trend using a higher timeframe (e.g., daily).
It calculates the SMA of the higher timeframe's closing prices.
A bullish trend is confirmed if the higher timeframe's closing price is above its SMA.
This helps filter out trades that go against the prevailing long-term trend.
Smart Money Concepts (SMC):
Order Blocks:
Simplified as recent price clusters, identified by the highest high and lowest low over a specified lookback period.
These levels are considered potential areas of support or resistance.
Liquidity Zones (Swing Highs/Lows):
Identified by recent swing highs and lows, indicating areas where liquidity may be present.
The Swing highs and lows are calculated based on user defined lookback periods.
Market Structure Shift (MSS):
Identifies potential changes in market structure.
A bullish MSS occurs when the closing price breaks above a previous swing high.
A bearish MSS occurs when the closing price breaks below a previous swing low.
The swing high and low values used for the MSS are calculated based on the user defined swing length.
Entry Conditions:
Long Entry:
The closing price crosses above the upper Bollinger Band.
If higher timeframe confirmation is enabled, the higher timeframe trend must be bullish.
A bullish MSS must have occurred.
Short Entry:
The closing price crosses below the lower Bollinger Band.
If higher timeframe confirmation is enabled, the higher timeframe trend must be bearish.
A bearish MSS must have occurred.
Exit Conditions:
Long Exit:
The closing price crosses below the Bollinger Band basis.
Or the Closing price falls below 99% of the order block low.
Short Exit:
The closing price crosses above the Bollinger Band basis.
Or the closing price rises above 101% of the order block high.
Position Sizing:
The strategy calculates the position size based on a fixed percentage (5%) of the strategy's equity.
This helps manage risk by limiting the potential loss per trade.
Visualizations:
Bollinger Bands (upper, lower, and basis) are plotted on the chart.
SMC elements (order blocks, swing highs/lows) are plotted as lines, with user-adjustable visibility.
Entry and exit signals are plotted as shapes on the chart.
The Bollinger band fill opacity is adjustable by the user.
Trading Logic:
The strategy aims to capitalize on Bollinger Band breakouts that are confirmed by SMC signals and higher timeframe trend. It looks for breakouts that align with potential market structure shifts and key price levels (order blocks, swing highs/lows). The higher timeframe filter helps avoid trades that go against the overall trend.
In essence, the strategy attempts to identify high-probability breakout trades by combining momentum (Bollinger Bands) with structural analysis (SMC) and trend confirmation.
Key User-Adjustable Parameters:
Bollinger Bands Length
Standard Deviation Multiplier
Higher Timeframe
Higher Timeframe Confirmation (on/off)
SMC Elements Visibility (on/off)
Order block lookback length.
Swing lookback length.
Bollinger band fill opacity.
This detailed description should provide a comprehensive understanding of the strategy's logic and components.
***DISCLAIMER: This strategy is for educational purposes only. It is not financial advice. Past performance is not indicative of future results. Use at your own risk. Always perform thorough backtesting and forward testing before using any strategy in live trading.***

IU Smart Flow SystemDESCRIPTION
The IU Smart Flow System is a powerful and dynamic order flow-based strategy designed to capture high-probability trades by analyzing bullish and bearish imbalances, trend direction, and RSI strength. It identifies trading opportunities by aligning order flow conditions with the prevailing trend and momentum, making it suitable for trend-following and momentum-based trading.
This system utilizes a unique combination of:
- Order flow score to gauge market imbalance
- Trend filter using SMA and ATR to confirm market direction
- RSI to ensure entry only during strong momentum
USER INPUTS:
- Imbalance Length: Defines the lookback period for calculating bullish and bearish imbalances. (Default: 10)
- Trend Length: Determines the length of the SMA to evaluate the trend direction. (Default: 50)
- RSI Length: Specifies the RSI period to assess momentum strength. (Default: 14)
LONG CONDITIONS:
Long entries are triggered when:
- Order flow score is positive, indicating bullish imbalance
- Price is above the bullish trend level (SMA + ATR), confirming an uptrend
- RSI is above 50, indicating bullish momentum
- No active short position is currently open
SHORT CONDITIONS:
Short entries are triggered when:
- Order flow score is negative, indicating bearish imbalance
- Price is below the bearish trend level (SMA - ATR), confirming a downtrend
- RSI is below 50, indicating bearish momentum
- No active long position is currently open
WHY IT IS UNIQUE:
- Imbalance-Based Approach: Unlike traditional strategies that rely solely on price action, this system evaluates bullish and bearish imbalances to anticipate order flow direction.
- Adaptive Trend Filter: The combination of SMA and ATR dynamically adjusts to market volatility, providing a reliable trend confirmation mechanism.
- Momentum Validation with RSI: Ensures that entries are taken only in the direction of strong momentum, reducing false signals.
HOW USERS CAN BENEFIT FROM IT:
- Enhanced Trade Accuracy: Aligning order flow, trend, and momentum reduces false signals and improves trade success rates.
- Versatile Application: Suitable for various markets and timeframes, making it adaptable to different trading styles.
- Clear Trade Signals: Provides clear entry labels and alerts, ensuring traders never miss a potential opportunity.
- Visual Clarity: The filled region between bullish and bearish trends highlights trend direction, enhancing decision-making.

Psych LevelWhat it shows:
This indicator will show a horizontal line at a psychological value which can be user defined. (Psychological values are round numbers, like 10,50,100,1000 and so on...)
At these Psychological value there are often limit orders placed for both buying and selling and can often act as support and resistances.
Therefore it is useful to pre-draw these levels beforehand and this indicator will speed up the process doing so by adjusting few different settings and draw them automatically.
How to use it:
At these Psychological value there are often limit orders placed for both buying and selling and can often act as support and resistances. This is often the case when you look at limit orders at such levels on bookmap or level 2 data.
At these psychological levels it can be set as a target of your trade or as risk levels when taking a trade in either of direction. Obviously this alone shouldn't dictate the trade you should take but can be a valuable info to supplement your trade.
On the chart it is clear to see these psychological level lines are acting as resistances/supports.
Key settings:
Interval: Interval levels will be drawn for, between the minimum and maximum values inputted by the user. Minimum value allowed is 1.
Min. value: Minimum value of Psychological level that will be drawn. Minimum value allowed is 1.
Max value: Maximum value of Psychological level that will be drawn. Minimum value allowed is 1.
Line colour: Colour of line drawn.
Line width: Width of line drawn.
Line style: Style of line drawn, either solid, dotted or dashed.
Label offset: Offset of where where label will be, measured from current bar. Offset of 0 will be drawn at current bar location, any positive number will move to the right by the set amount.
Text Colour: Colour of label text
Text size: Size of label text
Example: Chart here shows setting for minimum value as 100, maximum value as 140 and interval as 5. In this setting lines will be automatically drawn at: 100,105,110,115,120,125,130,145 and 140.
The flexibility of user defined max/min and interval values allows to be accommodated for price with different price tags, including stocks under $10.
----------------------------------------------------------------------
If anything is not clear please let me know!

ICT Bread and Butter Sell-SetupICT Bread and Butter Sell-Setup – TradingView Strategy
Overview:
The ICT Bread and Butter Sell-Setup is an intraday trading strategy designed to capitalize on bearish market conditions. It follows institutional order flow and exploits liquidity patterns within key trading sessions—London, New York, and Asia—to identify high-probability short entries.
Key Components of the Strategy:
🔹 London Open Setup (2:00 AM – 8:20 AM NY Time)
The London session typically sets the initial directional move of the day.
A short-term high often forms before a downward push, establishing the daily high.
🔹 New York Open Kill Zone (8:20 AM – 10:00 AM NY Time)
The New York Judas Swing (a temporary rally above London’s high) creates an opportunity for short entries.
Traders fade this move, anticipating a sell-off targeting liquidity below previous lows.
🔹 London Close Buy Setup (10:30 AM – 1:00 PM NY Time)
If price reaches a higher timeframe discount array, a retracement higher is expected.
A bullish order block or failure swing signals a possible reversal.
The risk is set just below the day’s low, targeting a 20-30% retracement of the daily range.
🔹 Asia Open Sell Setup (7:00 PM – 2:00 AM NY Time)
If institutional order flow remains bearish, a short entry is taken around the 0-GMT Open.
Expect a 15-20 pip decline as the Asian range forms.
Strategy Rules:
📉 Short Entry Conditions:
✅ New York Judas Swing occurs (price moves above London’s high before reversing).
✅ Short entry is triggered when price closes below the open.
✅ Stop-loss is set 10 pips above the session high.
✅ Take-profit targets liquidity zones on higher timeframes.
📈 Long Entry (London Close Reversal):
✅ Price reaches a higher timeframe discount array between 10:30 AM – 1:00 PM NY Time.
✅ A bullish order block confirms the reversal.
✅ Stop-loss is set 10 pips below the day’s low.
✅ Take-profit targets 20-30% of the daily range retracement.
📉 Asia Open Sell Entry:
✅ Price trades slightly above the 0-GMT Open.
✅ Short entry is taken at resistance, targeting a quick 15-20 pip move.
Why Use This Strategy?
🚀 Institutional Order Flow Tracking – Aligns with smart money concepts.
📊 Precise Session Timing – Uses market structure across London, New York, and Asia.
🎯 High-Probability Entries – Focuses on liquidity grabs and engineered stop hunts.
📉 Optimized Risk Management – Defined stop-loss and take-profit levels.
This strategy is ideal for traders looking to trade with institutions, fade liquidity grabs, and capture high-probability short setups during the trading day. 📉🔥

Quarterly Theory ICT 03 [TradingFinder] Precision Swing Points🔵 Introduction
Precision Swing Point (PSP) is a divergence pattern in the closing of candles between two correlated assets, which can indicate a potential trend reversal. This structure appears at market turning points and highlights discrepancies between the price behavior of two related assets.
PSP typically forms in key timeframes such as 5-minute, 15-minute, and 90-minute charts, and is often used in combination with Smart Money Concepts (SMT) to confirm trade entries.
PSP is categorized into Bearish PSP and Bullish PSP :
Bearish PSP : Occurs when an asset breaks its previous high, and its middle candle closes bullish, while the correlated asset closes bearish at the same level. This divergence signals weakness in the uptrend and a potential price reversal downward.
Bullish PSP : Occurs when an asset breaks its previous low, and its middle candle closes bearish, while the correlated asset closes bullish at the same level. This suggests weakness in the downtrend and a potential price increase.
🟣 Trading Strategies Using Precision Swing Point (PSP)
PSP can be integrated into various trading strategies to improve entry accuracy and filter out false signals. One common method is combining PSP with SMT (divergence between correlated assets), where traders identify divergence and enter a trade only after PSP confirms the move.
Additionally, PSP can act as a liquidity gap, meaning that price tends to react to the wick of the PSP candle, making it a favorable entry point with a tight stop-loss and high risk-to-reward ratio. Furthermore, PSP combined with Order Blocks and Fair Value Gaps in higher timeframes allows traders to identify stronger reversal zones.
In lower timeframes, such as 5-minute or 15-minute charts, PSP can serve as a confirmation for more precise entries in the direction of the higher timeframe trend. This is particularly useful in scalping and intraday trading, helping traders execute smarter entries while minimizing unnecessary stop-outs.
🔵 How to Use
PSP is a trading pattern based on divergence in candle closures between two correlated assets. This divergence signals a difference in trend strength and can be used to identify precise market turning points. PSP is divided into Bullish PSP and Bearish PSP, each applicable for long and short trades.
🟣 Bullish PSP
A Bullish PSP forms when, at a market turning point, the middle candle of one asset closes bearish while the correlated asset closes bullish. This discrepancy indicates weakness in the downtrend and a potential price reversal upward.
Traders can use this as a signal for long (buy) trades. The best approach is to wait for price to return to the wick of the PSP candle, as this area typically acts as a liquidity level.
f PSP forms within an Order Block or Fair Value Gap in a higher timeframe, its reliability increases, allowing for entries with tight stop-loss and optimal risk-to-reward ratios.
🟣 Bearish PSP
A Bearish PSP forms when, at a market turning point, the middle candle of one asset closes bullish while the correlated asset closes bearish. This indicates weakness in the uptrend and a potential price decline.
Traders use this pattern to enter short (sell) trades. The best entry occurs when price retests the wick of the PSP candle, as this level often acts as a resistance zone, pushing price lower.
If PSP aligns with a significant liquidity area or Order Block in a higher timeframe, traders can enter with greater confidence and place their stop-loss just above the PSP wick.
Overall, PSP is a highly effective tool for filtering false signals and improving trade entry precision. Combining PSP with SMT, Order Blocks, and Fair Value Gaps across multiple timeframes allows traders to execute higher-accuracy trades with lower risk.
🔵 Settings
Mode :
2 Symbol : Identifies PSP and PCP between two correlated assets.
3 Symbol : Compares three assets to detect more complex divergences and stronger confirmation signals.
Second Symbol : The second asset used in PSP and correlation calculations.
Third Symbol : Used in three-symbol mode for deeper PSP and PCP analysis.
Filter Precision X Point : Enables or disables filtering for more precise PSP and PCP detection. This filter only identifies PSP and PCP when the base asset's candle qualifies as a Pin Bar.
Trend Effect : By changing the Trend Effect status to "Off," all Pin bars, whether bullish or bearish, are displayed regardless of the current market trend. If the status remains "On," only Pin bars in the direction of the main market trend are shown.
Bullish Pin Bar Setting : Using the "Ratio Lower Shadow to Body" and "Ratio Lower Shadow to Higher Shadow" settings, you can customize your bullish Pin bar candles. Larger numbers impose stricter conditions for identifying bullish Pin bars.
Bearish Pin Bar Setting : Using the "Ratio Higher Shadow to Body" and "Ratio Higher Shadow to Lower Shadow" settings, you can customize your bearish Pin bar candles. Larger numbers impose stricter conditions for identifying bearish Pin bars.
🔵 Conclusion
Precision Swing Point (PSP) is a powerful analytical tool in Smart Money trading strategies, helping traders identify precise market turning points by detecting divergences in candle closures between correlated assets. PSP is classified into Bullish PSP and Bearish PSP, each playing a crucial role in detecting trend weaknesses and determining optimal entry points for long and short trades.
Using the PSP wick as a key liquidity level, integrating it with SMT, Order Blocks, and Fair Value Gaps, and analyzing higher timeframes are effective techniques to enhance trade entries. Ultimately, PSP serves as a complementary tool for improving entry accuracy and reducing unnecessary stop-outs, making it a valuable addition to Smart Money trading methodologies.

Pipsttocra Technical Patterns: EV HV FVG & OBPipstocrat Technical Patterns , identifies and visualizes key technical analysis patterns and structures on a TradingView chart. Here's a simple breakdown of what it does:
Fair Value Gaps (FVG):
Detects and highlights bullish and bearish Fair Value Gaps as colored boxes.
Adds centerline markers to indicate potential price levels.
Order Blocks (OB):
Identifies bullish and bearish order blocks (areas of significant buying or selling).
Displays them as colored rectangles extending to the right of the chart.
Candlestick Patterns:
Detects Engulfing Patterns (bullish and bearish) with volume confirmation.
Highlights Hammer and Inverted Hammer patterns with customizable shapes and colors.
Customization Options:
Allows users to adjust colors, sizes, and styles for all patterns and structures.
Provides options to show/hide specific patterns like FVGs, engulfing candles, hammers, etc.
Alerts:
Generates alerts for detected patterns, such as FVGs, order blocks, engulfing candles, and confluence zones (combination of FVGs and order blocks).
Management Features:
Automatically removes older or "filled" patterns (optional).
Tracks and updates patterns dynamically as new bars form.
Purpose:
This tool helps traders spot high-probability trading opportunities by identifying key market structures (like FVGs and order blocks) and candlestick patterns. It combines multiple technical analysis concepts into one comprehensive indicator for better decision-making.

Wave N + KDJ + Volumi + SMC + IchimokuWave N + KDJ + Volume + SMC + Ichimoku Indicator
Overview
This script is a multi-layered technical indicator designed to provide traders with enhanced market insights by combining five key methodologies:
• Wave N Pattern (Price Action)
• KDJ Oscillator (Momentum)
• Volume Filtering (Confirmation)
• Smart Money Concepts (Order Blocks) (Institutional Activity)
• Ichimoku Cloud (Trend and Support/Resistance)
By integrating these components, the indicator identifies high-probability trading signals, early warnings of trend shifts, and institutional price zones to improve decision-making in volatile markets.
⸻
How It Works
1️⃣ Wave N Pattern (Price Action Structure)
The Wave N pattern is a classic price action formation that helps spot potential trend reversals and continuations:
• A Bullish Wave N is detected when a higher low and a higher high structure appears.
• A Bearish Wave N is detected when a lower high and a lower low structure forms.
2️⃣ KDJ Oscillator (Momentum & Trend Strength)
The KDJ Indicator is a variation of the Stochastic Oscillator that adds a third line, J, to amplify sensitivity to trend movements.
• J > 50 indicates bullish momentum.
• J < 50 indicates bearish momentum.
• The script includes an early warning signal when J crosses 50, suggesting a possible trend shift.
3️⃣ Volume Filtering (Trade Confirmation)
To avoid false signals, the script integrates volume confirmation:
• A signal is valid only if the volume is above the 20-period EMA of volume.
• This ensures that trade signals are supported by strong market participation.
4️⃣ Smart Money Concepts (Order Blocks)
Order Blocks represent areas of institutional interest, where large traders accumulate or distribute positions.
• The script detects bullish order blocks (potential support) and bearish order blocks (potential resistance).
• These areas help identify optimal entry and exit points.
5️⃣ Ichimoku Cloud (Trend & Dynamic Support/Resistance)
The Ichimoku Cloud is used to confirm trend direction:
• Baseline (Kijun-sen) acts as a key trend filter.
• Senkou Span A & B form the cloud (Kumo), indicating dynamic support/resistance.
• Buy signals require price to be above the baseline, while sell signals require price to be below the baseline.
⸻
Trading Signals & Visual Elements
✅ BUY Signal (Green Arrow)
Occurs when:
• A Bullish Wave N forms
• J > 50 (Bullish KDJ Signal)
• Volume is above EMA threshold
• Price is above the Ichimoku Baseline
❌ SELL Signal (Red Arrow)
Occurs when:
• A Bearish Wave N forms
• J < 50 (Bearish KDJ Signal)
• Volume is above EMA threshold
• Price is below the Ichimoku Baseline
⚠️ Early Warning (Trend Shift Signal)
• An early warning appears when J crosses 50, indicating a possible upcoming trend shift.
• The line color changes based on the potential move:
• Green/Blue → Possible Uptrend
• Red/Orange → Possible Downtrend
⸻
Why This Indicator is Unique?
Unlike simple trend-following indicators, this script:
• Combines Price Action, Momentum, Volume, and Institutional Order Flow for a multi-dimensional approach.
• Filters out weak signals using volume confirmation and Ichimoku.
• Provides early warnings before major trend shifts.
• Visualizes Smart Money Order Blocks, giving traders an edge in spotting institutional zones.
⸻
Best Timeframes & Markets
📊 Recommended Timeframes:
• 1H & 1D (works best on medium/long-term trends)
💹 Markets:
• Crypto, Forex, and Stocks
This indicator is designed for traders who value confluence and strong confirmation in their strategies. Whether you are a trend trader, swing trader, or institutional flow analyst, this tool can help refine your decision-making process.
🚀 Optimize your trades with Wave N + KDJ + Volume + SMC + Ichimoku! 🚀

TJR SEEK AND DESTROYTJR SEEK AND DESTROY – Intraday ICT Trading Tool
Built for day traders, TJR SEEK AND DESTROY combines Smart Money concepts like order blocks, fair value gaps, and liquidity sweeps with structure breaks and daily bias to pinpoint high-probability trades during US market hours (9:30–16:00). Ideal for scalping or intraday strategies on stocks, futures, or forex.
What Makes It Unique?
Unlike standalone ICT indicators, this script integrates:
Order Blocks with volume and range filters for precise support/resistance zones.
Fair Value Gaps (FVG) to spot pre-market price imbalances.
Break of Structure (BOS) and Liquidity Sweeps for trend and reversal signals.
A 1H MA-based Bias to align trades with the day’s direction.
BUY/SELL Labels triggered only when bias, BOS, and sweeps align, reducing noise.
How Does It Work?
Order Blocks: Marks zones with high volume (>1.5x 20-period SMA) and low range (<0.5x ATR20) as teal boxes—potential reversal points.
Fair Value Gap: Compares the prior day’s close to the current open (pre- or post-9:30), shown as a purple line and label (e.g., "FVG: 0.005").
Pivot Point: Calculates (prevHigh + prevLow + prevClose) / 3 from the prior day, plotted as an orange line for equilibrium.
Break of Structure: Detects crossovers of 5-bar highs/lows (gray lines), marked with red triangles.
Liquidity Sweeps: Tracks breaches of the prior day’s high/low (yellow lines), marked with yellow triangles.
Daily Bias: Uses 1H close vs. 20-period MA (blue line) for bullish (green background), bearish (red), or neutral (gray) context.
Signals: BUY (green label) when bias is bullish, price breaks up, and sweeps the prior high; SELL (red label) when bias is bearish, price breaks down, and sweeps the prior low.
How to Use It
Setup: Apply to 1M–15M charts for US session trading (9:30–16:00 EST).
Trading:
Wait for a BUY label after a yellow sweep triangle above the prior day’s high in a green (bullish) background.
Wait for a SELL label after a yellow sweep triangle below the prior day’s low in a red (bearish) background.
Use order blocks (teal boxes) as support/resistance for stop-loss or take-profit.
Markets: Best for SPY, ES futures, or forex pairs with US session volatility.
Underlying Concepts
Order Blocks: High-volume, low-range bars suggest institutional activity.
FVG: Gaps between close and open indicate imbalance to be filled.
BOS & Sweeps: Price breaking key levels signals momentum or stop-hunting.
Bias: 1H MA filters trades by broader trend.
Chart Setup
Displays order blocks (teal boxes), pivot (orange), open (purple), bias (colored background), BOS/sweeps (triangles), and signals (labels). Keep other indicators off for clarity.

FVG LevelsFVG Levels Indicator Description
The FVG Levels indicator dynamically identifies and displays key price zones that may represent fair value gaps and order block areas, helping traders to visually pinpoint potential support and resistance levels directly on the chart.
Key Features
Order Block Identification:
The indicator detects bullish and bearish order blocks by analyzing specific candle patterns. For bullish zones, it checks if a candle two bars ago was bullish (close greater than open) coupled with a subsequent gap condition. Similarly, bearish zones are identified when bearish candle conditions are met with an appropriate gap.
Dynamic Zone Calculation:
It computes critical levels such as the highest highs, lowest lows, highest lows, and lowest highs over a series of recent bars. These levels define the boundaries of potential buy and sell zones and adjust dynamically as new price data comes in.
Visual Representation:
Buy zones are plotted in lime and sell zones in yellow, with the indicator filling the areas between the high and low lines to create clear, shaded bands. This visual aid helps in quickly recognizing zones of potential price reaction.
Chart Overlay:
Designed to work as an overlay, the indicator integrates directly onto your price chart, allowing for seamless correlation between price action and identified zones.
How It Works
Bullish Zones:
When a bullish candle (with the candle's close above its open) is detected along with a significant gap, the indicator marks the upper and lower boundaries of the bullish order block. It further refines these levels by tracking the lowest low and highest high over recent bars to enhance the zone's definition.
Bearish Zones:
In a similar manner, the indicator calculates bearish order blocks by confirming bearish candle conditions and corresponding gap criteria. It then updates the bearish zone levels and computes the highest high and lowest low to establish clear sell zone boundaries.
Usage
Traders can use the FVG Levels indicator to:
Identify potential entry and exit points by observing where price may reverse or consolidate.
Recognize fair value gaps or imbalances that often act as magnet points for price action.
Enhance risk management by using the dynamically calculated zones to set stop-losses or take-profits.

Volume Delta Imbalance Index [PhenLabs]📊 Volume Delta Imbalance Index (VDII)
Version: PineScript™ v6
Description
The Volume Delta Imbalance Index is an advanced technical analysis tool that combines volume profile analysis with price movement dynamics to identify significant market imbalances. It features a sophisticated analysis system that weighs recent versus historical volume delta imbalance patterns, providing traders with insights into potential market reversals and trend continuation scenarios.
Points of Innovation:
Custom volume delta calculation incorporating price and volume relationships
Adaptive smoothing system based on market volatility
Multi-component analysis combining flow, acceleration, and strength metrics
Real-time volume profile integration with historical context
🔧 Core Components
Volume Profile Analysis: Dynamic volume delta imbalance distribution assessment
Flow Imbalance Detection: Buy/sell pressure evaluation
Strength Analysis: Composite market strength measurement
Acceleration Framework: Volume movement dynamics
Statistical Bands: Adaptive threshold system
🚨 Key Features 🚨
The indicator provides comprehensive analysis through:
Volume Delta: Up to date volume imbalance measurement
Market Structure: Support/resistance level identification
Flow Analysis: Buy/sell pressure visualization
Acceleration Signals: Movement momentum detection
Adaptive Bands: Dynamic overbought/oversold levels
📈 Visualization
Color-coded Columns: Shows direction and strength of imbalance
Signal Lines: Strong buy/sell level indicators
Statistical Bands: Shows normal trading ranges
Gradient Fills: Indicates extreme market conditions
Dynamic Opacity: Reflects trend strength
📌 Usage Guidelines
The indicator offers several customization options:
Basic Settings:
Lookback Period: Analysis timeframe adjustment
Sensitivity Level: Signal response calibration
History Depth: Historical context range
Memory Setting: Recent vs. historical data weight
Visual Settings:
Color Scheme: Bullish/bearish signal colors
Signal Levels: Strong buy/sell thresholds
Band Display: Statistical range visualization
✅ Best Use Cases / Things To Look For:
Wait for establishment in the initial trend when the VDII comes back towards zero and the color of the volume becomes more faint
Once this is established and the VDII pushes through to the other side look for small retracements above the zero line on the VDII leading you to believe it is a likely area for price to retrace and continue in its prior direction
Make sure you see the volume bars become more faint in color to give yo further confluence price will continue in its priorly established direction
⚠️ Limitations
Requires sufficient volume data
Most effective in liquid markets
Historical depth affects calculation speed
Possible lag in highly volatile conditions
What Makes This Unique
Composite Volume Analysis: Combines multiple volume metrics
Adaptive Calculation: Adjusts to market volatility
Profile Integration: Incorporates volume profile analysis
Multi-component Scoring: Weighted analysis system
Memory-efficient Design: Optimized for real-time analysis
🔧 How It Works
The indicator processes market data through four main components:
1. Volume Profile Analysis:
Creates dynamic volume delta distribution profiles
Weights recent versus historical data
Identifies significant price levels
2. Flow Imbalance Detection:
Analyzes buying versus selling pressure
Calculates normalized flow ratios
Determines market bias
3. Strength Analysis:
Measures composite market strength
Incorporates volume-weighted movements
Provides trend strength indication
4. Final Score Calculation:
Combines all components with weighted importance
Applies volatility-based smoothing
Generates final signal output
5. VDII Potential Reversal Confluences
Bars between signal confluence is default set to 10 but you can change it to whatever you’d prefer
Signals are a compiled look at the indicator as a whole determining where it think reversals or retracements are likely
💡 Note:
The indicator performs best in markets with consistent volume and clear trending or ranging conditions. Its sophisticated volume analysis provides valuable insights into market dynamics beyond traditional price-based indicators.

ICT NY Kill Zone Auto Trading### **ICT NY Kill Zone Auto Trading Strategy (5-Min Chart)**
#### **Overview:**
This strategy is based on Inner Circle Trader (ICT) concepts, focusing on the **New York Kill Zone**. It is designed for trading GBP/USD exclusively on the **5-minute chart**, automatically entering and exiting trades during the US session.
#### **Key Components:**
1. **Time Filter**
- The strategy only operates during the **New York Kill Zone (9:30 AM - 11:00 AM NY Time)**.
- It ensures execution only on the **5-minute timeframe**.
2. **Fair Value Gaps (FVGs) Detection**
- The script identifies areas where price action left an imbalance, known as Fair Value Gaps (FVGs).
- These gaps indicate potential liquidity zones where price may return before continuing in the original direction.
3. **Order Blocks (OBs) Identification**
- **Bullish Order Block:** Occurs when price forms a strong bullish pattern, suggesting further upside movement.
- **Bearish Order Block:** Identified when a strong bearish formation signals potential downside continuation.
4. **Trade Execution**
- **Long Trade:** Entered when a bullish order block forms within the NY Kill Zone and aligns with an FVG.
- **Short Trade:** Entered when a bearish order block forms within the Kill Zone and aligns with an FVG.
5. **Risk Management**
- **Stop Loss:** Fixed at **30 pips** to limit downside risk.
- **Take Profit:** Set at **60 pips**, providing a **2:1 risk-reward ratio**.
6. **Visual Aids**
- The **Kill Zone is highlighted in blue** to help traders visually confirm the active session.
**Objective:**
This script aims to **capitalize on institutional price movements** within the New York session by leveraging ICT concepts such as FVGs and Order Blocks. By automating trade entries and exits, it eliminates emotions and ensures a disciplined trading approach.

Multi Indicator SummaryPurpose: It calculates and displays bullish and bearish order blocks, key levels derived from recent price movements, which traders use to identify potential support and resistance areas.
Inputs: Users can customize the order block length, defining the range of price data used for calculations.
Logic: The script uses ta.lowest and ta.highest functions to compute order blocks based on specified periods for bullish and bearish trends.
Additional Levels: It identifies extra order blocks (bullish_below and bearish_above) to provide more context for deeper support or higher resistance.
Price Table: A visual table is created on the chart, showing the current price, bullish and bearish order blocks, and additional bearish levels above the current price.
Alerts: Alerts are triggered when the price crosses key order block levels, helping traders react to significant price movements.
Flexibility: The table dynamically updates based on the chart’s ticker and timeframe, ensuring it always reflects the latest data.
Bearish Above Price: Highlights the most recent bearish order block above the current price to inform traders about potential resistance areas.
Visualization: The clear table format aids quick decision-making by summarizing key levels in an accessible way.
Usability: This script is especially useful for intraday and swing traders seeking to integrate order block analysis into their strategies.

Milvetti_Pineconnector_LibraryLibrary "Milvetti_Pineconnector_Library"
This library has methods that provide practical signal transmission for Pineconnector.Developed By Milvetti
buy(licenseId, symbol, risk, sl, tp, beTrigger, beOffset, trailTrig, trailDist, trailStep, atrTimeframe, atrTrigger, atrPeriod, atrMultiplier, atrShift, spread, accFilter, secret, comment)
Create a buy order message
Parameters:
licenseId (string) : License Id. This is a unique identifier found in the Pineconnector Licensing Dashboard.
symbol (string) : Symbol. Default is syminfo.ticker
risk (float) : Risk. Function depends on the “Volume Type” selected in the EA
sl (float) : StopLoss. Place stop-loss. Computation is based on the Target Type selected in the EA. Default is 0(inactive)
tp (float) : TakeProfit. Place take-profit. Computation is based on the Target Type selected in the EA. Default is 0(inactive)
beTrigger (float) : Breakeven will be activated after the position gains this number of pips. Ensure > 0
beOffset (float) : Offset from entry price. 0 means the SL will be placed exactly at entry price. 1 means 1 pip above the entry price for buy trades and 1 pip below for sell trades.
trailTrig (int) : Trailing stop-loss will be activated after a trade gains this number of pips. Default is 0(inactive)
trailDist (int) : SL will be opened at traildist after trailtrig is met, even if you do not have a SL placed.. Default is 0(inactive)
trailStep (int) : Moves trailing stop-loss once price moves to favourable by a specified number of pips. Default is 0(inactive)
atrTimeframe (string) : ATR Trailing Stop will be based on the specified timeframe in minutes and will only update once per bar close. Default is Timeframe.Period
atrTrigger (float) : Activate the trigger of ATR Trailing after market moves favourably by a number of pips. Default is 0(inactive)
atrPeriod (int) : ATR averaging period. Default is 0
atrMultiplier (float) : Multiple of ATR to utilise in the new SL computation. Default is 1
atrShift (float) : Relative shift of price information, 0 uses latest candle, 1 uses second last, etc. Default is 0
spread (float) : Enter the position only if the spread is equal or less than the specified value in pips. Default is 0(inactive)
accFilter (float) : Enter the position only if the account requirement is met. Default is 0(inactive)
secret (string)
comment (string) : Comment. Add a string into the order’s comment section. Default is "Symbol+Timeframe"
sell(licenseId, symbol, risk, sl, tp, beTrigger, beOffset, trailTrig, trailDist, trailStep, atrTimeframe, atrTrigger, atrPeriod, atrMultiplier, atrShift, spread, accFilter, secret, comment)
Create a buy order message
Parameters:
licenseId (string) : License Id. This is a unique identifier found in the Pineconnector Licensing Dashboard.
symbol (string) : Symbol. Default is syminfo.ticker
risk (float) : Risk. Function depends on the “Volume Type” selected in the EA
sl (float) : StopLoss. Place stop-loss. Computation is based on the Target Type selected in the EA. Default is 0(inactive)
tp (float) : TakeProfit. Place take-profit. Computation is based on the Target Type selected in the EA. Default is 0(inactive)
beTrigger (float) : Breakeven will be activated after the position gains this number of pips. Ensure > 0
beOffset (float) : Offset from entry price. 0 means the SL will be placed exactly at entry price. 1 means 1 pip above the entry price for buy trades and 1 pip below for sell trades.
trailTrig (int) : Trailing stop-loss will be activated after a trade gains this number of pips. Default is 0(inactive)
trailDist (int) : SL will be opened at traildist after trailtrig is met, even if you do not have a SL placed.. Default is 0(inactive)
trailStep (int) : Moves trailing stop-loss once price moves to favourable by a specified number of pips. Default is 0(inactive)
atrTimeframe (string) : ATR Trailing Stop will be based on the specified timeframe in minutes and will only update once per bar close. Default is Timeframe.Period
atrTrigger (float) : Activate the trigger of ATR Trailing after market moves favourably by a number of pips. Default is 0(inactive)
atrPeriod (int) : ATR averaging period. Default is 0
atrMultiplier (float) : Multiple of ATR to utilise in the new SL computation. Default is 1
atrShift (float) : Relative shift of price information, 0 uses latest candle, 1 uses second last, etc. Default is 0
spread (float) : Enter the position only if the spread is equal or less than the specified value in pips. Default is 0(inactive)
accFilter (float) : Enter the position only if the account requirement is met. Default is 0(inactive)
secret (string)
comment (string) : Comment. Add a string into the order’s comment section. Default is "Symbol+Timeframe"
buyLimit(licenseId, symbol, pending, risk, sl, tp, beTrigger, beOffset, trailTrig, trailDist, trailStep, atrTimeframe, atrTrigger, atrPeriod, atrMultiplier, atrShift, spread, accFilter, secret, comment)
Create a buy limit order message
Parameters:
licenseId (string) : License Id. This is a unique identifier found in the Pineconnector Licensing Dashboard.
symbol (string) : Symbol. Default is syminfo.ticker
pending (float) : Computing pending order entry price. EA Options: Pips, Specified Price, Percentage
risk (float) : Risk. Function depends on the “Volume Type” selected in the EA
sl (float) : StopLoss. Place stop-loss. Computation is based on the Target Type selected in the EA. Default is 0(inactive)
tp (float) : TakeProfit. Place take-profit. Computation is based on the Target Type selected in the EA. Default is 0(inactive)
beTrigger (float) : Breakeven will be activated after the position gains this number of pips. Ensure > 0
beOffset (float) : Offset from entry price. 0 means the SL will be placed exactly at entry price. 1 means 1 pip above the entry price for buy trades and 1 pip below for sell trades.
trailTrig (int) : Trailing stop-loss will be activated after a trade gains this number of pips. Default is 0(inactive)
trailDist (int) : SL will be opened at traildist after trailtrig is met, even if you do not have a SL placed.. Default is 0(inactive)
trailStep (int) : Moves trailing stop-loss once price moves to favourable by a specified number of pips. Default is 0(inactive)
atrTimeframe (string) : ATR Trailing Stop will be based on the specified timeframe in minutes and will only update once per bar close. Default is Timeframe.Period
atrTrigger (float) : Activate the trigger of ATR Trailing after market moves favourably by a number of pips. Default is 0(inactive)
atrPeriod (int) : ATR averaging period. Default is 0
atrMultiplier (float) : Multiple of ATR to utilise in the new SL computation. Default is 1
atrShift (float) : Relative shift of price information, 0 uses latest candle, 1 uses second last, etc. Default is 0
spread (float) : Enter the position only if the spread is equal or less than the specified value in pips. Default is 0(inactive)
accFilter (float) : Enter the position only if the account requirement is met. Default is 0(inactive)
secret (string)
comment (string) : Comment. Add a string into the order’s comment section. Default is "Symbol+Timeframe"
buyStop(licenseId, symbol, pending, risk, sl, tp, beTrigger, beOffset, trailTrig, trailDist, trailStep, atrTimeframe, atrTrigger, atrPeriod, atrMultiplier, atrShift, spread, accFilter, secret, comment)
Create a buy stop order message
Parameters:
licenseId (string) : License Id. This is a unique identifier found in the Pineconnector Licensing Dashboard.
symbol (string) : Symbol. Default is syminfo.ticker
pending (float) : Computing pending order entry price. EA Options: Pips, Specified Price, Percentage
risk (float) : Risk. Function depends on the “Volume Type” selected in the EA
sl (float) : StopLoss. Place stop-loss. Computation is based on the Target Type selected in the EA. Default is 0(inactive)
tp (float) : TakeProfit. Place take-profit. Computation is based on the Target Type selected in the EA. Default is 0(inactive)
beTrigger (float) : Breakeven will be activated after the position gains this number of pips. Ensure > 0
beOffset (float) : Offset from entry price. 0 means the SL will be placed exactly at entry price. 1 means 1 pip above the entry price for buy trades and 1 pip below for sell trades.
trailTrig (int) : Trailing stop-loss will be activated after a trade gains this number of pips. Default is 0(inactive)
trailDist (int) : SL will be opened at traildist after trailtrig is met, even if you do not have a SL placed.. Default is 0(inactive)
trailStep (int) : Moves trailing stop-loss once price moves to favourable by a specified number of pips. Default is 0(inactive)
atrTimeframe (string) : ATR Trailing Stop will be based on the specified timeframe in minutes and will only update once per bar close. Default is Timeframe.Period
atrTrigger (float) : Activate the trigger of ATR Trailing after market moves favourably by a number of pips. Default is 0(inactive)
atrPeriod (int) : ATR averaging period. Default is 0
atrMultiplier (float) : Multiple of ATR to utilise in the new SL computation. Default is 1
atrShift (float) : Relative shift of price information, 0 uses latest candle, 1 uses second last, etc. Default is 0
spread (float) : Enter the position only if the spread is equal or less than the specified value in pips. Default is 0(inactive)
accFilter (float) : Enter the position only if the account requirement is met. Default is 0(inactive)
secret (string)
comment (string) : Comment. Add a string into the order’s comment section. Default is "Symbol+Timeframe"
sellLimit(licenseId, symbol, pending, risk, sl, tp, beTrigger, beOffset, trailTrig, trailDist, trailStep, atrTimeframe, atrTrigger, atrPeriod, atrMultiplier, atrShift, spread, accFilter, secret, comment)
Create a sell limit order message
Parameters:
licenseId (string) : License Id. This is a unique identifier found in the Pineconnector Licensing Dashboard.
symbol (string) : Symbol. Default is syminfo.ticker
pending (float) : Computing pending order entry price. EA Options: Pips, Specified Price, Percentage
risk (float) : Risk. Function depends on the “Volume Type” selected in the EA
sl (float) : StopLoss. Place stop-loss. Computation is based on the Target Type selected in the EA. Default is 0(inactive)
tp (float) : TakeProfit. Place take-profit. Computation is based on the Target Type selected in the EA. Default is 0(inactive)
beTrigger (float) : Breakeven will be activated after the position gains this number of pips. Ensure > 0
beOffset (float) : Offset from entry price. 0 means the SL will be placed exactly at entry price. 1 means 1 pip above the entry price for buy trades and 1 pip below for sell trades.
trailTrig (int) : Trailing stop-loss will be activated after a trade gains this number of pips. Default is 0(inactive)
trailDist (int) : SL will be opened at traildist after trailtrig is met, even if you do not have a SL placed.. Default is 0(inactive)
trailStep (int) : Moves trailing stop-loss once price moves to favourable by a specified number of pips. Default is 0(inactive)
atrTimeframe (string) : ATR Trailing Stop will be based on the specified timeframe in minutes and will only update once per bar close. Default is Timeframe.Period
atrTrigger (float) : Activate the trigger of ATR Trailing after market moves favourably by a number of pips. Default is 0(inactive)
atrPeriod (int) : ATR averaging period. Default is 0
atrMultiplier (float) : Multiple of ATR to utilise in the new SL computation. Default is 1
atrShift (float) : Relative shift of price information, 0 uses latest candle, 1 uses second last, etc. Default is 0
spread (float) : Enter the position only if the spread is equal or less than the specified value in pips. Default is 0(inactive)
accFilter (float) : Enter the position only if the account requirement is met. Default is 0(inactive)
secret (string)
comment (string) : Comment. Add a string into the order’s comment section. Default is "Symbol+Timeframe"
sellStop(licenseId, symbol, pending, risk, sl, tp, beTrigger, beOffset, trailTrig, trailDist, trailStep, atrTimeframe, atrTrigger, atrPeriod, atrMultiplier, atrShift, spread, accFilter, secret, comment)
Create a sell stop order message
Parameters:
licenseId (string) : License Id. This is a unique identifier found in the Pineconnector Licensing Dashboard.
symbol (string) : Symbol. Default is syminfo.ticker
pending (float) : Computing pending order entry price. EA Options: Pips, Specified Price, Percentage
risk (float) : Risk. Function depends on the “Volume Type” selected in the EA
sl (float) : StopLoss. Place stop-loss. Computation is based on the Target Type selected in the EA. Default is 0(inactive)
tp (float) : TakeProfit. Place take-profit. Computation is based on the Target Type selected in the EA. Default is 0(inactive)
beTrigger (float) : Breakeven will be activated after the position gains this number of pips. Ensure > 0
beOffset (float) : Offset from entry price. 0 means the SL will be placed exactly at entry price. 1 means 1 pip above the entry price for buy trades and 1 pip below for sell trades.
trailTrig (int) : Trailing stop-loss will be activated after a trade gains this number of pips. Default is 0(inactive)
trailDist (int) : SL will be opened at traildist after trailtrig is met, even if you do not have a SL placed.. Default is 0(inactive)
trailStep (int) : Moves trailing stop-loss once price moves to favourable by a specified number of pips. Default is 0(inactive)
atrTimeframe (string) : ATR Trailing Stop will be based on the specified timeframe in minutes and will only update once per bar close. Default is Timeframe.Period
atrTrigger (float) : Activate the trigger of ATR Trailing after market moves favourably by a number of pips. Default is 0(inactive)
atrPeriod (int) : ATR averaging period. Default is 0
atrMultiplier (float) : Multiple of ATR to utilise in the new SL computation. Default is 1
atrShift (float) : Relative shift of price information, 0 uses latest candle, 1 uses second last, etc. Default is 0
spread (float) : Enter the position only if the spread is equal or less than the specified value in pips. Default is 0(inactive)
accFilter (float) : Enter the position only if the account requirement is met. Default is 0(inactive)
secret (string)
comment (string) : Comment. Add a string into the order’s comment section. Default is "Symbol+Timeframe"

Short Term Imbalance ContinuationShort Term Imbalance Continuation
This indicator identifies short-term trading opportunities based on imbalance situations followed by consolidation.
Functionality:
The indicator looks for a specific candle formation:
1. An imbalance candle where the low is above the high of the following candle (bearish) or the high is below the low of the following candle (bullish)
2. Followed by 1-2 inside candles (close within the range of the previous candle) in the same direction
Theory:
The formation is based on two important market mechanisms:
1. Imbalance and Momentum:
- The imbalance shows a strong move with one-sided orderflow dominance
- Inside candles in the same direction confirm that the opposing side cannot take control
2. Consolidation Behavior:
- Inside candles are a classic consolidation pattern
- They show that the market is "digesting" the previous strong movement
- Consolidation within the range indicates controlled accumulation/distribution
- Particularly relevant when large market participants are building or expanding positions
- Consolidation at higher/lower levels confirms the dominance of the trend direction
Settings:
- Choice between one or two inside candles for different consolidation phases
- Option whether both inside candles must have the same direction
- Customizable colors for bullish and bearish signals
Application:
The indicator is particularly suitable for:
- Trend confirmation after strong movements
- Entry into pullbacks during trends
- Identification of continuation setups after consolidations
- Detection of accumulation/distribution phases of large market participants
Notes:
- Best used in combination with higher timeframe trend
- Particularly meaningful at important price zones
- Consolidation phases can indicate institutional interest
- The length of consolidation (one vs. two inside candles) can indicate different accumulation phases

MultiLayer Acceleration/Deceleration Strategy [Skyrexio]Overview
MultiLayer Acceleration/Deceleration Strategy leverages the combination of Acceleration/Deceleration Indicator(AC), Williams Alligator, Williams Fractals and Exponential Moving Average (EMA) to obtain the high probability long setups. Moreover, strategy uses multi trades system, adding funds to long position if it considered that current trend has likely became stronger. Acceleration/Deceleration Indicator is used for creating signals, while Alligator and Fractal are used in conjunction as an approximation of short-term trend to filter them. At the same time EMA (default EMA's period = 100) is used as high probability long-term trend filter to open long trades only if it considers current price action as an uptrend. More information in "Methodology" and "Justification of Methodology" paragraphs. The strategy opens only long trades.
Unique Features
No fixed stop-loss and take profit: Instead of fixed stop-loss level strategy utilizes technical condition obtained by Fractals and Alligator to identify when current uptrend is likely to be over (more information in "Methodology" and "Justification of Methodology" paragraphs)
Configurable Trading Periods: Users can tailor the strategy to specific market windows, adapting to different market conditions.
Multilayer trades opening system: strategy uses only 10% of capital in every trade and open up to 5 trades at the same time if script consider current trend as strong one.
Short and long term trend trade filters: strategy uses EMA as high probability long-term trend filter and Alligator and Fractal combination as a short-term one.
Methodology
The strategy opens long trade when the following price met the conditions:
1. Price closed above EMA (by default, period = 100). Crossover is not obligatory.
2. Combination of Alligator and Williams Fractals shall consider current trend as an upward (all details in "Justification of Methodology" paragraph)
3. Acceleration/Deceleration shall create one of two types of long signals (all details in "Justification of Methodology" paragraph). Buy stop order is placed one tick above the candle's high of last created long signal.
4. If price reaches the order price, long position is opened with 10% of capital.
5. If currently we have opened position and price creates and hit the order price of another one long signal, another one long position will be added to the previous with another one 10% of capital. Strategy allows to open up to 5 long trades simultaneously.
6. If combination of Alligator and Williams Fractals shall consider current trend has been changed from up to downtrend, all long trades will be closed, no matter how many trades has been opened.
Script also has additional visuals. If second long trade has been opened simultaneously the Alligator's teeth line is plotted with the green color. Also for every trade in a row from 2 to 5 the label "Buy More" is also plotted just below the teeth line. With every next simultaneously opened trade the green color of the space between teeth and price became less transparent.
Strategy settings
In the inputs window user can setup strategy setting: EMA Length (by default = 100, period of EMA, used for long-term trend filtering EMA calculation). User can choose the optimal parameters during backtesting on certain price chart.
Justification of Methodology
Let's explore the key concepts of this strategy and understand how they work together. We'll begin with the simplest: the EMA.
The Exponential Moving Average (EMA) is a type of moving average that assigns greater weight to recent price data, making it more responsive to current market changes compared to the Simple Moving Average (SMA). This tool is widely used in technical analysis to identify trends and generate buy or sell signals. The EMA is calculated as follows:
1.Calculate the Smoothing Multiplier:
Multiplier = 2 / (n + 1), Where n is the number of periods.
2. EMA Calculation
EMA = (Current Price) × Multiplier + (Previous EMA) × (1 − Multiplier)
In this strategy, the EMA acts as a long-term trend filter. For instance, long trades are considered only when the price closes above the EMA (default: 100-period). This increases the likelihood of entering trades aligned with the prevailing trend.
Next, let’s discuss the short-term trend filter, which combines the Williams Alligator and Williams Fractals. Williams Alligator
Developed by Bill Williams, the Alligator is a technical indicator that identifies trends and potential market reversals. It consists of three smoothed moving averages:
Jaw (Blue Line): The slowest of the three, based on a 13-period smoothed moving average shifted 8 bars ahead.
Teeth (Red Line): The medium-speed line, derived from an 8-period smoothed moving average shifted 5 bars forward.
Lips (Green Line): The fastest line, calculated using a 5-period smoothed moving average shifted 3 bars forward.
When the lines diverge and align in order, the "Alligator" is "awake," signaling a strong trend. When the lines overlap or intertwine, the "Alligator" is "asleep," indicating a range-bound or sideways market. This indicator helps traders determine when to enter or avoid trades.
Fractals, another tool by Bill Williams, help identify potential reversal points on a price chart. A fractal forms over at least five consecutive bars, with the middle bar showing either:
Up Fractal: Occurs when the middle bar has a higher high than the two preceding and two following bars, suggesting a potential downward reversal.
Down Fractal: Happens when the middle bar shows a lower low than the surrounding two bars, hinting at a possible upward reversal.
Traders often use fractals alongside other indicators to confirm trends or reversals, enhancing decision-making accuracy.
How do these tools work together in this strategy? Let’s consider an example of an uptrend.
When the price breaks above an up fractal, it signals a potential bullish trend. This occurs because the up fractal represents a shift in market behavior, where a temporary high was formed due to selling pressure. If the price revisits this level and breaks through, it suggests the market sentiment has turned bullish.
The breakout must occur above the Alligator’s teeth line to confirm the trend. A breakout below the teeth is considered invalid, and the downtrend might still persist. Conversely, in a downtrend, the same logic applies with down fractals.
In this strategy if the most recent up fractal breakout occurs above the Alligator's teeth and follows the last down fractal breakout below the teeth, the algorithm identifies an uptrend. Long trades can be opened during this phase if a signal aligns. If the price breaks a down fractal below the teeth line during an uptrend, the strategy assumes the uptrend has ended and closes all open long trades.
By combining the EMA as a long-term trend filter with the Alligator and fractals as short-term filters, this approach increases the likelihood of opening profitable trades while staying aligned with market dynamics.
Now let's talk about Acceleration/Deceleration signals. AC indicator is calculated using the Awesome Oscillator, so let's first of all briefly explain what is Awesome Oscillator and how it can be calculated. The Awesome Oscillator (AO), developed by Bill Williams, is a momentum indicator designed to measure market momentum by contrasting recent price movements with a longer-term historical perspective. It helps traders detect potential trend reversals and assess the strength of ongoing trends.
The formula for AO is as follows:
AO = SMA5(Median Price) − SMA34(Median Price)
where:
Median Price = (High + Low) / 2
SMA5 = 5-period Simple Moving Average of the Median Price
SMA 34 = 34-period Simple Moving Average of the Median Price
The Acceleration/Deceleration (AC) Indicator, introduced by Bill Williams, measures the rate of change in market momentum. It highlights shifts in the driving force of price movements and helps traders spot early signs of trend changes. The AC Indicator is particularly useful for identifying whether the current momentum is accelerating or decelerating, which can indicate potential reversals or continuations. For AC calculation we shall use the AO calculated above is the following formula:
AC = AO − SMA5(AO), where SMA5(AO)is the 5-period Simple Moving Average of the Awesome Oscillator
When the AC is above the zero line and rising, it suggests accelerating upward momentum.
When the AC is below the zero line and falling, it indicates accelerating downward momentum.
When the AC is below zero line and rising it suggests the decelerating the downtrend momentum. When AC is above the zero line and falling, it suggests the decelerating the uptrend momentum.
Now we can explain which AC signal types are used in this strategy. The first type of long signal is when AC value is below zero line. In this cases we need to see three rising bars on the histogram in a row after the falling one. The second type of signals occurs above the zero line. There we need only two rising AC bars in a row after the falling one to create the signal. The signal bar is the last green bar in this sequence. The strategy places the buy stop order one tick above the candle's high, which corresponds to the signal bar on AC indicator.
After that we can have the following scenarios:
Price hit the order on the next candle in this case strategy opened long with this price.
Price doesn't hit the order price, the next candle set lower high. If current AC bar is increasing buy stop order changes by the script to the high of this new bar plus one tick. This procedure repeats until price finally hit buy order or current AC bar become decreasing. In the second case buy order cancelled and strategy wait for the next AC signal.
If long trades are initiated, the strategy continues utilizing subsequent signals until the total number of trades reaches a maximum of 5. All open trades are closed when the trend shifts to a downtrend, as determined by the combination of the Alligator and Fractals described earlier.
Why we use AC signals? If currently strategy algorithm considers the high probability of the short-term uptrend with the Alligator and Fractals combination pointed out above and the long-term trend is also suggested by the EMA filter as bullish. Rising AC bars after period of falling AC bars indicates the high probability of local pull back end and there is a high chance to open long trade in the direction of the most likely main uptrend. The numbers of rising bars are different for the different AC values (below or above zero line). This is needed because if AC below zero line the local downtrend is likely to be stronger and needs more rising bars to confirm that it has been changed than if AC is above zero.
Why strategy use only 10% per signal? Sometimes we can see the false signals which appears on sideways. Not risking that much script use only 10% per signal. If the first long trade has been open and price continue going up and our trend approximation by Alligator and Fractals is uptrend, strategy add another one 10% of capital to every next AC signal while number of active trades no more than 5. This capital allocation allows to take part in long trades when current uptrend is likely to be strong and use only 10% of capital when there is a high probability of sideways.
Backtest Results
Operating window: Date range of backtests is 2023.01.01 - 2024.11.01. It is chosen to let the strategy to close all opened positions.
Commission and Slippage: Includes a standard Binance commission of 0.1% and accounts for possible slippage over 5 ticks.
Initial capital: 10000 USDT
Percent of capital used in every trade: 10%
Maximum Single Position Loss: -5.15%
Maximum Single Profit: +24.57%
Net Profit: +2108.85 USDT (+21.09%)
Total Trades: 111 (36.94% win rate)
Profit Factor: 2.391
Maximum Accumulated Loss: 367.61 USDT (-2.97%)
Average Profit per Trade: 19.00 USDT (+1.78%)
Average Trade Duration: 75 hours
How to Use
Add the script to favorites for easy access.
Apply to the desired timeframe and chart (optimal performance observed on 3h BTC/USDT).
Configure settings using the dropdown choice list in the built-in menu.
Set up alerts to automate strategy positions through web hook with the text: {{strategy.order.alert_message}}
Disclaimer:
Educational and informational tool reflecting Skyrex commitment to informed trading. Past performance does not guarantee future results. Test strategies in a simulated environment before live implementation
These results are obtained with realistic parameters representing trading conditions observed at major exchanges such as Binance and with realistic trading portfolio usage parameters.

[blackcat] L1 Abnormal Volume Monitor█ OVERVIEW
The script is an indicator designed to monitor abnormal volume patterns in the market. It calculates and plots moving average volumes, identifies triple volume bars, and detects potential large order entries based on specific conditions.
█ FEATURES
• Input Parameters: The script defines parameters M1, M2, and lbk which control the calculation of moving averages and the lookback period for detecting abnormal volume.
• Calculations: The script calculates two moving averages of volume (MAVOL1 and MAVOL2), a smoothed price level (mm), and identifies conditions for triple volume bars and large order entries.
• Plotting: The script plots volume histograms for up and down bars, moving average volumes, and highlights triple volume bars with and without large order entries.
• Conditional Statements: The script uses conditional statements to determine when to plot certain data points and labels based on the calculated conditions.
█ LOGICAL FRAMEWORK
• xfl(cond, lbk): This function checks if a condition (cond) has been true within a specified lookback period (lbk). It returns true if the condition has been met and false otherwise.
• Parameters: cond (condition to check), lbk (lookback period).
• Return Value: outb (boolean indicating if the condition was met within the lookback period).
• abnormal_vol_monitor(close, open, high, low, volume, M1, M2, lbk): This function calculates moving average volumes, identifies triple volume bars, and detects large order entries.
• Parameters: close, open, high, low, volume (price and volume data), M1, M2 (periods for moving averages), lbk (lookback period).
• Return Value: A tuple containing MAVOL1, MAVOL2, xa (large order entry condition), and tripleVolume (triple volume condition).
█ KEY POINTS AND TECHNIQUES
• Moving Averages: The script uses simple moving averages (sma) and exponential moving averages (ema) to smooth volume data.
• Volume Analysis: The script identifies triple volume bars and large order entries based on specific conditions, such as volume doubling and price increases.
• Lookback Period: The xfl function uses a lookback period to ensure the accuracy of the detected conditions.
• Plotting Techniques: The script uses different plot styles and colors to distinguish between up bars, down bars, moving averages, and abnormal volume patterns.
█ EXTENDED KNOWLEDGE AND APPLICATIONS
• Modifications: The script could be modified to include additional conditions for detecting other types of abnormal volume patterns or to adjust the sensitivity of the detection.
• Extensions: Similar techniques could be applied to other financial instruments or timeframes to identify unusual trading activity.
• Related Concepts: The script utilizes concepts such as moving averages, exponential moving averages, and conditional plotting, which are fundamental in Pine Script and technical analysis.
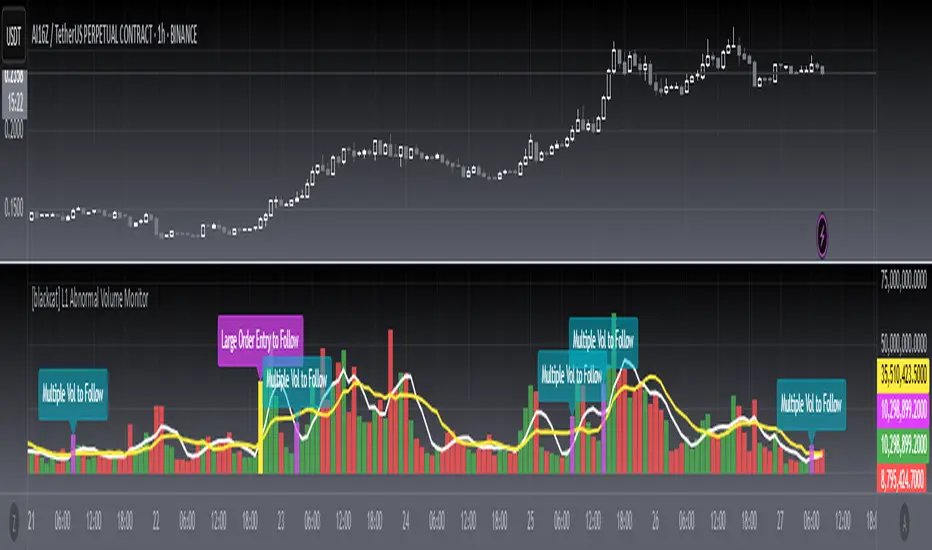
MultiLayer Awesome Oscillator Saucer Strategy [Skyrexio]Overview
MultiLayer Awesome Oscillator Saucer Strategy leverages the combination of Awesome Oscillator (AO), Williams Alligator, Williams Fractals and Exponential Moving Average (EMA) to obtain the high probability long setups. Moreover, strategy uses multi trades system, adding funds to long position if it considered that current trend has likely became stronger. Awesome Oscillator is used for creating signals, while Alligator and Fractal are used in conjunction as an approximation of short-term trend to filter them. At the same time EMA (default EMA's period = 100) is used as high probability long-term trend filter to open long trades only if it considers current price action as an uptrend. More information in "Methodology" and "Justification of Methodology" paragraphs. The strategy opens only long trades.
Unique Features
No fixed stop-loss and take profit: Instead of fixed stop-loss level strategy utilizes technical condition obtained by Fractals and Alligator to identify when current uptrend is likely to be over (more information in "Methodology" and "Justification of Methodology" paragraphs)
Configurable Trading Periods: Users can tailor the strategy to specific market windows, adapting to different market conditions.
Multilayer trades opening system: strategy uses only 10% of capital in every trade and open up to 5 trades at the same time if script consider current trend as strong one.
Short and long term trend trade filters: strategy uses EMA as high probability long-term trend filter and Alligator and Fractal combination as a short-term one.
Methodology
The strategy opens long trade when the following price met the conditions:
1. Price closed above EMA (by default, period = 100). Crossover is not obligatory.
2. Combination of Alligator and Williams Fractals shall consider current trend as an upward (all details in "Justification of Methodology" paragraph)
3. Awesome Oscillator shall create the "Saucer" long signal (all details in "Justification of Methodology" paragraph). Buy stop order is placed one tick above the candle's high of last created "Saucer signal".
4. If price reaches the order price, long position is opened with 10% of capital.
5. If currently we have opened position and price creates and hit the order price of another one "Saucer" signal another one long position will be added to the previous with another one 10% of capital. Strategy allows to open up to 5 long trades simultaneously.
6. If combination of Alligator and Williams Fractals shall consider current trend has been changed from up to downtrend, all long trades will be closed, no matter how many trades has been opened.
Script also has additional visuals. If second long trade has been opened simultaneously the Alligator's teeth line is plotted with the green color. Also for every trade in a row from 2 to 5 the label "Buy More" is also plotted just below the teeth line. With every next simultaneously opened trade the green color of the space between teeth and price became less transparent.
Strategy settings
In the inputs window user can setup strategy setting: EMA Length (by default = 100, period of EMA, used for long-term trend filtering EMA calculation). User can choose the optimal parameters during backtesting on certain price chart.
Justification of Methodology
Let's go through all concepts used in this strategy to understand how they works together. Let's start from the easies one, the EMA. Let's briefly explain what is EMA. The Exponential Moving Average (EMA) is a type of moving average that gives more weight to recent prices, making it more responsive to current price changes compared to the Simple Moving Average (SMA). It is commonly used in technical analysis to identify trends and generate buy or sell signals. It can be calculated with the following steps:
1.Calculate the Smoothing Multiplier:
Multiplier = 2 / (n + 1), Where n is the number of periods.
2. EMA Calculation
EMA = (Current Price) × Multiplier + (Previous EMA) × (1 − Multiplier)
In this strategy uses EMA an initial long term trend filter. It allows to open long trades only if price close above EMA (by default 50 period). It increases the probability of taking long trades only in the direction of the trend.
Let's go to the next, short-term trend filter which consists of Alligator and Fractals. Let's briefly explain what do these indicators means. The Williams Alligator, developed by Bill Williams, is a technical indicator designed to spot trends and potential market reversals. It uses three smoothed moving averages, referred to as the jaw, teeth, and lips:
Jaw (Blue Line): The slowest of the three, based on a 13-period smoothed moving average shifted 8 bars ahead.
Teeth (Red Line): The medium-speed line, derived from an 8-period smoothed moving average shifted 5 bars forward.
Lips (Green Line): The fastest line, calculated using a 5-period smoothed moving average shifted 3 bars forward.
When these lines diverge and are properly aligned, the "alligator" is considered "awake," signaling a strong trend. Conversely, when the lines overlap or intertwine, the "alligator" is "asleep," indicating a range-bound or sideways market. This indicator assists traders in identifying when to act on or avoid trades.
The Williams Fractals, another tool introduced by Bill Williams, are used to pinpoint potential reversal points on a price chart. A fractal forms when there are at least five consecutive bars, with the middle bar displaying the highest high (for an up fractal) or the lowest low (for a down fractal), relative to the two bars on either side.
Key Points:
Up Fractal: Occurs when the middle bar has a higher high than the two preceding and two following bars, suggesting a potential downward reversal.
Down Fractal: Happens when the middle bar shows a lower low than the surrounding two bars, hinting at a possible upward reversal.
Traders often combine fractals with other indicators to confirm trends or reversals, improving the accuracy of trading decisions.
How we use their combination in this strategy? Let’s consider an uptrend example. A breakout above an up fractal can be interpreted as a bullish signal, indicating a high likelihood that an uptrend is beginning. Here's the reasoning: an up fractal represents a potential shift in market behavior. When the fractal forms, it reflects a pullback caused by traders selling, creating a temporary high. However, if the price manages to return to that fractal’s high and break through it, it suggests the market has "changed its mind" and a bullish trend is likely emerging.
The moment of the breakout marks the potential transition to an uptrend. It’s crucial to note that this breakout must occur above the Alligator's teeth line. If it happens below, the breakout isn’t valid, and the downtrend may still persist. The same logic applies inversely for down fractals in a downtrend scenario.
So, if last up fractal breakout was higher, than Alligator's teeth and it happened after last down fractal breakdown below teeth, algorithm considered current trend as an uptrend. During this uptrend long trades can be opened if signal was flashed. If during the uptrend price breaks down the down fractal below teeth line, strategy considered that uptrend is finished with the high probability and strategy closes all current long trades. This combination is used as a short term trend filter increasing the probability of opening profitable long trades in addition to EMA filter, described above.
Now let's talk about Awesome Oscillator's "Sauser" signals. Briefly explain what is the Awesome Oscillator. The Awesome Oscillator (AO), created by Bill Williams, is a momentum-based indicator that evaluates market momentum by comparing recent price activity to a broader historical context. It assists traders in identifying potential trend reversals and gauging trend strength.
AO = SMA5(Median Price) − SMA34(Median Price)
where:
Median Price = (High + Low) / 2
SMA5 = 5-period Simple Moving Average of the Median Price
SMA 34 = 34-period Simple Moving Average of the Median Price
Now we know what is AO, but what is the "Saucer" signal? This concept was introduced by Bill Williams, let's briefly explain it and how it's used by this strategy. Initially, this type of signal is a combination of the following AO bars: we need 3 bars in a row, the first one shall be higher than the second, the third bar also shall be higher, than second. All three bars shall be above the zero line of AO. The price bar, which corresponds to third "saucer's" bar is our signal bar. Strategy places buy stop order one tick above the price bar which corresponds to signal bar.
After that we can have the following scenarios.
Price hit the order on the next candle in this case strategy opened long with this price.
Price doesn't hit the order price, the next candle set lower low. If current AO bar is increasing buy stop order changes by the script to the high of this new bar plus one tick. This procedure repeats until price finally hit buy order or current AO bar become decreasing. In the second case buy order cancelled and strategy wait for the next "Saucer" signal.
If long trades has been opened strategy use all the next signals until number of trades doesn't exceed 5. All trades are closed when the trend changes to downtrend according to combination of Alligator and Fractals described above.
Why we use "Saucer" signals? If AO above the zero line there is a high probability that price now is in uptrend if we take into account our two trend filters. When we see the decreasing bars on AO and it's above zero it's likely can be considered as a pullback on the uptrend. When we see the stop of AO decreasing and the first increasing bar has been printed there is a high probability that this local pull back is finished and strategy open long trade in the likely direction of a main trend.
Why strategy use only 10% per signal? Sometimes we can see the false signals which appears on sideways. Not risking that much script use only 10% per signal. If the first long trade has been open and price continue going up and our trend approximation by Alligator and Fractals is uptrend, strategy add another one 10% of capital to every next saucer signal while number of active trades no more than 5. This capital allocation allows to take part in long trades when current uptrend is likely to be strong and use only 10% of capital when there is a high probability of sideways.
Backtest Results
Operating window: Date range of backtests is 2023.01.01 - 2024.11.25. It is chosen to let the strategy to close all opened positions.
Commission and Slippage: Includes a standard Binance commission of 0.1% and accounts for possible slippage over 5 ticks.
Initial capital: 10000 USDT
Percent of capital used in every trade: 10%
Maximum Single Position Loss: -5.10%
Maximum Single Profit: +22.80%
Net Profit: +2838.58 USDT (+28.39%)
Total Trades: 107 (42.99% win rate)
Profit Factor: 3.364
Maximum Accumulated Loss: 373.43 USDT (-2.98%)
Average Profit per Trade: 26.53 USDT (+2.40%)
Average Trade Duration: 78 hours
These results are obtained with realistic parameters representing trading conditions observed at major exchanges such as Binance and with realistic trading portfolio usage parameters.
How to Use
Add the script to favorites for easy access.
Apply to the desired timeframe and chart (optimal performance observed on 3h BTC/USDT).
Configure settings using the dropdown choice list in the built-in menu.
Set up alerts to automate strategy positions through web hook with the text: {{strategy.order.alert_message}}
Disclaimer:
Educational and informational tool reflecting Skyrex commitment to informed trading. Past performance does not guarantee future results. Test strategies in a simulated environment before live implementation

ADM Indicator [CHE] Comprehensive Description of the Three Market Phases for TradingView
Introduction
Financial markets often exhibit patterns that reflect the collective behavior of participants. Recognizing these patterns can provide traders with valuable insights into potential future price movements. The ADM Indicator is designed to help traders identify and capitalize on these patterns by detecting three primary market phases:
1. Accumulation Phase
2. Manipulation Phase
3. Distribution Phase
This indicator places labels on the chart to signify these phases, aiding traders in making informed decisions. Below is an in-depth explanation of each phase, including how the ADM Indicator detects them.
1. Accumulation Phase
Definition
The Accumulation Phase is a period where informed investors or institutions discreetly purchase assets before a potential price increase. During this phase, the price typically moves within a confined range between established highs and lows.
Characteristics
- Price Range Bound: The asset's price stays within the previous high and low after a timeframe change.
- Low Volatility: Minimal price movement indicates a balance between buyers and sellers.
- Steady Volume: Trading volume may remain relatively constant or show slight increases.
- Market Sentiment: General market interest is low, as the accumulation is not yet apparent to the broader market.
Detection with ADM Indicator
- Criteria: An accumulation is detected when the price remains within the previous high and low after a timeframe change.
- Indicator Action: At the end of the period, if accumulation has occurred, the indicator places a label "Accumulation" on the chart.
- Visual Cues: A yellow semi-transparent background highlights the accumulation phase, enhancing visual recognition.
Implications for Traders
- Entry Opportunity: Consider preparing for potential long positions before a possible upward move.
- Risk Management: Use tight stop-loss orders below the support level due to the defined trading range.
2. Manipulation Phase
Definition
The Manipulation Phase, also known as the Shakeout Phase, occurs when dominant market players intentionally move the price to trigger stop-loss orders and create panic among less-informed traders. This action generates liquidity and better entry prices for large positions.
Characteristics
- False Breakouts: The price moves above the previous high or below the previous low but quickly reverses.
- Increased Volatility: Sharp price movements occur without fundamental reasons.
- Stop-Loss Hunting: The price targets common stop-loss areas, triggering them before reversing.
- Emotional Trading: Retail traders may react impulsively, leading to poor trading decisions.
Detection with ADM Indicator
- Manipulation Up:
- Criteria: Detected when the price rises above the previous high and then falls back below it.
- Indicator Action: Places a label "Manipulation Up" on the chart at the point of detection.
- Manipulation Down:
- Criteria: Detected when the price falls below the previous low and then rises back above it.
- Indicator Action: Places a label "Manipulation Down" on the chart at the point of detection.
- Visual Cues:
- Manipulation Up: Blue background highlights the phase.
- Manipulation Down: Orange background highlights the phase.
Implications for Traders
- Caution Advised: Be wary of false signals and avoid overreacting to sudden price changes.
- Preparation for Next Phase: Use this phase to anticipate potential distribution and adjust strategies accordingly.
3. Distribution Phase
Definition
The Distribution Phase occurs when the institutions or informed investors who accumulated positions start selling to the general market at higher prices. This phase often follows a Manipulation Phase and may signal an impending trend reversal.
Characteristics
- Price Reversal: The price moves in the opposite direction of the prior manipulation.
- High Trading Volume: Increased selling activity as large players offload positions.
- Trend Weakening: The previous trend loses momentum, indicating a potential shift.
- Market Sentiment Shift: Optimism fades, and uncertainty or pessimism may emerge.
Detection with ADM Indicator
- Distribution Up:
- Criteria: Detected after a verified Manipulation Up when the price subsequently falls below the previous low.
- Indicator Action: Places a label "Distribution Up" on the chart.
- Distribution Down:
- Criteria: Detected after a verified Manipulation Down when the price subsequently rises above the previous high.
- Indicator Action: Places a label "Distribution Down" on the chart.
- Visual Cues:
- Distribution Up: Purple background highlights the phase.
- Distribution Down: Maroon background highlights the phase.
Implications for Traders
- Exit Signals: Consider closing long positions if in a Distribution Up phase.
- Short Selling Opportunities: Potential to enter short positions anticipating a downtrend.
Using the ADM Indicator on TradingView
Indicator Overview
The ADM Indicator automates the detection of Accumulation, Manipulation, and Distribution phases by analyzing price movements relative to previous highs and lows on a selected timeframe. It provides visual cues and labels on the chart, helping traders quickly identify the current market phase.
Features
- Multi-Timeframe Analysis: Choose from auto, multiplier, or manual timeframe settings.
- Visual Labels: Clear labeling of market phases directly on the chart.
- Background Highlighting: Distinct background colors for each phase.
- Customizable Settings: Adjust colors, styles, and display options.
- Period Separators: Optional separators delineate different timeframes.
Interpreting the Indicator
1. Accumulation Phase
- Detection: Price stays within the previous high and low after a timeframe change.
- Label: "Accumulation" placed at the period's end if detected.
- Background: Yellow semi-transparent color.
- Action: Prepare for potential long positions.
2. Manipulation Phase
- Detection:
- Manipulation Up: Price rises above previous high and then falls back below.
- Manipulation Down: Price falls below previous low and then rises back above.
- Labels: "Manipulation Up" or "Manipulation Down" placed at detection.
- Background:
- Manipulation Up: Blue color.
- Manipulation Down: Orange color.
- Action: Exercise caution; avoid impulsive trades.
3. Distribution Phase
- Detection:
- Distribution Up: After a Manipulation Up, price falls below previous low.
- Distribution Down: After a Manipulation Down, price rises above previous high.
- Labels: "Distribution Up" or "Distribution Down" placed at detection.
- Background:
- Distribution Up: Purple color.
- Distribution Down: Maroon color.
- Action: Consider exiting positions or entering counter-trend trades.
Configuring the Indicator
- Timeframe Type: Select Auto, Multiplier, or Manual for analysis timeframe.
- Multiplier: Set a custom multiplier when using "Multiplier" type.
- Manual Resolution: Define a specific timeframe with "Manual" option.
- Separator Settings: Customize period separators for visual clarity.
- Label Display Options: Choose to display all labels or only the most recent.
- Visualization Settings: Adjust colors and styles for personal preference.
Practical Tips
- Combine with Other Analysis Tools: Use alongside volume indicators, trend lines, or other technical tools.
- Backtesting: Review historical data to understand how the indicator signals would have impacted past trades.
- Stay Informed: Keep abreast of market news that might affect price movements beyond technical analysis.
- Risk Management: Always employ stop-loss orders and position sizing strategies.
Conclusion
The ADM Indicator is a valuable tool for traders seeking to understand and leverage market phases. By detecting Accumulation, Manipulation, and Distribution phases through specific price action criteria, it provides actionable insights into market dynamics.
Understanding the precise conditions under which each phase is detected empowers traders to make more informed decisions. Whether preparing for potential breakouts during accumulation, exercising caution during manipulation, or adjusting positions during distribution, the ADM Indicator aids in navigating the complexities of the financial markets.
Disclaimer:
The content provided, including all code and materials, is strictly for educational and informational purposes only. It is not intended as, and should not be interpreted as, financial advice, a recommendation to buy or sell any financial instrument, or an offer of any financial product or service. All strategies, tools, and examples discussed are provided for illustrative purposes to demonstrate coding techniques and the functionality of Pine Script within a trading context.
Any results from strategies or tools provided are hypothetical, and past performance is not indicative of future results. Trading and investing involve high risk, including the potential loss of principal, and may not be suitable for all individuals. Before making any trading decisions, please consult with a qualified financial professional to understand the risks involved.
By using this script, you acknowledge and agree that any trading decisions are made solely at your discretion and risk.
This indicator is inspired by the Super 6x Indicators: RSI, MACD, Stochastic, Loxxer, CCI, and Velocity . A special thanks to Loxx for their relentless effort, creativity, and contributions to the TradingView community, which served as a foundation for this work.
Best regards Chervolino
Overview of the Timeframe Levels in the `autotimeframe()` Function
The `autotimeframe()` function automatically adjusts the higher timeframe based on the current chart timeframe. Here are the specific timeframe levels used in the function:
- Current Timeframe ≤ 1 Minute
→ Higher Timeframe: 240 Minutes (4 Hours)
- Current Timeframe ≤ 5 Minutes
→ Higher Timeframe: 1 Day
- Current Timeframe ≤ 1 Hour
→ Higher Timeframe: 3 Days
- Current Timeframe ≤ 4 Hours
→ Higher Timeframe: 7 Days
- Current Timeframe ≤ 12 Hours
→ Higher Timeframe: 1 Month
- Current Timeframe ≤ 1 Day
→ Higher Timeframe: 3 Months
- Current Timeframe ≤ 7 Days
→ Higher Timeframe: 6 Months
- For All Higher Timeframes (over 7 Days)
→ Higher Timeframe: 12 Months
Summary:
The function assigns a corresponding higher timeframe based on the current timeframe to optimize the analysis:
- 1 Minute or Less → 4 Hours
- Up to 5 Minutes → 1 Day
- Up to 1 Hour → 3 Days
- Up to 4 Hours → 7 Days
- Up to 12 Hours → 1 Month
- Up to 1 Day → 3 Months
- Up to 7 Days → 6 Months
- Over 7 Days → 12 Months
This automated adjustment ensures that the indicator works effectively across different chart timeframes without requiring manual changes.
