Carbon Awesome OscillatorThis oscillator is a variation of the well-known Awesome Oscillator.
I have added an extra oscillator line that plots the difference between the EMA's of the short and long periods.
This adds an extra warning of a trend change since the EMA line will usually lead the SMA histogram and sometimes contradict it.
The times when a contradiction is indicated are times to be extra cautious.
I also prefer using periods 3 and 21 for the moving averages, rather than the standard 5 and 34.
Search in scripts for "oscillator"

My OscillatorHi everyone, this is my first indicator and its an oscillator who is calculated by subtracting a moving average with a double smooth moving average and then using conditions, another line is created by subtracting the oscillator with the past values of the oscillator. I don't really know why i made conditions with if but i am still learning. Thanks alexgrover for helping me when errors showed up and i hope the code is not wrong.

Elliott Wave Oscillator (EWO)Simple Elliott Wave Oscillator: the fast moving average is a 5-period SMA, the slow moving average is a 35-period SMA, the EWO is the difference between the two.
It lines up almost perfectly with Elliott Waves.

Squeeze Momentum OscillatorTitle: Squeeze Momentum Oscillator
Description: This indicator is a panel-based oscillator designed to visualize the relationship between market volatility and momentum. Based on the classic TTM Squeeze concept, it helps traders identify periods of consolidation ("The Squeeze") and the subsequent release of energy ("The Breakout").
Originality & Enhancements: Standard squeeze oscillators only show when a squeeze fires (turning from red to green). This enhanced version adds a specific Breakout Validation layer. It changes the center-line dot color to Fuchsia or Blue only if the squeeze release is confirmed by the slope of the 20-period Moving Average, filtering out weak or false fires.
How It Works:
1. The Center Line (Volatility State): The dots along the zero line tell you the current volatility condition:
🔴 Red Dot: Squeeze ON. Bollinger Bands are inside Keltner Channels. Volatility is compressed. The market is charging up.
🟣 Fuchsia Dot: Bullish Breakout. The squeeze has fired upward, and the underlying trend (20 SMA slope) is positive.
🔵 Blue Dot: Bearish Breakout. The squeeze has fired downward, and the underlying trend (20 SMA slope) is negative.
🟢 Green Dot: Squeeze OFF. Normal volatility conditions.
2. The Histogram (Momentum): The bars indicate the strength and direction of the price movement using Linear Regression logic:
Cyan/Green: Bullish momentum. (Darker = weakening).
Red/Maroon: Bearish momentum. (Darker = weakening).
Visual Guide:
Setup: Wait for a series of Red Dots.
Trigger: Look for the first Fuchsia (Bullish) or Blue (Bearish) dot accompanied by an expanding Histogram in the same direction.
Settings:
Feature Toggle: You can turn the "Breakout Colors" (Fuchsia/Blue) on or off if you prefer the classic look.
Sensitivity: Fully customizable lengths and multipliers for Bollinger Bands and Keltner Channels.
Credits: Based on the foundational TTM Squeeze oscillator logic. Linear regression momentum calculation adapted from standard open-source methods. Breakout validation logic added for enhanced reliability.

Elemental Force OscillatorElemental Force Oscillator calculates the magnitude & force of an individual candle by taking in information about it's high, low, and close, and comparing that to the previous candle's high, low, and close. Sounds like physics, eh?
It's my attempt to create a unifying oscillator. In other words a holy grail indicator.
It's not exactly holy grail, but it does better than most indicators because it takes the hlc of all candles for n periods.
This indicator is similar to Riley's Force Index (another indicator that I created before).
So if you like this one, you'll probably like RFI too.
For optimal performance, my recommended setting is 10.
Good luck traders, and as always, happy trading!

WaveTrend OscillatorWave trend Oscillator, similar to the other Cypher Oscillators, just that this oscillator is a little bit more refined less noise and a few better options for the money flow, but keeping the basic Structures and features. The only feature this does not have is the divergences

Muyyu oscillatorMuyyu oscillator(MO) is a combination of price based momentum and volume based momentum. MO consist of two things which is MO line and MO bar.
MO Line can be used to identify overbought and oversold situations. However, it is important to know when to look for overbought readings and when to look for oversold readings. As with most momentum oscillators, it is best to look for short-term oversold situations when the medium-term trend is up and short-term overbought situations when the medium-term trend is down. In other words, look for opportunities in the direction of the bigger trend, such as a pullback within a bigger uptrend. Define the bigger trend before looking for overbought or oversold readings.
MO Line quantifies the relationship between price and Bollinger Band. Readings above .80 indicate that price is near the upper band. Readings below .20 indicate that price is near the lower band. Surges towards the upper band show strength, but can sometimes be interpreted as overbought(divergence). Plunges to the lower band show weakness, but can sometimes be interpreted as oversold(Divergence). A lot depends on the underlying trend and other indicators. While MO Line can have some value on its own, it is best when used in conjunction with other indicators or price analysis.
MO Line = (Price - Lower Band)/(Upper Band - Lower Band)
The default setting for MO Line is (21,2). The bands are set 2 standard deviations above and below the 21-day simple moving average.
MO bar is a Money Flow Index(MFI) divide by 100.
MFI is a momentum indicator that measures the flow of money into and out of a security over a specified period of time. It is related to the Relative Strength Index (RSI) but incorporates volume, whereas the RSI only considers price. The MFI is calculated by accumulating positive and negative Money Flow values, then creating a Money Ratio. The Money Ratio is then normalized into the MFI oscillator form.
Combine this two to find where you will find a perfect entry for trend following. For example ;
a trend-following system using MO line with the MO bar. An uptrend begins when MO line is above 1 and MO bar is above 0.8(green bar). MO bar is bound between zero and one. A move above .80 places MO bar in the upper 20% of its range, which is a strong reading. Downtrends are identified when MO line is below 0 and MO bar is below 0.2.

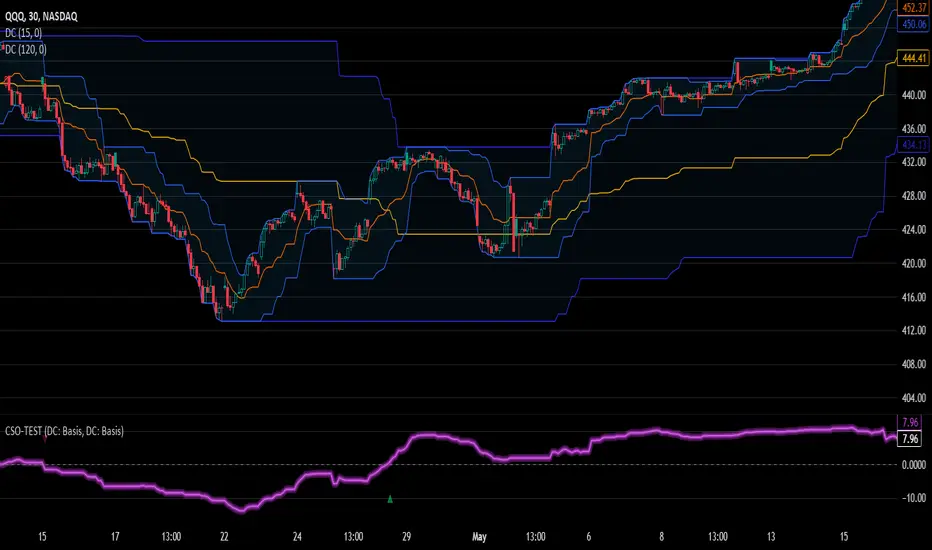
Custom Signal Oscillator StrategyThe CSO is made to help traders easily test their theories by subtracting the difference between two customizable plots(indicators) without having to search for strategies. The general purpose is to provide a tool to users without coding knowledge.
How to use :
Apply the indicator(s) to test
Go to the CSO strategy input settings and select the desired plots from the added indicators. (The back test will enter long or short depending on the fast signal crosses on the slow signal)
Pull up the strategy tester
Adjust the input settings on the selected indicator(s) to back test
For example, the published strategy is using the basis lines from two Donchian channels with varying length. This can be utilized with multiple overlays on the chart and oscillators that are operating on the same scale with each other. Since chart glows aren't extremely common, a glow option is included to stand out on the chart as the chain operator. A long only option for is also included for versatility.
Chaikin Oscillator Enhanced📊 What Is the Chaikin Oscillator?
The Chaikin Oscillator is a momentum indicator that helps traders understand the strength of buying and selling pressure in the market, based on volume and price movement.
It is calculated as the difference between two moving averages (short-term and long-term) of the Accumulation/Distribution Line (A/D Line). This line combines price and volume to show whether money is flowing into or out of an asset.
________________________________________
🧠 Simple Concept
• When big traders are buying, they usually do so with volume support—the Chaikin Oscillator picks this up.
• When volume is rising but price is falling, or vice versa, it shows hidden strength or weakness.
So, this indicator helps you see what the smart money is doing, even if the price isn’t moving much.
________________________________________
🛠️ How It Works
• Oscillator Value Above Zero → More buying pressure (bullish).
• Oscillator Value Below Zero → More selling pressure (bearish).
• Crossing above zero → A potential buy signal.
• Crossing below zero → A potential sell signal.
The histogram (vertical bars) in the indicator changes color:
• Green bars = Positive momentum.
• Red bars = Negative momentum.
________________________________________
🎯 How Traders Use It for Entry and Exit
✅ For Entries:
• Buy Entry: When the oscillator crosses above the zero line and the bars turn green, it means buyers are stepping in with volume.
• For better confirmation, combine it with price breaking above a resistance level.
❌ For Exits or Shorts:
• Sell Exit or Short Entry: When the oscillator crosses below the zero line and bars turn red, it suggests selling pressure is growing.
• If the price is also below support, it’s a stronger signal.
________________________________________
🔍 Example Use Case:
1. You’re watching a stock or crypto that's been going sideways.
2. Suddenly, the Chaikin Oscillator crosses above zero, and green bars appear.
3. That’s your early clue that big buyers might be entering.
4. If price confirms this with a breakout, you can enter a long position.
________________________________________
🌐 Where Is It Useful?
The Chaikin Oscillator is great for:
• Stocks (especially volume-heavy large caps)
• ETFs
• Cryptocurrency (on exchanges that provide volume data)
• Forex – less reliable unless volume is proxy-based
⚠️ Important: It won’t work well on instruments where volume data is missing or unreliable (like some CFDs or synthetic assets).
________________________________________
🧭 Pro Tips for Using It:
• Combine it with support/resistance, moving averages, or candlestick patterns.
• Avoid trading only based on this indicator—use it as confirmation.
• Use the alerts (added in the script) so you don’t miss key movements.
________________________________________

Triple Sine Oscillator (TSO) — Squeeze EditionTriple Sine Oscillator (TSO) – Squeeze Edition
A unique sine-cubed momentum oscillator that identifies cyclic exhaustion zones combined with real-time liquidity stress detection (MLO proxy via credit spreads + VIX).
Designed for both normal stocks and heavily shorted names (GME/AMC-style).
Features:
• Overbought/oversold reversals
• Bullish/bearish divergence
• "Squeeze Favorable" background + amplified alerts
• Real-time dashboard with trading advice
• Special 🚀 SQUEEZE and 💎 MEGA alerts when conditions align

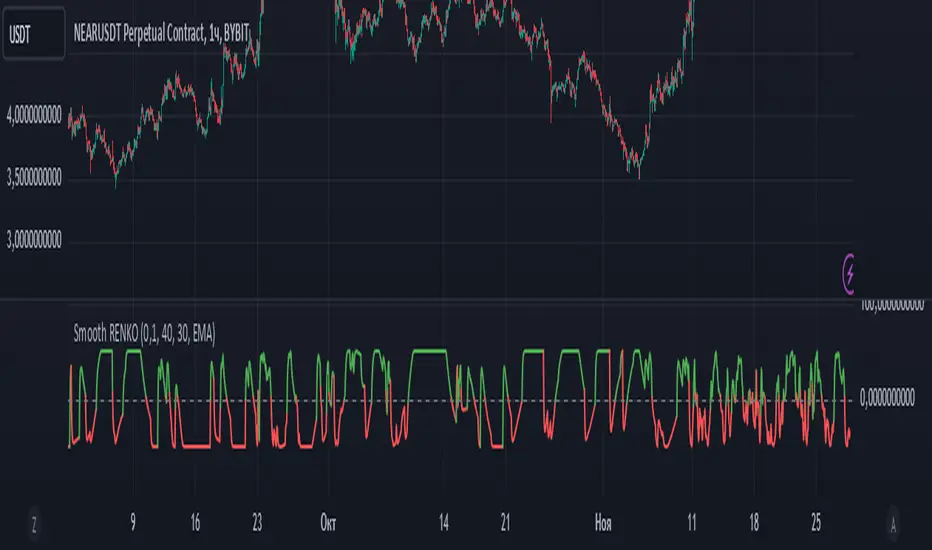
Smoothed Renko OscillatorSMOOTHED RENKO OSCILLATOR
Technical indicator combining Renko charting with oscillator mechanics for price momentum analysis. Brick size determines sensitivity of price movement detection, with adjustable smoothing for noise reduction.
Parameters include brick size (default 10), smoothing period (5), oscillator period (14), and smoothing type selection (EMA/SMA/WMA). Values above zero indicate bullish momentum, below zero bearish momentum, with ±40-50 marking potential reversal zones. Zero-line crossovers suggest trend changes.
Larger brick settings reduce noise but delay signals, while smaller bricks increase sensitivity. EMA smoothing provides faster response, while SMA/WMA offer more stable readings. The indicator supports trend confirmation, momentum measurement, divergence analysis, and entry/exit timing.
Best used in conjunction with price action and additional indicators for comprehensive market analysis. Particularly effective in trending markets for momentum confirmation and potential reversal identification.
Delta OscillatorAn advanced technical indicator that helps traders identify buying and selling pressure in the market by analyzing volume-based price movements.
Features
Real-time calculation of buying and selling volume
Cumulative delta conversion into oscillator format (-50 to +50 range)
Color-coded visualization (green for buying pressure, red for selling pressure)
Customizable period length for calculations
How It Works
The indicator:
Calculates buying/selling volume based on price direction
Accumulates delta over time
Normalizes values into oscillator format
Displays results as a colored line chart
Trading Applications
Identify potential trend reversals
Measure buying/selling momentum
Confirm price action signals
Spot divergences with price
Installation
Copy the provided Pine Script code
Open TradingView Chart → Pine Editor
Paste the code and click "Add to Chart"
Settings
Period: Adjustable timeframe for calculations (default: 14)
Visualization: Line width and colors can be customized

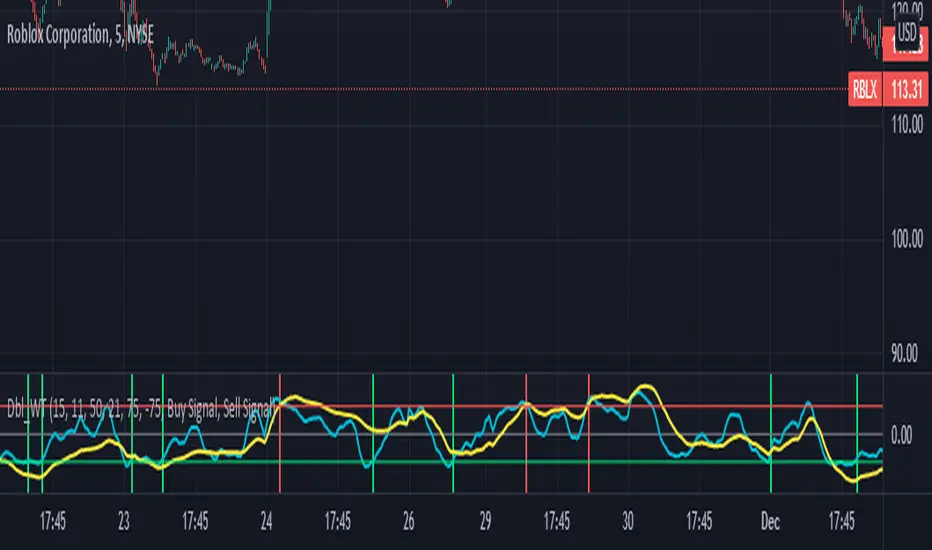
Double wave-trend Oscillator Buy/Sell signalsBINANCE:ROSEUSDT
This script attempts to use Wave Trend Oscillator's of different lengths in order to identify trade entries and exits for bullish trades. This indicator is strongly recommended to be used with volatile assets or on large time interval charts. You use this script by entering a trade when it signals a green block and exiting when it signals red although these signals could potentially be used as trend reversal signals instead. The script uses two wave trend oscillator's the lengths of which can be edited in the settings, but the general idea is that one is fast and one is slow and these indicate when to buy/sell when they crossover the overbought/sold lines. In the setting you can choose whether the fast or the slow line will be used for buy signal and the other is then used to signal selling. By default this will be ticked on indicating that the fast line crossing over the oversold level will be used for buy signals, if it is ticked off the slow line will be used. The other tickbox is for whether the line used for selling will signal when it first crosses over the overbought line or whether it should signal then it crosses back under the overbought line after having crossed over it, the default value is off indicating that it will signal when it crosses back under the overbought level. The overbought/sold levels should be tweaked on a per asset basis to get the best quality signals.
The original code for the Wave Trend Oscillator comes from LazyBear and was modified and built on to create this indicator.
IT Volume Momentum OscillatorAuthor/Creator: Carl Swenlin
Data components required: Up Volume (UV), Down Volume ( DV ), Total
Volume (V).
Description: The Intermediate Term Volume Momentum Oscillator is a
barometer of breadth. To calculate the ITVM add the daily McClellan Oscillator
- Volume (ratio adjusted using the difference of up and down volume divided by
the total volume ) to the daily 39-day exponential average, then calculate a 20-
day exponential average of the result.

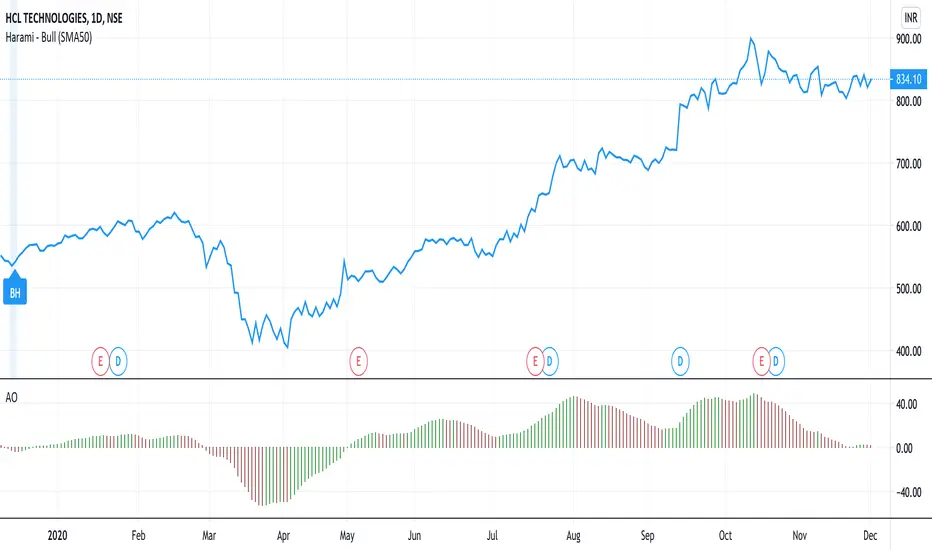
IT Breadth Momentum OscillatorCreator: Carl Swenlin
Data components required: Advances (A), Declines (D).
Description: The Intermediate Term Breadth Momentum Oscillator is a barometer of breadth. To calculate the ITBM, add the daily McClellan Oscillator
(ratio adjusted) to the daily 39-day exponential average, then calculate a 20-day exponential average of the result

[BMAX] DT Oscillator(ENGLISH)
This indicator is a variation of the original DT Oscillator that uses Stochastic and RSI calculations to find momentum opportunities.
(PORTUGUÊS)
Este indicador é uma variação do indicador DT Oscillator original que utiliza Estocástico e cálculos do RSI para encontrar oportunidades em "momentum".

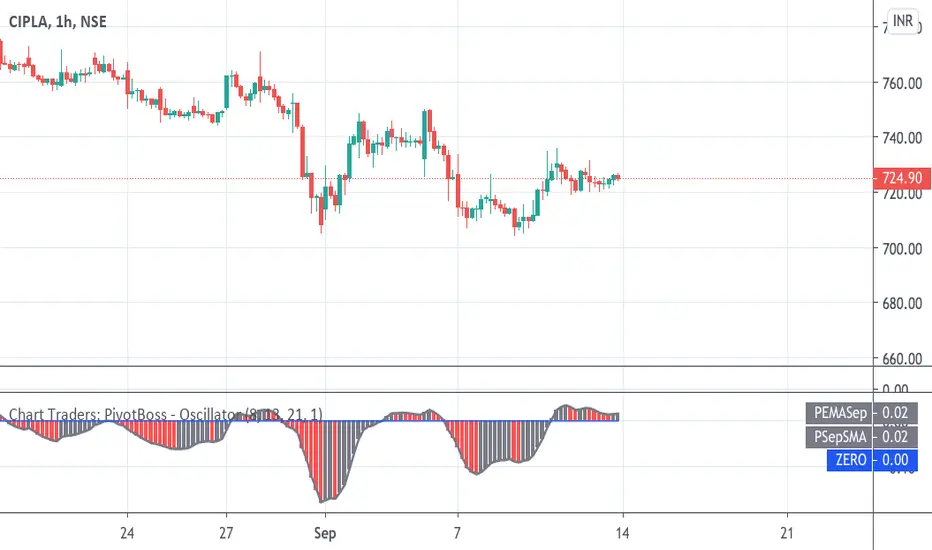
Chart Traders: PivotBoss - OscillatorChart Traders: PivotBoss - Oscillator indicator shows trend as well as entry and exit point.
When candle color change from red to gray user can buy or sell when change from gray to red. When indicator crosses zero from lower you can also buy or sell when oscillator crosses zero from top.
NG [Wave Period Oscillator]The WPO is a short-term oscillator that measures the buying and selling period of price cycles over a certain time interval.
The leading oscillator indicates a rise in buying period when it moves above the zero line and a rise in selling period when it moves below the zero line.
Trading Tactics
Center line Crossover: a bullish center line crossover occurs when the WPO line moves above the zero level to turn positive.
A bearish center line crossover occurs when the WPO line moves below the zero level to turn negative.
When bulls are in control, the price rally begins and the average of the bull’s period T increases to drive the WPO line above the center line.
A buy signal is subsequently triggered.
When the bulls start to loose power, prices move sideways and the average period decreases. In this case, the WPO line may fl utter near the center line and cause false signals, whipsaws.
To avoid the whipsaws occurring on the center line, the following trading tactics are proposed:
Uptrend Tactic:
During an ideal uptrend, the WPO does not reach the lower boundary -2 and usually rebounds from a higher level than -2.
This means that the bulls have taken control earlier. Hence, a zero line crossover generates a buy signal. The WPO crosses the upper boundary at +2 then pulls back again below +2 to generate a sell signal.
Sideways Tactic:
During sideways, the WPO fluctuates between the lower and upper boundaries -2 and 2. This tactic is also used in an uptrend where corrections are strong enough to drive the WPO line below the lower boundary.
Downtrend Tactic:
During downtrends, the WPO fails to reach the upper boundary and oscillates between the 0 and -2 levels. The bears enter early indicating an obvious weakness in the market. Therefore, crossing the zero level generates a sell signal.
Exit at Weakness:
During uptrend reversals and downtrends, the WPO oscillates between the center line and the lower boundary -2. The bears are controlling the market and move in wide cycle periods while the bull’s strength is almost absent.
An exit signal is triggered once the WPO crosses -2. When prices decline, the WPO may cross its extreme lower boundary at -2.7. Therefore, a swift exit signal is triggered once the WPO crosses -2.
Re-Entry:
During uptrend, the WPO crosses down the upper boundary level at +2 to generate a sell signal. Yet, it does not reach the zero line and the oscillator moves back toward the upper boundary.
This case is considered as strength while a re-entry signal occurs at the +2 level crossover. The sell signal is generated when the WPO line crosses down the upper boundary.

VIX OscillatorVIX Oscillator for catching vol signals on the same chart as your index of choice.
- Configurable levels that alert you when certain thresholds are broken
- Shaded background that make it simple to tell when you are in low vol/high vol regimes
- Moving line tracking price so that you can easily see bull/bear divergences against SPX building

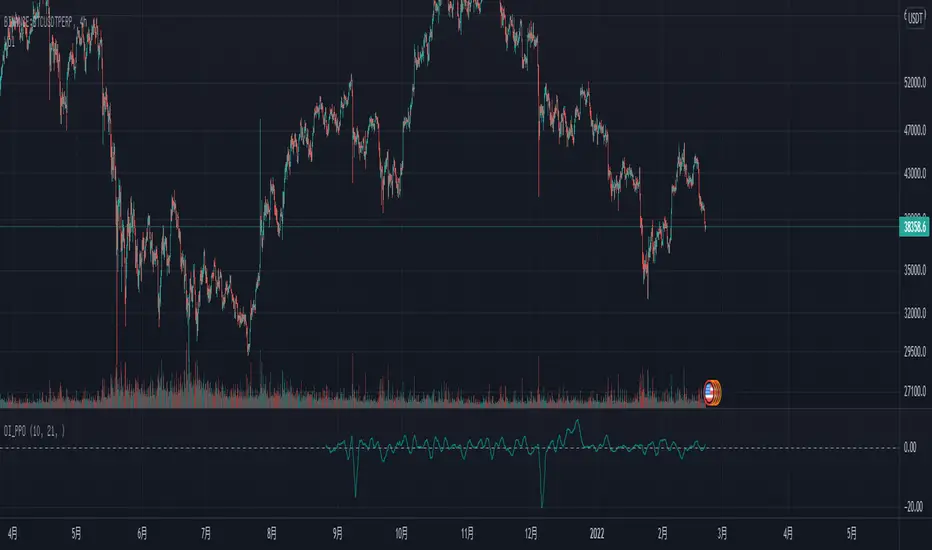
Open Interest Price OscillatorNOTE: You need to use this script on the ticker that has open interest data.
Price Oscillator of the ticker's open interest.
Only the money would tell you the truth.
Trend tends to change after a significate change of the open interest.
So it's may be a reliable indicator to catch the market movements.
Awesome Oscillator - Exponential Moving AverageStandard Awesome Oscillator is SMA. I have created this with Exponential Moving Average
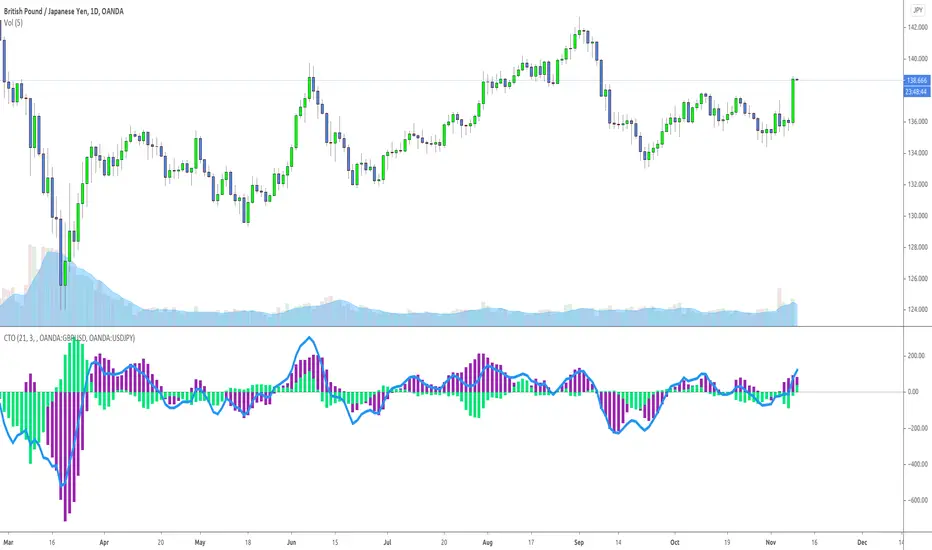
Carbon Triangle OscillatorThis is a variant of the Awesome Oscillator that can show the realtionship between three instruments at the same time.
I created this primarily for currency trading where a Currency Triangle is an arithmetic relationship between three currency instruments.
Example: GBP/JPY = GBP/USD * USD/JPY
By viewing the reationship between a currency instrument of interest and two of its component instruments,
we may be able to discern patterns that lead to profitable trades.
This script uses the current instrument on the chart as the foreground line plot,
and the other two configureable instruments as two overlaid histograms behind.
Enjoy!
Average Difference OscillatorAverage Difference is a simple, yet powerful oscillator that can be used for entries or exits.
The indicator was made from scratch, so it's 100% original!
Calculation:
1) Difference = Close - Previous close
2) Average Difference = Sma (Difference, n periods)
How to interpret colors:
Green = Bullish
Red = Bearish
Default setting: 13 (For entries)
Enjoy, and hit the follow button to follow my latest indicators!
