Any Oscillator Underlay [TTF]We are proud to release a new indicator that has been a while in the making - the Any Oscillator Underlay (AOU) !
Note: There is a lot to discuss regarding this indicator, including its intent and some of how it operates, so please be sure to read this entire description before using this indicator to help ensure you understand both the intent and some limitations with this tool.
Our intent for building this indicator was to accomplish the following:
Combine all of the oscillators that we like to use into a single indicator
Take up a bit less screen space for the underlay indicators for strategies that utilize multiple oscillators
Provide a tool for newer traders to be able to leverage multiple oscillators in a single indicator
Features:
Includes 8 separate, fully-functional indicators combined into one
Ability to easily enable/disable and configure each included indicator independently
Clearly named plots to support user customization of color and styling, as well as manual creation of alerts
Ability to customize sub-indicator title position and color
Ability to customize sub-indicator divider lines style and color
Indicators that are included in this initial release:
TSI
2x RSIs (dubbed the Twin RSI )
Stochastic RSI
Stochastic
Ultimate Oscillator
Awesome Oscillator
MACD
Outback RSI (Color-coding only)
Quick note on OB/OS:
Before we get into covering each included indicator, we first need to cover a core concept for how we're defining OB and OS levels. To help illustrate this, we will use the TSI as an example.
The TSI by default has a mid-point of 0 and a range of -100 to 100. As a result, a common practice is to place lines on the -30 and +30 levels to represent OS and OB zones, respectively. Most people tend to view these levels as distance from the edges/outer bounds or as absolute levels, but we feel a more way to frame the OB/OS concept is to instead define it as distance ("offset") from the mid-line. In keeping with the -30 and +30 levels in our example, the offset in this case would be "30".
Taking this a step further, let's say we decided we wanted an offset of 25. Since the mid-point is 0, we'd then calculate the OB level as 0 + 25 (+25), and the OS level as 0 - 25 (-25).
Now that we've covered the concept of how we approach defining OB and OS levels (based on offset/distance from the mid-line), and since we did apply some transformations, rescaling, and/or repositioning to all of the indicators noted above, we are going to discuss each component indicator to detail both how it was modified from the original to fit the stacked-indicator model, as well as the various major components that the indicator contains.
TSI:
This indicator contains the following major elements:
TSI and TSI Signal Line
Color-coded fill for the TSI/TSI Signal lines
Moving Average for the TSI
TSI Histogram
Mid-line and OB/OS lines
Default TSI fill color coding:
Green : TSI is above the signal line
Red : TSI is below the signal line
Note: The TSI traditionally has a range of -100 to +100 with a mid-point of 0 (range of 200). To fit into our stacking model, we first shrunk the range to 100 (-50 to +50 - cut it in half), then repositioned it to have a mid-point of 50. Since this is the "bottom" of our indicator-stack, no additional repositioning is necessary.
Twin RSI:
This indicator contains the following major elements:
Fast RSI (useful if you want to leverage 2x RSIs as it makes it easier to see the overlaps and crosses - can be disabled if desired)
Slow RSI (primary RSI)
Color-coded fill for the Fast/Slow RSI lines (if Fast RSI is enabled and configured)
Moving Average for the Slow RSI
Mid-line and OB/OS lines
Default Twin RSI fill color coding:
Dark Red : Fast RSI below Slow RSI and Slow RSI below Slow RSI MA
Light Red : Fast RSI below Slow RSI and Slow RSI above Slow RSI MA
Dark Green : Fast RSI above Slow RSI and Slow RSI below Slow RSI MA
Light Green : Fast RSI above Slow RSI and Slow RSI above Slow RSI MA
Note: The RSI naturally has a range of 0 to 100 with a mid-point of 50, so no rescaling or transformation is done on this indicator. The only manipulation done is to properly position it in the indicator-stack based on which other indicators are also enabled.
Stochastic and Stochastic RSI:
These indicators contain the following major elements:
Configurable lengths for the RSI (for the Stochastic RSI only), K, and D values
Configurable base price source
Mid-line and OB/OS lines
Note: The Stochastic and Stochastic RSI both have a normal range of 0 to 100 with a mid-point of 50, so no rescaling or transformations are done on either of these indicators. The only manipulation done is to properly position it in the indicator-stack based on which other indicators are also enabled.
Ultimate Oscillator (UO):
This indicator contains the following major elements:
Configurable lengths for the Fast, Middle, and Slow BP/TR components
Mid-line and OB/OS lines
Moving Average for the UO
Color-coded fill for the UO/UO MA lines (if UO MA is enabled and configured)
Default UO fill color coding:
Green : UO is above the moving average line
Red : UO is below the moving average line
Note: The UO naturally has a range of 0 to 100 with a mid-point of 50, so no rescaling or transformation is done on this indicator. The only manipulation done is to properly position it in the indicator-stack based on which other indicators are also enabled.
Awesome Oscillator (AO):
This indicator contains the following major elements:
Configurable lengths for the Fast and Slow moving averages used in the AO calculation
Configurable price source for the moving averages used in the AO calculation
Mid-line
Option to display the AO as a line or pseudo-histogram
Moving Average for the AO
Color-coded fill for the AO/AO MA lines (if AO MA is enabled and configured)
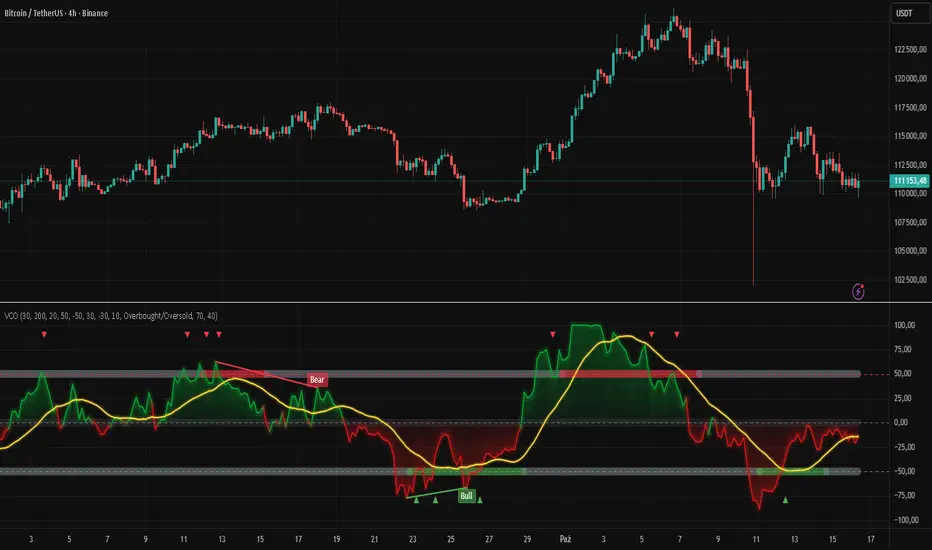
Default AO fill color coding (Note: Fill was disabled in the image above to improve clarity):
Green : AO is above the moving average line
Red : AO is below the moving average line
Note: The AO is technically has an infinite (unbound) range - -∞ to ∞ - and the effective range is bound to the underlying security price (e.g. BTC will have a wider range than SP500, and SP500 will have a wider range than EUR/USD). We employed some special techniques to rescale this indicator into our desired range of 100 (-50 to 50), and then repositioned it to have a midpoint of 50 (range of 0 to 100) to meet the constraints of our stacking model. We then do one final repositioning to place it in the correct position the indicator-stack based on which other indicators are also enabled. For more details on how we accomplished this, read our section "Binding Infinity" below.
MACD:
This indicator contains the following major elements:
Configurable lengths for the Fast and Slow moving averages used in the MACD calculation
Configurable price source for the moving averages used in the MACD calculation
Configurable length and calculation method for the MACD Signal Line calculation
Mid-line
Note: Like the AO, the MACD also technically has an infinite (unbound) range. We employed the same principles here as we did with the AO to rescale and reposition this indicator as well. For more details on how we accomplished this, read our section "Binding Infinity" below.
Outback RSI (ORSI):
This is a stripped-down version of the Outback RSI indicator (linked above) that only includes the color-coding background (suffice it to say that it was not technically feasible to attempt to rescale the other components in a way that could consistently be clearly seen on-chart). As this component is a bit of a niche/special-purpose sub-indicator, it is disabled by default, and we suggest it remain disabled unless you have some pre-defined strategy that leverages the color-coding element of the Outback RSI that you wish to use.
Binding Infinity - How We Incorporated the AO and MACD (Warning - Math Talk Ahead!)
Note: This applies only to the AO and MACD at time of original publication. If any other indicators are added in the future that also fall into the category of "binding an infinite-range oscillator", we will make that clear in the release notes when that new addition is published.
To help set the stage for this discussion, it's important to note that the broader challenge of "equalizing inputs" is nothing new. In fact, it's a key element in many of the most popular fields of data science, such as AI and Machine Learning. They need to take a diverse set of inputs with a wide variety of ranges and seemingly-random inputs (referred to as "features"), and build a mathematical or computational model in order to work. But, when the raw inputs can vary significantly from one another, there is an inherent need to do some pre-processing to those inputs so that one doesn't overwhelm another simply due to the difference in raw values between them. This is where feature scaling comes into play.
With this in mind, we implemented 2 of the most common methods of Feature Scaling - Min-Max Normalization (which we call "Normalization" in our settings), and Z-Score Normalization (which we call "Standardization" in our settings). Let's take a look at each of those methods as they have been implemented in this script.
Min-Max Normalization (Normalization)
This is one of the most common - and most basic - methods of feature scaling. The basic formula is: y = (x - min)/(max - min) - where x is the current data sample, min is the lowest value in the dataset, and max is the highest value in the dataset. In this transformation, the max would evaluate to 1, and the min would evaluate to 0, and any value in between the min and the max would evaluate somewhere between 0 and 1.
The key benefits of this method are:
It can be used to transform datasets of any range into a new dataset with a consistent and known range (0 to 1).
It has no dependency on the "shape" of the raw input dataset (i.e. does not assume the input dataset can be approximated to a normal distribution).
But there are a couple of "gotchas" with this technique...
First, it assumes the input dataset is complete, or an accurate representation of the population via random sampling. While in most situations this is a valid assumption, in trading indicators we don't really have that luxury as we're often limited in what sample data we can access (i.e. number of historical bars available).
Second, this method is highly sensitive to outliers. Since the crux of this transformation is based on the max-min to define the initial range, a single significant outlier can result in skewing the post-transformation dataset (i.e. major price movement as a reaction to a significant news event).
You can potentially mitigate those 2 "gotchas" by using a mechanism or technique to find and discard outliers (e.g. calculate the mean and standard deviation of the input dataset and discard any raw values more than 5 standard deviations from the mean), but if your most recent datapoint is an "outlier" as defined by that algorithm, processing it using the "scrubbed" dataset would result in that new datapoint being outside the intended range of 0 to 1 (e.g. if the new datapoint is greater than the "scrubbed" max, it's post-transformation value would be greater than 1). Even though this is a bit of an edge-case scenario, it is still sure to happen in live markets processing live data, so it's not an ideal solution in our opinion (which is why we chose not to attempt to discard outliers in this manner).
Z-Score Normalization (Standardization)
This method of rescaling is a bit more complex than the Min-Max Normalization method noted above, but it is also a widely used process. The basic formula is: y = (x – μ) / σ - where x is the current data sample, μ is the mean (average) of the input dataset, and σ is the standard deviation of the input dataset. While this transformation still results in a technically-infinite possible range, the output of this transformation has a 2 very significant properties - the mean (average) of the output dataset has a mean (μ) of 0 and a standard deviation (σ) of 1.
The key benefits of this method are:
As it's based on normalizing the mean and standard deviation of the input dataset instead of a linear range conversion, it is far less susceptible to outliers significantly affecting the result (and in fact has the effect of "squishing" outliers).
It can be used to accurately transform disparate sets of data into a similar range regardless of the original dataset's raw/actual range.
But there are a couple of "gotchas" with this technique as well...
First, it still technically does not do any form of range-binding, so it is still technically unbounded (range -∞ to ∞ with a mid-point of 0).
Second, it implicitly assumes that the raw input dataset to be transformed is normally distributed, which won't always be the case in financial markets.
The first "gotcha" is a bit of an annoyance, but isn't a huge issue as we can apply principles of normal distribution to conceptually limit the range by defining a fixed number of standard deviations from the mean. While this doesn't totally solve the "infinite range" problem (a strong enough sudden move can still break out of our "conceptual range" boundaries), the amount of movement needed to achieve that kind of impact will generally be pretty rare.
The bigger challenge is how to deal with the assumption of the input dataset being normally distributed. While most financial markets (and indicators) do tend towards a normal distribution, they are almost never going to match that distribution exactly. So let's dig a bit deeper into distributions are defined and how things like trending markets can affect them.
Skew (skewness): This is a measure of asymmetry of the bell curve, or put another way, how and in what way the bell curve is disfigured when comparing the 2 halves. The easiest way to visualize this is to draw an imaginary vertical line through the apex of the bell curve, then fold the curve in half along that line. If both halves are exactly the same, the skew is 0 (no skew/perfectly symmetrical) - which is what a normal distribution has (skew = 0). Most financial markets tend to have short, medium, and long-term trends, and these trends will cause the distribution curve to skew in one direction or another. Bullish markets tend to skew to the right (positive), and bearish markets to the left (negative).
Kurtosis: This is a measure of the "tail size" of the bell curve. Another way to state this could be how "flat" or "steep" the bell-shape is. If the bell is steep with a strong drop from the apex (like a steep cliff), it has low kurtosis. If the bell has a shallow, more sweeping drop from the apex (like a tall hill), is has high kurtosis. Translating this to financial markets, kurtosis is generally a metric of volatility as the bell shape is largely defined by the strength and frequency of outliers. This is effectively a measure of volatility - volatile markets tend to have a high level of kurtosis (>3), and stable/consolidating markets tend to have a low level of kurtosis (<3). A normal distribution (our reference), has a kurtosis value of 3.
So to try and bring all that back together, here's a quick recap of the Standardization rescaling method:
The Standardization method has an assumption of a normal distribution of input data by using the mean (average) and standard deviation to handle the transformation
Most financial markets do NOT have a normal distribution (as discussed above), and will have varying degrees of skew and kurtosis
Q: Why are we still favoring the Standardization method over the Normalization method, and how are we accounting for the innate skew and/or kurtosis inherent in most financial markets?
A: Well, since we're only trying to rescale oscillators that by-definition have a midpoint of 0, kurtosis isn't a major concern beyond the affect it has on the post-transformation scaling (specifically, the number of standard deviations from the mean we need to include in our "artificially-bound" range definition).
Q: So that answers the question about kurtosis, but what about skew?
A: So - for skew, the answer is in the formula - specifically the mean (average) element. The standard mean calculation assumes a complete dataset and therefore uses a standard (i.e. simple) average, but we're limited by the data history available to us. So we adapted the transformation formula to leverage a moving average that included a weighting element to it so that it favored recent datapoints more heavily than older ones. By making the average component more adaptive, we gained the effect of reducing the skew element by having the average itself be more responsive to recent movements, which significantly reduces the effect historical outliers have on the dataset as a whole. While this is certainly not a perfect solution, we've found that it serves the purpose of rescaling the MACD and AO to a far more well-defined range while still preserving the oscillator behavior and mid-line exceptionally well.
The most difficult parts to compensate for are periods where markets have low volatility for an extended period of time - to the point where the oscillators are hovering around the 0/midline (in the case of the AO), or when the oscillator and signal lines converge and remain close to each other (in the case of the MACD). It's during these periods where even our best attempt at ensuring accurate mirrored-behavior when compared to the original can still occasionally lead or lag by a candle.
Note: If this is a make-or-break situation for you or your strategy, then we recommend you do not use any of the included indicators that leverage this kind of bounding technique (the AO and MACD at time of publication) and instead use the Trandingview built-in versions!
We know this is a lot to read and digest, so please take your time and feel free to ask questions - we will do our best to answer! And as always, constructive feedback is always welcome!
Search in scripts for "oscillator"

Crypto rsi cci mf stoch rsi oscillators all in one strategyThis is a strategy based on the popular oscillator like RSI, CCI, MF and Stochastic RSI oscillators.
In this situation I use a very high length , 100 candles, and the middle point between overbought and oversold levels at 50.
The entry for long is when all oscilators are above 50, and the exit is when they are below 50 + plus some minor modifications
If you have any questions, please message me a private message !

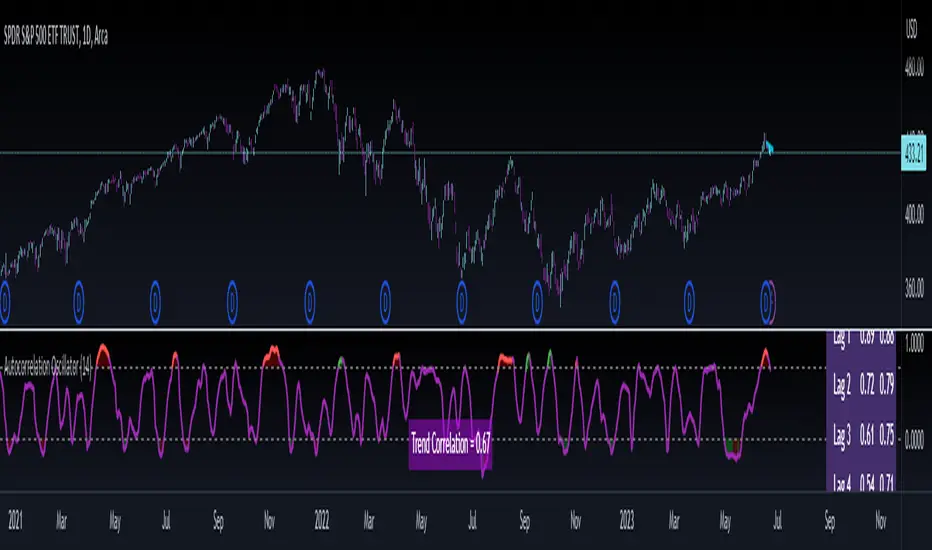
MTF Oscillator Framework [PineCoders]This framework allows Pine coders to quickly build a complete multi-timeframe oscillator from any calculation producing values around a centerline, whether the values are bounded or not. Insert your calculation in the script and you have a ready-to-publish MTF Oscillator offering a plethora of presentation options and features.
█ HOW TO USE THE FRAMEWORK
1 — Insert your calculation in the `f_signal()` function at the top of the "Helper Functions" section of the script.
2 — Change the script's name in the `study()` declaration statement and the `alertcondition()` text in the last part of the "Plots" section.
3 — Adapt the default value used to initialize the CENTERLINE constant in the script's "Constants" section.
4 — If you want to publish the script, copy/paste the following description in your new publication's description and replace the "OVERVIEW" section with a description of your calculations.
5 — Voilà!
═════════════════════════════════════════════════════════════════════════
█ OVERVIEW
This oscillator calculates a directional value of True Range. When a bar is up, the positive value of True Range is used. A negative value is used when the bar is down. When there is no movement during the bar, a zero value is generated, even if True Range is different than zero. Because the unit of measure of True Range is price, the oscillator is unbounded (it does not have fixed upper/lower bounds).
True Range can be used as a metric for volatility, but by using a signed value, this oscillator will show the directional bias of progressively increasing/decreasing volatility, which can make it more useful than an always positive value of True Range.
The True Range calculation appeared for the first time in J. Welles Wilder's New Concepts in Technical Trading Systems book published in 1978. Wilder's objective was to provide a reliable measure of the effective movement—or range—between two bars, to measure volatility. True Range is also the building block used to calculate ATR (Average True Range), which calculates the average of True Range values over a given period using the `rma` averaging method—the same used in the calculation of another of Wilder's remarkable creations: RSI.
█ CONCEPTS
This oscillator's design stems from a few key concepts.
Relative Levels
Other than the centerline, relative rather than absolute levels are used to identify levels of interest. Accordingly, no fixed levels correspond to overbought/oversold conditions. Relative levels of interest are identified using:
• A Donchian channel (historical highs/lows).
• The oscillator's position relative to higher timeframe values.
• Oscillator levels following points in time where a divergence is identified.
Higher timeframes
Two progressively higher timeframes are used to calculate larger-context values for the oscillator. The rationale underlying the use of timeframes higher than the chart's is that, while they change less frequently than the values calculated at the chart's resolution, they are more meaningful because more work (trader activity) is required to calculate them. Combining the immediacy of values calculated at the chart's resolution to higher timeframe values achieves a compromise between responsiveness and reliability.
Divergences as points of interest rather than directional clues
A very simple interpretation of what constitutes a divergence is used. A divergence is defined as a discrepancy between any bar's direction and the direction of the signal line on that same bar. No attempt is made to attribute a directional bias to divergences when they occur. Instead, the oscillator's level is saved and subsequent movement of the oscillator relative to the saved level is what determines the bullish/bearish state of the oscillator.
Conservative coloring scheme
Several additive coloring conditions allow the bull/bear coloring of the oscillator's main line to be restricted to specific areas meeting all the selected conditions. The concept is built on the premise that most of the time, an oscillator's value should be viewed as mere noise, and that somewhat like price, it only occasionally conveys actionable information.
█ FEATURES
Plots
• Three lines can be plotted. They are named Main line , Line 2 and Line 3 . You decide which calculation to use for each line:
• The oscillator's value at the chart's resolution.
• The oscillator's value at a medium timeframe higher than the chart's resolution.
• The oscillator's value at the highest timeframe.
• An aggregate line calculated using a weighed average of the three previous lines (see the Aggregate Weights section of Inputs to configure the weights).
• The coloring conditions, divergence levels and the Hi/Lo channel always apply to the Main line, whichever calculation you decide to use for it.
• The color of lines 2 and 3 are fixed but can be set in the "Colors" section of Inputs.
• You can change the thickness of each line.
• When the aggregate line is displayed, higher timeframe values are only used in its calculation when they become available in the chart's history,
otherwise the aggregate line would appear much later on the chart. To indicate when each higher timeframe value becomes available,
a small label appears near the centerline.
• Divergences can be shown as small dots on the centerline.
• Divergence levels can be shown. The level and fill are determined by the oscillator's position relative to the last saved divergence level.
• Bull/bear markers can be displayed. They occur whenever a new bull/bear state is determined by the "Main Line Coloring Conditions".
• The Hi/Lo (Donchian) channel can be displayed, and its period defined.
• The background can display the state of any one of 11 different conditions.
• The resolutions used for the higher timeframes can be displayed to the right of the last bar's value.
• Four key values are always displayed in the Data Window (fourth icon down to the right of your chart):
oscillator values for the chart, medium and highest timeframes, and the oscillator's instant value before it is averaged.
Main Line Coloring Conditions
• Nine different conditions can be selected to determine the bull/bear coloring of the main line. All conditions set to "ON" must be met to determine the bull/bear state.
• A volatility state can also be used to filter the conditions.
• When the coloring conditions and the filter do not allow for a bull/bear state to be determined, the neutral color is used.
Signal
• Seven different averages can be used to calculate the average of the oscillator's value.
• The average's period can be set. A period of one will show the instant value of the oscillator,
provided you don't use linear regression or the Hull MA as they do not work with a period of one.
• An external signal can be used as the oscillator's instant value. If an already averaged external value is used, set the period to one in this indicator.
• For the cases where an external signal is used, a centerline value can be set.
Higher Timeframes
• The two higher timeframes are named Medium timeframe and Highest timeframe . They can be determined using one of three methods:
• Auto-steps: the higher timeframes are determined using the chart's resolution. If the chart uses a seconds resolution, for example,
the medium and highest resolutions will be 15 and 60 minutes.
• Multiples: the timeframes are calculated using a multiple of the chart's resolution, which you can set.
• Fixed: the set timeframes do not change with the chart's resolution.
Repainting
• Repainting can be controlled separately for the chart's value and the higher timeframe values.
• The default is a repainting chart value and non-repainting higher timeframe values. The Aggregate line will thus repaint by default,
as it uses the chart's value along with the higher timeframes values.
Aggregate Weights
• The weight of each component of the Aggregate line can be set.
• The default is equal weights for the three components, meaning that the chart's value accounts for one third of the weight in the Aggregate.
High Volatility
• This provides control over the volatility filter used in the Main line's coloring conditions and the background display.
• Volatility is determined to be high when the short-term ATR is greater than the long-term ATR.
Colors
• You can define your own colors for all of the oscillator's plots.
• The default colors will perform well on both white and black chart backgrounds.
Alerts
• An alert can be defined for the script. The alert will trigger whenever a bull/bear marker appears in the indicator's display.
The particular combination of coloring conditions and the display of bull/bear markers when you create the alert will thus determine when the alert triggers.
Once the alerts are created, subsequent changes to the conditions controlling the display of markers will not affect the existing alert(s).
• You can create multiple alerts from this script, each triggering on different conditions.
Backtesting & Trading Engine Signal Line
• An invisible plot named "BTE Signal" is provided. It can be used as an entry signal when connected to the PineCoders Backtesting & Trading Engine as an external input.
It will generate an entry whenever a marker is displayed.
Look first. Then leap.

Trendlines with Breaks Oscillator [LuxAlgo]The Trendlines with Breaks Oscillator is an oscillator based on the Trendlines with Breaks indicator, and tracks the maximum distance on price from bullish and bearish trendline breakouts.
The oscillator features divergences and trendline breakout detection.
🔶 USAGE
This tool is based on our Trendlines with Breaks indicator, which detects bullish and bearish trendlines and highlights the breaks on the chart. Now, we bring you this tool as an oscillator.
The oscillator calculates the maximum distance between the price and the break of each trendline, for both bullish and bearish cases, then calculates the delta between both.
When the oscillator is above 0, the market is in an uptrend; when it is below 0, it is in a downtrend. An ascending slope indicates positive momentum, and a descending slope indicates negative momentum.
Trendline breaks are displayed as green and red dots on the oscillator. A green dot corresponds to a bullish break of a descending trendline, and a red dot corresponds to a bearish break of an ascending trendline.
The oscillator calculation depends on two parameters from the settings panel: short and long alpha length. These parameters are used to calculate a synthetic EMA with a variable alpha for both bullish and bearish breaks. The final result is the difference between the two averages.
As shown in the image, using the same trend detection parameters but different alphas can produce very different results. The larger the alphas, the smoother the oscillator becomes, detecting bigger trends but making it less reactive.
This tool features the same trendline detection system as the Trendlines with Breaks indicator, which is based on three main parameters: swing length, slope, and calculation method.
As we can see in the image above, the data collected for the oscillator calculation will be different when using different parameters. A larger length detects larger trends. A larger slope or a different calculation method also impacts the final result.
🔹 Signal Line
The signal line is a smoothed version of the oscillator; traders can choose the smoothing method and length used from the settings panel.
In the image, the signal line crossings are displayed as vertical lines. As we can see, the market usually corrects downward after a bearish crossing and corrects upward after a bullish crossing.
Traders can choose among 10 different smoothing methods for the signal line. In the image, we can see how different methods and lengths give different outputs.
🔹 Divergences
The tool features a divergence detector that helps traders understand the strength behind price movements. Traders can adjust the detection length from the settings panel.
As shown in the image, a bearish divergence occurs when the price prints higher highs, but the momentum on the histogram prints lower highs. A bullish divergence occurs when the price prints lower lows, but the histogram prints higher lows.
By adjusting the length of the divergence detector, traders can filter out smaller divergences, allowing the tool to only detect more significant ones.
The image above depicts divergences detected with different lengths; the larger the length, the bigger the divergences are detected.
🔶 SETTINGS
🔹 Trendlines
Swing Detection Lookback: The size of the market structure used for trendline detection.
Slope: Slope steepness, a value of 0 gives horizontal levels, values larger than 1 give a steeper slope
Slope Calculation Method: Choose how the slope is calculated
🔹 Oscillator
Short Alpha Length: Synthetic EMA short period
Long Alpha Length: Synthetic EMA long period
Smoothing Signal: Choose the smoothing method and period
Divergences: Enable or disable divergences and select the detection length.
🔹 Style
Bullish: Select bullish color.
Bearish: Select bearish color.

RSI+Stoch Band Oscillator📈 RSI + Stochastic Band Oscillator
Overview:
The RSI + Stochastic Band Oscillator is a technical indicator that combines the strengths of both the Relative Strength Index (RSI) and the Stochastic Oscillator. Instead of using static thresholds, this indicator dynamically constructs upper and lower bands based on the RSI and Stochastic overbought/oversold zones. It then measures the relative position of the current price within this adaptive range, effectively producing a normalized oscillator.
Key Components:
RSI-Based Dynamic Bands:
Using RSI values and exponential moving averages of price changes, upper and lower dynamic bands are constructed.
These bands adjust based on overbought and oversold levels, offering a more responsive framework than fixed RSI thresholds.
Stochastic-Based Dynamic Bands:
Similarly, Stochastic %K and %D values are used to construct dynamic bands.
These adapt to overbought and oversold levels by recalculating potential high/low values within the lookback window.
Oscillator Calculation:
The oscillator (osc) is computed as the relative position of the current close within the combined upper and lower bands of both RSI and Stochastic.
This value is normalized between 0 and 100, allowing clear identification of extreme conditions.
Visual Features:
The oscillator is plotted as a line between 0 and 100.
Color-filled areas highlight when the oscillator enters extreme zones:
Above 100 with falling momentum: Red zone (potential reversal).
Below 0 with rising momentum: Green zone (potential reversal).
Additional trend conditions (falling/rising RSI, %K, and %D) are used to strengthen reversal signals by confirming momentum shifts.

Oscillator Suite [KFB Quant]Oscillator Suite is a indicator designed to revolutionize your trading strategy. Developed by kikfraben, this innovative tool aggregates eleven powerful oscillators into one intuitive interface, providing you with a comprehensive view of market sentiment like never before.
Originality and Innovation:
Unlike traditional indicators that focus on single aspects of market analysis, Oscillator Suite stands out by integrating multiple oscillators, making it a pioneering solution in technical analysis. This unique approach empowers traders to gain deeper insights into market dynamics and make more informed trading decisions.
Functionality:
Oscillator Suite calculates signals for each selected oscillator based on its specific formula, offering a diverse range of market insights. Whether you're assessing trend strength, market momentum, or price movements, this indicator has you covered.
Aggregated Score:
The indicator combines signals from all chosen oscillators into an aggregated score, providing a holistic assessment of market sentiment. This aggregated score serves as a powerful tool for identifying trends and potential trading opportunities.
Customization and Ease of Use:
With customizable parameters such as colors, smoothing options, and oscillator settings, Oscillator Suite can be tailored to suit your unique trading style and preferences. Its user-friendly interface makes it easy to interpret and act upon the information presented.
How to Use:
Identify Trends: Analyze the aggregated score and individual oscillator signals to identify prevailing market trends.
Confirm Trade Signals: Use multiple oscillator alignments to strengthen the conviction behind trade signals.
Manage Risk: Gain insight into potential reversals or trend continuations to effectively manage risk.
This is not financial advice. Trading is risky & most traders lose money. Past performance does not guarantee future results. This indicator is for informational & educational purposes only.

ArcTan Oscillator [LuxAlgo]The following indicator is a normalized oscillator making use of the arc tangent sigmoid function (ArcTan), this allows to "squarify" the output result, thus visually filtering out certain variations originally in the oscillator. The magnitude of this effect can be controlled by the user. The indicator contains a gradient that shows the possibility of a reversal, with red colors indicating that a reversal might occur.
Settings
Length : Period of the oscillator
Pre-Gain : Changes the amplitude of the oscillator before passing through the ArcTan function, this allows to amplify/reduce the "squarification" effect introduced by this function. In order to make it easier for the user, the setting is in a (-10,10) range, with negative values reducing the amplitude and positive one increasing it.
Src : Source input of the indicator
Usage
The oscillator can be used to determine the direction of the trend by looking at its sign, if the oscillator is positive, market is up-trending, else down-trending, based on this usage the user might not be interested to look at every variations produced by the oscillator, this is where the hyperbolic tangent function and pre-gain setting can be useful, by using an high value of pre-gain the user will be able to only focus on the sign of the oscillator.
Here pre-gain is set to 5, we can see that the oscillator is now easier to visualize. However, the use of sigmoid functions remove useful information for a trader that needs to find divergences, this is where using a negative value of the pre-gain setting will result useful.
Here pre-gain is set to -5.
The indicator makes use of a gradient to show potential reversals, this gradient is determined by the correlation between the oscillator and the price (this is a way to measure potential divergences). If the color is closer to red it means that a potential reversal might occur, it is possible to say in which direction price might go by looking at the sign of the oscillator, so if the gradient is red and the oscillator is negative price might rise. The gradient is not affected by the pre-gain setting.

Divergence Indicator (any oscillator)A modification of the TV builtin "Divergence indicator" (Version 10) that can be applied to any indicator, and can be plotted on price as well.
Usage:
Add your favorite oscillator, RSI, Klinger, TSI, CMF, or anything else to a chart.
Click the little ... (More) on the oscillator.
Then add this indicator "Divergence Indicator (any oscillator)" on your oscillator of choice.
Click the settings on this indicator and make sure the source is set to the right plot from your oscillator.
Watch for it to plot divergences...
Add this indicator a second time on the price chart (and select the same oscillator plot), but check the box "plot on price (rather than on indicator)""
See you divergence plotted on price (as well as on the oscillator)

L1 Mid-Term Swing Oscillator v1Level: 1
Background
Oscillators are widely used set of technical analysis indicators. They are popular primarily for their ability to alert of a possible trend change before that change manifests itself in price and volume . They should work best in times of sideways markets.
Function
L1 Short-Mid-Long-Term Swing Oscillator puts three terms of oscillators to cover short-term, middle-term and long-term oscillators at the same time. By resonating all these three oscillators, short-term scalping signal and middle term swing signal are disclosed. You can see both short and mid term signal under one indicator which give you more confidence to follow the trend.
Key Signal
I didn't handle the key signals well. I piled up all the useful signals I found, and it is really difficult to classify them one by one. I feel tired when I think about this problem. Therefore, the code of the overall signal is rather confusing, sorry.
Pros and Cons
Pros:
1. Three oscillators are used to cover short, mid, long term oscillations.
2. Short-Mid term resonance can be observed to have higher confidence level.
3. Use single indicator for scalping and swing trading is possible.
Cons:
1. No deep dive into very accurate long and short entries.
2. A trade off between sensitivity and stability may be needed by traders' subjective judge.
Remarks
I enjoyed the fun of put three different oscillator together to cover short, mid, long terms. But how to use them perfectly is really more brainstorming.
Readme
In real life, I am a prolific inventor. I have successfully applied for more than 60 international and regional patents in the past 12 years. But in the past two years or so, I have tried to transfer my creativity to the development of trading strategies. Tradingview is the ideal platform for me. I am selecting and contributing some of the hundreds of scripts to publish in Tradingview community. Welcome everyone to interact with me to discuss these interesting pine scripts.
The scripts posted are categorized into 5 levels according to my efforts or manhours put into these works.
Level 1 : interesting script snippets or distinctive improvement from classic indicators or strategy. Level 1 scripts can usually appear in more complex indicators as a function module or element.
Level 2 : composite indicator/strategy. By selecting or combining several independent or dependent functions or sub indicators in proper way, the composite script exhibits a resonance phenomenon which can filter out noise or fake trading signal to enhance trading confidence level.
Level 3 : comprehensive indicator/strategy. They are simple trading systems based on my strategies. They are commonly containing several or all of entry signal, close signal, stop loss, take profit, re-entry, risk management, and position sizing techniques. Even some interesting fundamental and mass psychological aspects are incorporated.
Level 4 : script snippets or functions that do not disclose source code. Interesting element that can reveal market laws and work as raw material for indicators and strategies. If you find Level 1~2 scripts are helpful, Level 4 is a private version that took me far more efforts to develop.
Level 5 : indicator/strategy that do not disclose source code. private version of Level 3 script with my accumulated script processing skills or a large number of custom functions. I had a private function library built in past two years. Level 5 scripts use many of them to achieve private trading strategy.

Simple Harmonic Oscillator (SHO)The indicator is based on Akram El Sherbini's article "Time Cycle Oscillators" published in IFTA journal 2018 (pages 78-80) (www.ftaa.org.hk)
The SHO is a bounded oscillator for the simple harmonic index that calculates the period of the market’s cycle. The oscillator is used for short and intermediate terms and moves within a range of -100 to 100 percent. The SHO has overbought and oversold levels at +40 and -40, respectively. At extreme periods, the oscillator may reach the levels of +60 and -60. The zero level demonstrates an equilibrium between the periods of bulls and bears. The SHO oscillates between +40 and -40. The crossover at those levels creates buy and sell signals. In an uptrend, the SHO fluctuates between 0 and +40 where the bulls are controlling the market. On the contrary, the SHO fluctuates between 0 and -40 during downtrends where the bears control the market. Reaching the extreme level -60 in an uptrend is a sign of weakness. Mostly, the oscillator will retrace from its centerline rather than the upper boundary +40. On the other hand, reaching +60 in a downtrend is a sign of strength and the oscillator will not be able to reach its lower boundary -40.
Centerline Crossover Tactic
This tactic is tested during uptrends. The buy signals are generated when the WPO/SHI cross their centerlines to the upside. The sell signals are generated when the WPO/SHI cross down their centerlines. To define the uptrend in the system, stocks closing above their 50-day EMA are considered while the ADX is above 18.
Uptrend Tactic
During uptrends, the bulls control the markets, and the oscillators will move above their centerline with an increase in the period of cycles. The lower boundaries and equilibrium line crossovers generate buy signals, while crossing the upper boundaries will generate sell signals. The “Re-entry” and “Exit at weakness” tactics are combined with the uptrend tactic. Consequently, we will have three buy signals and two sell signals.
Sideways Tactic
During sideways, the oscillators fluctuate between their upper and lower boundaries. Crossing the lower boundary to the upside will generate a buy signal. On the other hand, crossing the upper boundary to the downside will generate a sell signal. When the bears take control, the oscillators will cross down the lower boundaries, triggering exit signals. Therefore, this tactic will consist of one buy signal and two sell signals. The sideway tactic is defined when stocks close above their 50-day EMA and the ADX is below 18

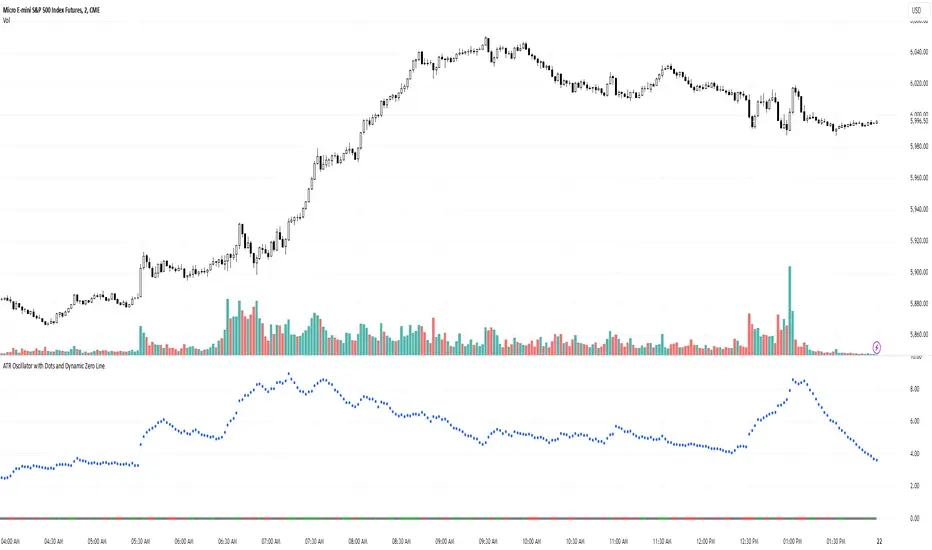
ATR Oscillator with Dots and Dynamic Zero LineWhat It Is
The ATR Oscillator with Dots and Dynamic Zero Line is a custom indicator based on the Average True Range (ATR), designed to provide traders with enhanced insights into market volatility and directional bias. Unlike traditional ATR oscillators that plot continuous lines, this version uses distinct dots to display ATR values and includes a dynamic zero line that changes color based on market direction (uptrend, downtrend, or consolidation).
How It Works
ATR Calculation:
The indicator calculates the Average True Range over a user-defined period (default: 14 bars). ATR measures market volatility by considering the range between the high, low, and close of each bar.
Dots for ATR Values:
Instead of plotting ATR values as a continuous line, the indicator represents each value as an individual blue dot. This format highlights changes in volatility without visually connecting them, helping to avoid false trends and clutter.
Dynamic Zero Line:
A horizontal zero line provides additional directional context. The line changes color dynamically:
Green: Indicates an uptrend (price is consistently closing higher over consecutive bars).
Red: Indicates a downtrend (price is consistently closing lower over consecutive bars).
Gray: Indicates market consolidation or sideways movement (no clear trend in price).
The thickness and step-like style of the zero line make it visually prominent, enabling quick interpretation of market direction.
What It Does
Visualizes Market Volatility:
By plotting ATR values as dots, the oscillator emphasizes periods of heightened or reduced market activity, helping traders anticipate breakout opportunities or avoid low-volatility zones.
Provides Trend Context:
The dynamic zero line gives traders a clear signal of the prevailing market trend (uptrend, downtrend, or consolidation), which can be used to align trading strategies with the broader market context.
Avoids Misleading Trends:
Unlike traditional ATR oscillators that use continuous lines, this version eliminates visual artifacts caused by noise, such as false trends during consolidation periods.
Simplifies Interpretation:
The combination of ATR dots and a color-coded zero line creates a straightforward and intuitive tool for assessing both volatility and market direction.
Why It’s More Useful Than a Traditional ATR Oscillator
Enhanced Visibility:
The use of dots instead of a continuous line makes it easier to spot discrete changes in ATR values, avoiding visual clutter and false impressions of smooth trends.
Dynamic Market Context:
Traditional ATR oscillators only measure volatility, offering no indication of market direction. The dynamic zero line in this oscillator adds valuable directional context, helping traders align their strategies with the trend.
Better for Range-Bound Markets:
The zero line’s color-changing feature highlights consolidation periods, enabling traders to identify and avoid trading during sideways, low-volatility conditions where false signals are common.
Quick Decision-Making:
With clear visual cues (dots and color-coded lines), traders can quickly assess market conditions without needing to analyze multiple charts or indicators.
Improved Confluence:
The oscillator’s signals can easily be combined with other tools like VWAP, Volume Profile, or Order Flow indicators for more confident trade decisions.
When to Use It
Trending Markets:
Use the dynamic zero line to confirm the market’s direction and align trades accordingly.
Breakout Opportunities:
Look for periods of increasing ATR (dots moving higher) to anticipate high-volatility breakout scenarios.
Avoiding Noise:
During consolidation (gray zero line), this oscillator warns traders to wait for clearer signals before entering trades.
QQE Weighted Oscillator [LuxAlgo]The QQE (Quantitative Qualitative Estimation) Weighted Oscillator improves on its original version by weighting the RSI based on the indications given by the trailing stop, requiring more effort in order for a cross with the trailing stop to occur.
🔶 USAGE
The QQE Weighted Oscillator is comprised of a smoothed RSI oscillator and a trailing stop derived from this same RSI. The oscillator can be used to indicate whether the market is overbought/oversold as well as an early indication of trend reversals thanks to the leading nature of the RSI.
Using higher Factor values will return a longer-term trailing stop.
Like with a regular RSI divergence can be indicative of a reversal.
Further weighting will control how much "effort" is required for the trailing stop to cross the RSI. For example. For example, an RSI above the trailing stop will require a higher degree of negative price variations in order for a potential cross to occur when using higher weights.
This can cause higher weightings to return more cyclical and smoother results.
🔶 SETTINGS
Length: Length of the RSI oscillator.
Factor: Multiplicative factor used for the trailing stop calculation.
Smooth: Degree of smoothness of the RSI oscillator.
Weight: Degree of weighting used for the RSI calculation.

Revolver Oscillator Strategy 1.2 (RSI+UO+MFI)ROS (Revolver Oscillator Strategy)
Version 1.2
Description
This script combines three popular oscillators (RSI, Ultimate Oscillator and MFI) to accurately determine the price momentum of an asset.
Context
- RSI (Relative Strength Index) is a momentum oscillator that measures the speed and change of price movements over a period of time (14).
- Ultimate Oscillator uses three different periods (7, 14, and 28) to represent short, medium, and long-term market trends.
- Money Flow Index (MFI) is a momentum indicator that measures the flow of money into and out over a period of time. It is related to the Relative Strength Index (RSI) but incorporates volume, whereas the RSI only considers price
How does it work?
When a RED bar appears, it means that the three oscillators have exceeded the set thresholds, and it is a SELL signal.
When a GREEN bar appears, it means that the three oscillators are below the set thresholds, and it is a BUY signal.
I recommend leaving the default settings.
[JRL] Pivot Regression OscillatorIntroducing the Pivot Regression Oscillator. This oscillator uses a similar formula to the Stochastic Oscillator. However, instead of comparing the closing price to the lowest price of a period, it compares the distance between current price and the current pivot point. By basing our oscillator on pivot levels, we incorporate a much more relevant and consequential price point around which to base our comparisons.
The indicator can give reliable overbought and oversold signals, and it plots two exponential moving averages as output, which provides crossover signals that can be used to help time trades.
The Pivot Regression Oscillator can be effective for timing re-entries into a trend and seems to be able to avoid some of the false signals of other indicators.
Let me know if you find this useful. Cheers!

Delta-RSI OscillatorIntroducing the Delta-RSI Oscillator.
This oscillator is a time derivative of the RSI, plotted as a histogram and serving as a momentum indicator. The derivative is calculated explicitly by means of local polynomial regression. It is designed to provide minimum false and premature buy/sell signals compared to many traditional momentum indicators such as Momentum, RSI, Rate of Change.
Application:
Potential trading signals provided by the Delta-RSI Oscillator include:
- zero crossing (negative-to-positive as a bullish sign and positive-to-negative sign as a bearish signal),
- change of direction (consider going long if the oscillator starts to advance, and short otherwise).
In addition, the strength of a particular trend can be estimated by looking at the Delta-RSI value (positive D-RSI in case of the uptrend, and negative in case of the downtrend).
Choosing the model Parameters:
-RSI Length: The timeframe of the RSI that is being differentiated.
- Frame Length: The length of the lookback frame used for local regression.
- Polynomial Order: The order of the local polynomial function.
Longer frames and lower order of polynomials will result in a " smoother " D-RSI, but at the expense of greater lag. Increasing the polynomial order while maintaining the frame length will reduce lag while producing more variance. The values set as default (Length=18, Order=2) were found to provide optimum the variance/lag tradeoff. However, other options (e.g., Length=35, Order=3) can also work well.
Relationship with other methods:
When developing this indicator, I was inspired by Connie Brown’s Derivative Oscillator. The latter pursues the same goal but evaluates the RSI derivative by means of triple smoothing. This paves the way for more clear interpretation and easier tuning of model parameters.

Milan OscillatorBill Williams Breakout Setup
I have referred to the man multiple times whether tweeting about him or writing a blog post. Now I want to relearn how breakout trading works, again. A while ago, my friend invited a bunch of us into a Zoom conference sharing us how his setup works for him. He reintroduced me to Bill Williams' indicators which looked like below.
The rules are simple:
Prices are moving away from Alligator, open and closed above the first time.
AC is twice consecutively at par with the direction.
AO is twice consecutively at par with the direction.
Entry on the third candle to be sure, or the second if you're willing to risk it.
The chart above is an example from the 4 hourly time-frame. Before going into any entry, to get a macro perspective, should check on these time-frames first:
Weekly
3 Days
Daily
Bonus points if monthly time-frame is also at par with the bias. Here are the charts for the larger time-frame.
It's been profitable trading with the above setup but then I have an itch to scratch. I wanted to have just a single oscillator instead of two to look at. It will enable me to make decisions faster and can use my brain juice to think about something else.
So I combined the two to create a new oscillator. I call it the `Milan Oscillator` in honor of my friend Patris who reintroduced me to Bill Williams yet again. Patris' favorite team is AC Milan, here's to you bro 🍺
Here are the same charts above with Milan Oscillator.
The rules are a bit different than the rules above:
No entry when the oscillator is gray, this means AC and AO are disagreeing.
Prices are moving away from Alligator, open and closed above the first time.
Oscillator is twice consecutively at par with the direction.
Entry on the third candle to be sure, or the second if you're willing to risk it.
On lower volume moves, prices will retest alligator, can be an entry if the retest fails.
Feedbacks are appreciated.

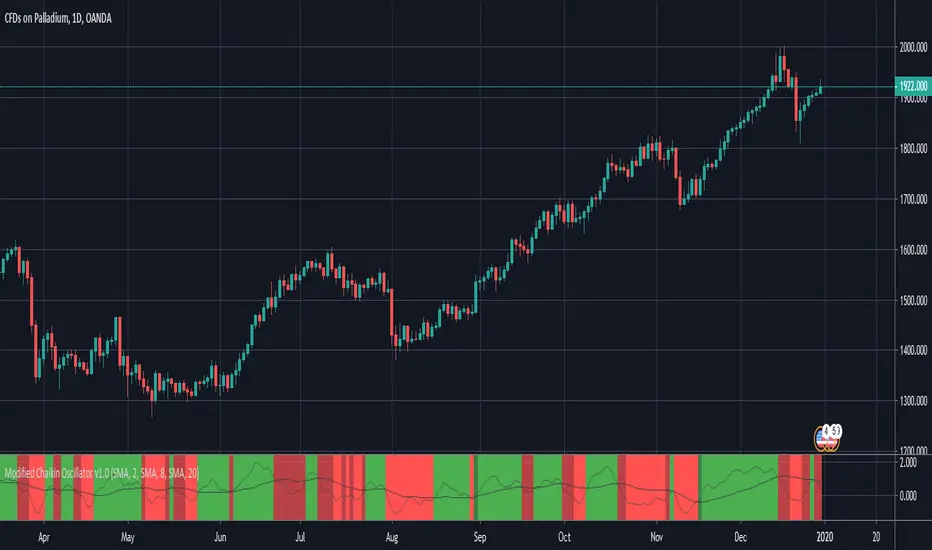
Modified Chaikin OscillatorThis is a modified version of the Chaikin Oscillator. The idea is to find accumulation and distribution phases in the market to identify when institutions are building their positions.
It uses acc/dist but as an oscillator, just like the Chaikin Oscillator, but not to find overbought or oversold areas, but to find trends. It functions like a MACD. It takes a fast moving average of the acc/dist and a slow moving average of the acc/dist, and plots the differense to create the oscillator, and uses a signal line to use for entries.
A strong signal is when the oscillator crosses the signal line while the signal line is on he right side of 0. So a crossover (long) when the signal line is below 0 woul be a weak signal, while a crossover (long) when the signal line is above 0 would be a strong signal.
By default, tick volume is discarded in the calculation, which makes this version behave a bit differently than the standard Chaikin Oscillator. This is because the indicator is mostly used to trade CFD's. If used to trade stocks for example, it is better to include the volume by unchecking that checkbox in the indicator settings.
BRIGHT GREEN = Strong signal LONG (signal line is above 0)
DARK GREEN = Weak signal LONG (signal line is below 0)
BRIGHT RED = Strong signal SHORT (signal line is below 0)
DARK RED = Weak signal SHORT (signal line is above 0)
Momentum Divergence Oscillator by JJMomentum Divergence Oscillator by JJ
A powerful, all-in-one momentum tool designed to streamline trade confluence, combining multi-timeframe trend analysis with automatic divergence spotting and classic MACD signals.
How to Use This Indicator
This oscillator is designed to be used in the lower pane of your chart, beneath your primary price chart. It provides three main types of signals:
1. Multi-Timeframe (MTF) Trend Confirmation
The background shading is your primary trend filter. It looks at the MACD trend on two higher timeframes (30m and 60m by default) to confirm the market's overarching direction.
Green Shading: Indicates that both higher timeframes are in a bullish trend (MACD above signal line). Focus on looking for BUY signals during this time.
Red Shading: Indicates that both higher timeframes are in a bearish trend. Focus on looking for SELL signals during this time.
Grey/No Shading: The higher timeframes are not in agreement or are consolidating. Exercise caution or stick to standard price action rules.
2. Automatic Divergence Signals
Divergence is a powerful early warning system where the indicator moves in the opposite direction of the price. The indicator automatically flags these occurrences:
"Bull RSI Div" (Green Label-Up): Bullish divergence identified using the RSI oscillator. This suggests a potential reversal to the upside after a downtrend.
"Bear RSI Div" (Red Label-Down): Bearish divergence identified using the RSI oscillator. This suggests a potential reversal to the downside after an uptrend.
Tip: These signals are often most reliable when they occur within the corresponding MTF background colour (e.g., a "Bull RSI Div" during a Green MTF background).
3. Momentum Shifts and Crossovers
The standard plots provide immediate insight into market momentum:
Blue/Orange Lines: The traditional MACD line (Blue) and Signal line (Orange).
Histogram (Green/Red Bars): Represents the momentum difference between the MACD and Signal lines.
Zero-Line Crosses (Triangles): Tiny triangles appear when the MACD line crosses the zero line, indicating a shift in long-term momentum.
Peaks & Troughs (X-Crosses): The 'X' markers identify local peaks and troughs in the histogram, sometimes indicating short-term exhaustion of the current move.
Disclaimer: Trading involves significant risk and is not suitable for every investor. This indicator is for educational purposes only and should not be considered financial advice. Always use appropriate risk management.

Volatility Channel Oscillator█ OVERVIEW
"Volatility Channel Oscillator" is a technical indicator that analyzes price volatility relative to dynamic price channels, displaying an oscillator, its moving average, and signals based on crossovers and divergences. The indicator offers customizable overbought and oversold levels, gradient visualization, and divergence detection, supported by alerts for key signals.
█ CONCEPTS
The VCO indicator creates dynamic price channels based on a moving average of the price (calculated as the arithmetic mean of the high and low prices: (high + low) / 2) and market volatility (measured as the average candle range and body size). These channels are not displayed on the chart but are used to calculate the oscillator value, which reflects the position of the closing price relative to the channel width, scaled to a range from -100 to +100, with the zero line as the central point. A moving average of the oscillator (SMA) smooths its values, enabling signals based on crossovers with the zero line or overbought/oversold levels. The indicator also detects divergences between price and the oscillator, which may indicate potential trend reversals. VCO is useful for identifying market momentum, reversal points, and trend confirmation, especially when combined with other technical analysis tools.
█ FEATURES
- Volatility Channels: Calculates invisible chart boundaries based on a simple moving average (SMA) of the price (high + low) / 2 and volatility (average candle range and body). The length parameter (default 30) sets the SMA length, and scale (default 200%) adjusts the channel width.
- Oscillator: Determines the oscillator value in the range of -100 to +100, indicating the closing price's position relative to the volatility channel. Displayed with dynamic coloring (green for positive values, red for negative).
- Oscillator Moving Average: A simple moving average (SMA) of the oscillator values, smoothing its movements. The signalLength parameter (default 20) defines the SMA length. Displayed in yellow with an optional gradient.
- Overbought/Oversold Levels: Configurable thresholds for the oscillator (overbought, default 50; oversold, default -50) and its moving average (maOverbought, default 30; maOversold, default -30), shown as horizontal lines with optional gradients. Band colors change dynamically (red for overbought, green for oversold, gray for neutral) based on the moving average's position relative to maOverbought/maOversold, reinforcing other signals.
- Divergences: Detects bullish (price forms a lower low, oscillator a higher low) and bearish (price forms a higher high, oscillator a lower high) divergences using pivots (pivotLength, default 2). Divergences are displayed with a delay equal to the pivot length; larger lengths increase reliability but delay signals. Use as additional confirmation.
Signals:
- Overbought/Oversold Crossovers: Green triangles (buy) when the oscillator crosses above the oversold level, red triangles (sell) when it crosses below the overbought level.
- Zero Line Crossovers: Buy/sell signals when the oscillator crosses the zero line upward (buy) or downward (sell).
- Moving Average Crossovers: Buy/sell signals when the oscillator's moving average crosses the zero line or the maOverbought/maOversold levels. Dynamic band color changes (red/green) at these crossovers reinforce other signals.
- Visualization: Gradient lines for the oscillator, its moving average, overbought/oversold levels, and zero line, with adjustable transparency. Gradient fill between the oscillator and zero line.
Divergence Labels: "Bull" (bullish) and "Bear" (bearish) labels with customizable color and transparency.
- Alerts: Built-in alerts for divergences, overbought/oversold crossovers, and zero line crossovers by the oscillator and its moving average.
█ HOW TO USE
Add to Chart: Apply the indicator via Pine Editor or the Indicators menu on TradingView.
Configure Settings:
- Channel and Oscillator Settings: Adjust the channel SMA length (length, default 30) and channel scaling (scale, default 200%). Increase scale for high-volatility markets.
- Threshold Levels: Set oscillator overbought (overbought, default 50) and oversold (oversold, default -50) levels, and moving average thresholds (maOverbought, default 30; maOversold, default -30).
- Divergence Settings: Enable/disable divergence detection (calculateDivergence) and set pivot length (pivotLength, default 2). Larger values increase reliability but delay signals.
- Signal Settings: Choose signal types (signalType): overbought/oversold, zero line, moving average, or all.
- Styling: Customize colors for the oscillator, moving average, horizontal levels, and divergence labels. Adjust gradient and fill transparency.
Interpreting Signals:
- Buy Signals: Green triangles below the bar when the oscillator or its moving average crosses above the oversold level or zero line.
- Sell Signals: Red triangles above the bar when the oscillator or its moving average crosses below the overbought level or zero line.
- Moving Average Signals: Green/red triangles when the moving average crosses maOverbought/maOversold levels, indicating potential reversals or trend continuation. Dynamic band color changes (red for overbought, green for oversold) at these crossovers reinforce other signals.
- Divergences: "Bull" (bullish) and "Bear" (bearish) labels indicate potential trend reversals with a delay based on pivot length. Use as confirmation.
- Overbought/Oversold Levels: Monitor price reactions in these zones as potential reversal points. Dynamic band color changes based on the moving average reinforce signals.
Signal Confirmation: Use VCO with other tools, such as pivot levels (for key turning points) or Fibonacci levels (for support/resistance zones).
█ APPLICATIONS
- Trend Trading: Zero line crossovers by the oscillator or its moving average identify momentum in uptrends or downtrends.
- Range Trading: Overbought/oversold levels help identify entry/exit points in sideways markets.
- Divergences: Use bullish/bearish divergences as additional confirmation of reversals, especially near key price levels.
- Trend Identification: To analyze trends over a longer perspective, increase the moving average length (signalLength) for more stable signals.
█ NOTES
- Test the indicator across different timeframes and markets to optimize parameters, such as length and scale, for your trading style.
- In strong trends, overbought/oversold levels may persist, requiring additional signal verification.
- Divergences are more reliable on higher timeframes (H4, D1), where market noise is reduced, but their delay requires caution.
- In low-liquidity markets, signals may be less effective, so use on high-liquidity assets is recommended.
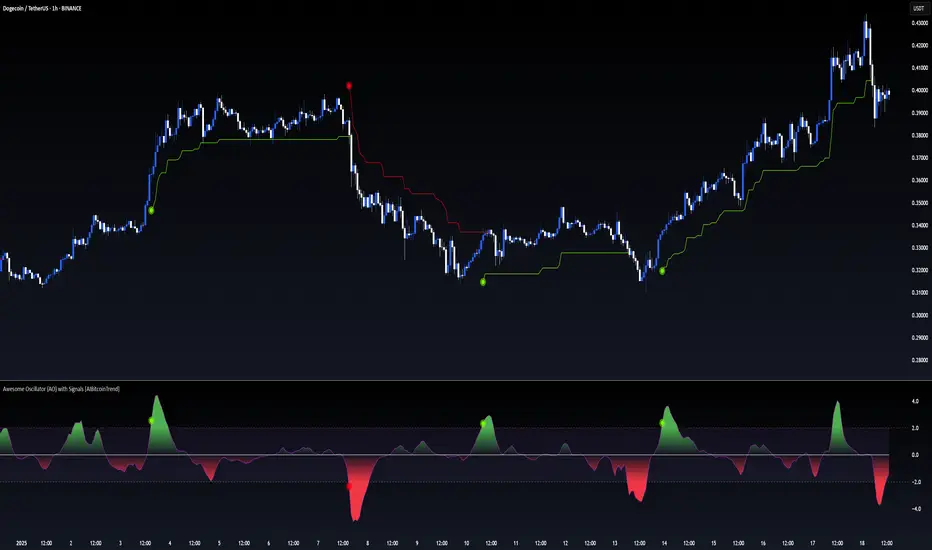
Awesome Oscillator (AO) with Signals [AIBitcoinTrend]👽 Multi-Scale Awesome Oscillator (AO) with Signals (AIBitcoinTrend)
The Multi-Scale Awesome Oscillator transforms the traditional Awesome Oscillator (AO) by integrating multi-scale wavelet filtering, enhancing its ability to detect momentum shifts while maintaining responsiveness across different market conditions.
Unlike conventional AO calculations, this advanced version refines trend structures using high-frequency, medium-frequency, and low-frequency wavelet components, providing traders with superior clarity and adaptability.
Additionally, it features real-time divergence detection and an ATR-based dynamic trailing stop, making it a powerful tool for momentum analysis, reversals, and breakout strategies.
👽 What Makes the Multi-Scale AO – Wavelet-Enhanced Momentum Unique?
Unlike traditional AO indicators, this enhanced version leverages wavelet-based decomposition and volatility-adjusted normalization, ensuring improved signal consistency across various timeframes and assets.
✅ Wavelet Smoothing – Multi-Scale Extraction – Captures short-term fluctuations while preserving broader trend structures.
✅ Frequency-Based Detail Weights – Separates high, medium, and low-frequency components to reduce noise and improve trend clarity.
✅ Real-Time Divergence Detection – Identifies bullish and bearish divergences for early trend reversals.
✅ Crossovers & ATR-Based Trailing Stops – Implements intelligent trade management with adaptive stop-loss levels.
👽 The Math Behind the Indicator
👾 Wavelet-Based AO Smoothing
The indicator applies multi-scale wavelet decomposition to extract high-frequency, medium-frequency, and low-frequency trend components, ensuring an optimal balance between reactivity and smoothness.
sma1 = ta.sma(signal, waveletPeriod1)
sma2 = ta.sma(signal, waveletPeriod2)
sma3 = ta.sma(signal, waveletPeriod3)
detail1 = signal - sma1 // High-frequency detail
detail2 = sma1 - sma2 // Intermediate detail
detail3 = sma2 - sma3 // Low-frequency detail
advancedAO = weightDetail1 * detail1 + weightDetail2 * detail2 + weightDetail3 * detail3
Why It Works:
Short-Term Smoothing: Captures rapid fluctuations while minimizing noise.
Medium-Term Smoothing: Balances short-term and long-term trends.
Long-Term Smoothing: Enhances trend stability and reduces false signals.
👾 Z-Score Normalization
To ensure consistency across different markets, the Awesome Oscillator is normalized using a Z-score transformation, making overbought and oversold levels stable across all assets.
normFactor = ta.stdev(advancedAO, normPeriod)
normalizedAO = advancedAO / nz(normFactor, 1)
Why It Works:
Standardizes AO values for comparison across assets.
Enhances signal reliability, preventing misleading spikes.
👽 How Traders Can Use This Indicator
👾 Divergence Trading Strategy
Bullish Divergence
Price makes a lower low, while AO forms a higher low.
A buy signal is confirmed when AO starts rising.
Bearish Divergence
Price makes a higher high, while AO forms a lower high.
A sell signal is confirmed when AO starts declining.
👾 Buy & Sell Signals with Trailing Stop
Bullish Setup:
✅AO crosses above the bullish trigger level → Buy Signal.
✅Trailing stop placed at Low - (ATR × Multiplier).
✅Exit if price crosses below the stop.
Bearish Setup:
✅AO crosses below the bearish trigger level → Sell Signal.
✅Trailing stop placed at High + (ATR × Multiplier).
✅Exit if price crosses above the stop.
👽 Why It’s Useful for Traders
Wavelet-Enhanced Filtering – Retains essential trend details while eliminating excessive noise.
Multi-Scale Momentum Analysis – Separates different trend frequencies for enhanced clarity.
Real-Time Divergence Alerts – Identifies early reversal signals for better entries and exits.
ATR-Based Risk Management – Ensures stops dynamically adapt to market conditions.
Works Across Markets & Timeframes – Suitable for stocks, forex, crypto, and futures trading.
👽 Indicator Settings
AO Short Period – Defines the short-term moving average for AO calculation.
AO Long Period – Defines the long-term moving average for AO smoothing.
Wavelet Smoothing – Adjusts multi-scale decomposition for different market conditions.
Divergence Detection – Enables or disables real-time divergence analysis. Normalization Period – Sets the lookback period for standard deviation-based AO normalization.
Cross Signals Sensitivity – Controls crossover signal strength for buy/sell signals.
ATR Trailing Stop Multiplier – Adjusts the sensitivity of the trailing stop.
Disclaimer: This indicator is designed for educational purposes and does not constitute financial advice. Please consult a qualified financial advisor before making investment decisions.
SMA Trend Filter Oscillator (Adaptive)The "SMA Trend Filter Oscillator (Adaptive)" indicator is a technical analysis tool that helps traders determine the direction and strength of a trend based on an adaptive Simple Moving Average (SMA). The oscillator calculates the difference between the closing price and the SMA value, allowing for the visualization of price deviation from the average and the assessment of current market dynamics.
Key Features of the Indicator:
Adaptation to Time Frame: The indicator automatically adjusts the SMA length based on the current time frame, making it versatile for use across different time intervals. For example:
Monthly Time Frame: SMA with a length of 50.
Weekly Time Frame: SMA with a length of 40.
Daily Time Frame: SMA with a length of 20.
Hourly Time Frame: SMA with a length of 10.
Intraday Time Frames: SMA with a length of 5 (for time frames up to 15 minutes) or 7 (for others).
SMA-Based Oscillator: The oscillator is calculated as the difference between the closing price and the SMA value. This allows:
Bullish Trend Identification: When the oscillator is above zero (price is above SMA).
Bearish Trend Identification: When the oscillator is below zero (price is below SMA).
Visualization: The oscillator is displayed as a histogram, where:
Green Color indicates a bullish trend.
Red Color indicates a bearish trend.
The Zero Line (Gray) serves as a reference for trend reversal.
How to Use the Indicator:
Trend Identification: If the oscillator is above zero and colored green, it signals a bullish trend. If it is below zero and colored red, it indicates a bearish trend.
Trend Strength: The larger the oscillator value (in either direction), the stronger the trend. Small oscillator values (close to zero) may indicate sideways movement or weak trend.
Entry and Exit Points:
Buy: When the oscillator crosses the zero line from below to above (transition from red to green).
Sell: When the oscillator crosses the zero line from above to below (transition from green to red).
Signal Filtering: Use the indicator in combination with other technical analysis tools (e.g., RSI, MACD, or support/resistance levels) to confirm signals.
Advantages of the Indicator:
Adaptability: Automatic adjustment of SMA length to the current time frame makes it versatile.
Simplicity: Intuitive histogram visualization allows for quick assessment of market conditions.
Flexibility: Can be used on any market (stocks, forex, cryptocurrencies) and time frame.
Limitations:
Lag: Like any SMA-based indicator, it can lag due to the use of average values.
False Signals: In sideways markets (flat), the indicator may generate false signals.
Risk Management:
Always set stop-losses and take-profits to minimize losses.
Test the indicator on historical data before using it on a live account.
The "SMA Trend Filter Oscillator (Adaptive)" is a powerful tool for traders seeking to quickly evaluate trends and their strength. Its adaptability and simplicity make it suitable for both novice and experienced traders.
Индикатор "SMA Trend Filter Oscillator (Adaptive)" — это инструмент технического анализа, который помогает трейдерам определять направление тренда и его силу на основе адаптивной скользящей средней (SMA). Осциллятор рассчитывает разницу между ценой закрытия и значением SMA, что позволяет визуализировать отклонение цены от среднего значения и оценивать текущую рыночную динамику.
Основные особенности индикатора:
Адаптация к таймфрейму
Индикатор автоматически подстраивает длину SMA в зависимости от текущего таймфрейма, что делает его универсальным для использования на различных временных интервалах. Например:
Месячный таймфрейм (Monthly): SMA с длиной 50.
Недельный таймфрейм (Weekly): SMA с длиной 40.
Дневной таймфрейм (Daily): SMA с длиной 20.
Часовой таймфрейм (Hourly): SMA с длиной 10.
Внутридневные таймфреймы (Intraday): SMA с длиной 5 (для таймфреймов до 15 минут) или 7 (для остальных).
Осциллятор на основе SMA
Осциллятор рассчитывается как разница между ценой закрытия и значением SMA. Это позволяет:
Определять бычий тренд, когда осциллятор выше нуля (цена выше SMA).
Определять медвежий тренд, когда осциллятор ниже нуля (цена ниже SMA).
Визуализация
Осциллятор отображается в виде гистограммы, где:
Зелёный цвет указывает на бычий тренд.
Красный цвет указывает на медвежий тренд.
Линия нуля (серая) служит ориентиром для определения смены тренда.
Как использовать индикатор:
Определение тренда
Если осциллятор находится выше нуля и окрашен в зелёный цвет, это сигнализирует о бычьем тренде.
Если осциллятор находится ниже нуля и окрашен в красный цвет, это указывает на медвежий тренд.
Сила тренда
Чем больше значение осциллятора (в положительную или отрицательную сторону), тем сильнее тренд.
Небольшие значения осциллятора (близкие к нулю) могут указывать на боковое движение или слабость тренда.
Точки входа и выхода
Покупка (Buy): Когда осциллятор пересекает нулевую линию снизу вверх (переход из красной зоны в зелёную).
Продажа (Sell): Когда осциллятор пересекает нулевую линию сверху вниз (переход из зелёной зоны в красную).
Фильтрация сигналов
Используйте индикатор в сочетании с другими инструментами технического анализа (например, RSI, MACD или уровнями поддержки/сопротивления) для подтверждения сигналов.
Преимущества индикатора:
Адаптивность: Автоматическая настройка длины SMA под текущий таймфрейм делает индикатор универсальным.
Простота: Интуитивно понятная визуализация в виде гистограммы позволяет быстро оценить рыночную ситуацию.
Гибкость: Может использоваться на любых рынках (акции, форекс, криптовалюты) и таймфреймах.
Ограничения:
Запаздывание: Как и любой индикатор на основе SMA, он может запаздывать из-за использования средних значений.
Ложные сигналы: В условиях бокового движения (флэта) индикатор может генерировать ложные сигналы.
Управление рисками: Всегда устанавливайте стоп-лоссы и тейк-профиты, чтобы минимизировать потери.
Тестирование: Перед использованием на реальном счёте протестируйте индикатор на исторических данных.
Индикатор "SMA Trend Filter Oscillator (Adaptive)" — это мощный инструмент для трейдеров, которые хотят быстро оценить тренд и его силу. Его адаптивность и простота делают его подходящим как для начинающих, так и для опытных трейдеров

Standardized SuperTrend Oscillator
The Standardized SuperTrend Oscillator (SSO) is a versatile tool that transforms the SuperTrend indicator into an oscillator, offering both trend-following and mean reversion capabilities. It provides deeper insights into trends by standardizing the SuperTrend with respect to its upper and lower bounds, allowing traders to identify potential reversals and contrarian signals.
Methodology:
Lets begin with describing the SuperTrend indicator, which is the fundamental tool this script is based on.
SuperTrend:
The SuperTrend is calculated based on the average true range (ATR) and multiplier. It identifies the trend direction by placing a line above or below the price. In an uptrend, the line is below the price; in a downtrend, it's above the price.
pine_st(float src = hl2, float factor = 3., simple int len = 10) =>
float atr = ta.atr(len)
float up = src + factor * atr
up := up < nz(up ) or close > nz(up ) ? up : nz(up )
float lo = src - factor * atr
lo := lo > nz(lo ) or close < nz(lo ) ? lo : nz(lo )
int dir = na
float st = na
if na(atr )
dir := 1
else if st == nz(up )
dir := close > up ? -1 : 1
else
dir := close < lo ? 1 : -1
st := dir == -1 ? lo : up
SSO Oscillator:
The SSO is derived from the SuperTrend and the source price. It calculates the standardized difference between the SuperTrend and the source price. The standardization is achieved by dividing this difference by the distance between the upper and lower bounds of the SuperTrend.
float sso = (src - st) / (up - lo)
Components and Features:
SuperTrend of Oscillator - An additional SuperTrend based on the direction and volatility of the oscillator, behaving as the SuperTrend OF the SuperTrend. This provides further trend analysis of the underlying broad trend regime.
Reversion Tracer - The RSI of the direction of the original SuperTrend, providing a dynamic threshold for premium and discount price areas.
float rvt = ta.rsi(dir, len)
Heikin Ashi Transform - An option to apply the Heikin Ashi transform to the source price of the oscillator, providing a smoother visual representation of trends.
Display Modes - Choose between Line mode for a standard oscillator view or Candle mode, displaying the oscillator as Heikin Ashi candles for more in-depth trend analysis.
Contrarian and Reversion Signals:
Contrarian Signals - Based on the SuperTrend of the oscillator, these signals can act as potential buy or sell indications, highlighting potential trend exhaustion or premature reversals.
Reversion Signals - Generated when the oscillator crosses above or below the Reversion Tracer, signaling potential mean reversion opportunities or trend breakouts.
Utility and Use Cases:
Trend Analysis - Utilize the SSO as a trend-following tool with the added benefits of the oscillator's SuperTrend and Heikin Ashi transform.
Valuation Analysis - Leverage the oscillator's reversion signals for identifying potential mean reversion opportunities in the market.
The Standardized SuperTrend Oscillator enhances the capabilities of the SuperTrend indicator, offering a balanced approach to both trend-following and mean reversion strategies. Its customizable options and contrarian signals make it a valuable instrument for traders seeking comprehensive trend analysis and potential reversal signals.

Autocorrelation OscillatorReleasing the autocorrelation oscillator.
NOTE! Please be sure to read the description. This is a theoretical indicator and its important to understand the theory behind its use.
About the indicator:
Before getting into the indicator and its functionality, its important to discuss the theoretical underpinnings of the indicator.
The autocorrelation oscillator operates on two theories of market behaviour that go hand in hand. Those theories are the market efficiency theory and the random walk theory (or hypothesis ).
Market efficiency theory: The market efficiency theory or "Efficient Market Hypothesis (EMH)" postulates that all available information is reflected in a ticker's price almost instantaneously and thus it is impossible for an investor or trader to get ahead of the market because we cannot respond to the speed that the market responds. Of course, there are many holes in this theory, the most notable being that the market is a function of humans. Absent humans and their technological integrations into the market, the market would cease to react at all. But that's besides the point. This is a widely accepted theory and one in which I can mathematically observe through statistical tests. The truth behind this theory is the market is efficient for responding to evolving economic and financial information, likely owning to huge amounts of computer and algorithmic integration into trading, and thus the market is more efficient than the average person is capable (absent computerized algorithms and integration) of ascertaining nuanced financial and economic circumstances. By the time we the people can appraise information, the market has already acted on it. And that is the main premise of the EMH.
The next theory is the Random Walk Theory or Hypothesis (RWH). This builds on the EMH and essentially postulates that the market reacts so quickly to price in current circumstances that it is too random for people to truly exploit and benefit from.
The result of these two theories is two-fold and can be summarized as such:
a) The market behaves in a chaotic fashion that is seemingly random and is incapable of being predicted effectively; and
b) The market is more efficient than a person in incorporating key fundamental information, contributing to the high degree of seemingly random behaviour.
So, how does this help us?
It is said, because of the EMH and the RWH, the only way to truly exploit the market for profit is by:
a) Buying and holding and investing under the bias that stocks will eventually rise in value; or
b) For short term trading, exploiting the pricing anomalies within the data.
So how do we exploit pricing anomalies within the data?
Well, in my own research on market efficiency and behaviour, I have identified many ways of figuring out some anomalies. One of the most effective ways is by looking at simple correlation of lagged values, or autocorrelation for short.
What is autocorrelation and how to use it in relation to EMH and RWH?
Autocorrelation refers to the correlative relationship among the values in a series. Put simply, its the relationship of the same variable over time. For example, if we wanted to look at the auto-correlation of a ticker's high price, we would take, say, 5 to 7 previous high prices and correlate them with the current high price in a series dataset. If the EMH and RWH are true, the correlation among all the variables should have an average less than 0.5 or greater than -0.5. This would indicate true randomness in the dataset and thus an efficient market.
However, if the average of all of the sum's of these correlations are greater than or equal to 0.5 or less than or equal to -0.5, that indicates there is a high degree of autocorrelation and thus the EMH ad RWH is being invalidated as the market is not operating efficiently. This is an anomaly and this anomaly can be exploited.
So how do we exploit it?
Well, when the EMH and RWH hypothesis is being invalidated, we can expect what I coin as a "Regression to Chaos" i.e. the market will revert back to an efficient equilibrium state. So if we have a high correlation of the lagged variables and a strong uptrend or downtrend correlation, we can expect an inefficient market to correct back to an efficient market (i.e. have a reversal from the current trend).
So how does the indicator work?
The indicator measures the lagged correlation of the previous 5 highs and lows of a ticker. A high correlation among all of the highs and lows that exceeds 0.8 would be an invalidation of the EMH and RWH and thus signal a correction to come (i.e. a Regression to Chaos).
The indicator will display this by changing colour. Red for a bearish reversal and green for a bullish. Let's take a look below using the ticker MSFT:
Above we can see the indicator identifying observed inefficiencies within the MSFT ticker on the 1 minute timeframe. The green vertical lines correspond to potential bullish reversals as a result of bearish inefficiencies, the red correspond to bearish reversals as a result of bullish inefficiencies.
You can see these lead to reversals within the ticker.
Components of the indicator:
In the chart above we see the following that are being indicated by arrows:
Red Arrows: Show the identified inefficiencies. Red for bullish inefficiencies (i.e. bearish reversal), green for bearish inefficiencies (i.e. bullish reversal)
Yellow Arrow: The lagged variable chart. This will display the current correlation among all the lagged variables the indicator is assessing.
Teal arrow: Displays the current strength of the trend by correlating the trend to time. A strong negative value (i.e. a value less than or equal to -0.5) indicates a strong downtrend, a strong positive value indicates the inverse.
You can unselect the data-tables in the settings menu if you just want to view the correlation line itself. This part of the indicator is customizable. You can also define the lookback period; however, it is strongly recommended to leave it at 14 as this maintains the use of this indicator as an oscillator.
And that is the indicator! Let me know your comments, questions and feedback below.
Safe trades everyone!