Heisenberg's Uncertainty BandsHeisenberg's Uncertainty Bands:
This is a volatility indicator to determine and visualize the uncertainty in a securities' price.
In quantum mechanics, the uncertainty principle (also known as Heisenberg's uncertainty principle) is any of a variety of mathematical inequalities asserting a fundamental limit to the accuracy with which the values for certain pairs of physical quantities of a particle, such as position, x, and momentum, p, can be predicted from initial conditions.
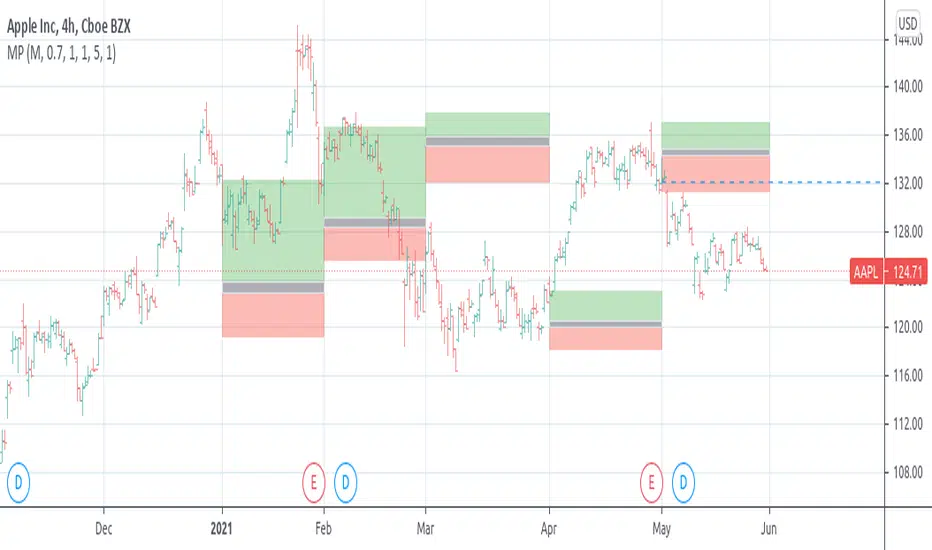
It plots a Kalman filter average of the bars inside a higher timeframe bar, to attempt to find the most frequent price in that bar's timespan. To plot what is effectively a MA using POC (IvanLabrie's code, credits to the author).
It derives momentum from relative momentum, yielding results more sensitive to changes.
Then it uses Heisenberg's uncertainty principle to find an uncertainty range, and uses it as the channel distance from the POC MA, meaning price is likely to fluctuate within that range.
Since uncertainty must be greater than h/2, adding fib levels will make it a useful indicator. Essentially they are pseudo-Fibonacci Bollinger Bands, which uses a different calculation.
Benefits:
Prices fluctuate, and it can be helpful to visualize price as a range, rather than a single point or line. This visualization can help in managing risk, determining entries and exits, and prevent losing one's position due to price fluctuations during a trend.
If we use a particle model, the uncertainty principle dictates that it is impossible to predict the price within a range. This is a good model for risk management!
Usage:
There are 5 Fibonacci ratio outer bands that can be turned on or off according to user's preference.
Recommended that the length inputs should be increased in higher timeframes, to visualize trends, shorter timeframes should have lower lengths.
GLHF
- DPT
Search in scripts for "poc"

[RS]Market ProfileEXPERIMENTAL: this script is very crude and prone to errors..
Request for: FibTrader
instead of a POC line theres a POC area instead, since the script is checking a price area range for the frequency, its possible to average the values but this works as well.
Bookmap Footprint Imbalance BubblesFootprint Imbalance Bubbles (Bookmap Style)
Overview
This indicator brings Bookmap-style order flow visualization directly to your TradingView charts. Instead of standard candles, it detects and plots "Bubbles" at specific price levels where aggressive buying or selling has occurred.
These bubbles represent Volume Imbalances —moments where aggressive market orders overwhelmed limit orders by a significant ratio (e.g., 300% more buying than selling). The size or transparency of the bubble indicates the magnitude of the volume, allowing you to spot "Whales", liquidity sweeps, and understand quality of a price move.
⚠️ Important Requirement
This script uses footprint charts.
To use this indicator, you may need a TradingView plan that supports Footprint Charts (typically Essential, Plus, or Premium). If your plan does not support footprint data, the indicator MAY NOT LOAD.
Footprint charts only have history accurate up to a certain extent(~5 days based on my testing). Replay mode will only be accurate during this timeframe, replaying further will result in unreliable footprint data, resulting in unreliable bubbles.
Key Features
1. Imbalance Detection
The script scans inside every candle at the tick level (Footprint data). It flags price levels where:
Aggressive Buyers > Sellers (by a user-defined ratio, e.g., 3x).
Aggressive Sellers > Buyers.
The total volume at that level exceeds a noise filter.
2. Dynamic Auto-Scaling
Auto-Scale Mode: The indicator automatically detects the largest volume bubble currently on your screen and scales all other bubbles relative to it. This ensures you always see the relative importance of trades, regardless of whether the asset is liquid (like BTC) or illiquid.
3. Two Visual Modes
Size Scaling (Classic): Bubbles grow larger as volume increases.
Transparency Scaling (Heatmap): Bubbles stay a fixed size but become more solid/opaque as volume increases.
4. POC (Point of Control)
Optionally plots a stepped line showing the Point of Control (highest volume price) for each bar, helping you track where value is migrating.
Settings Guide
General
Ticks per Row: Controls the granularity. 1 is the most detailed (tick-by-tick). Higher numbers (e.g., 5 or 10) group ticks together, useful for high-price assets like NQ or BTC.
Bubble Filters
Imbalance Ratio: The strength required to trigger a bubble. Default 3.0 means Buy Volume must be 3x Sell Volume.
Min Volume Filter: The minimum total volume required to show a bubble at all. Use this to hide "noise" and focus on significant activity.
Visual Modes
Auto-Scale Max Volume: Highly recommended. It adjusts the bubble definition based on the current chart view.
Manual Max Volume: If Auto-Scale is off, this defines what volume is required to create a "Huge" bubble.

Volume Profile / Fixed Range [ahDirtCuhzzz.Enhanced]// Enhanced Volume Profile / Fixed Range
// Based on LonesomeTheBlue's original, upgraded to Pine Script v6
// Features: VAH/VAL lines + labels, histogram toggle, histogram flip L/R,
// POC/VAH/VAL y-axis price labels, full color/style customization
// License: Mozilla Public License 2.0
I use TradingViews: Fixed Range Volume Profile Indicator/Drawing Tool regularly but it feels incomplete. I found @LonesomeTheBlue's indicator and made some updates to it.
The features are listed above. Enjoy!

Trend Matrix: Institutional Confluence EngineTrend Matrix: Institutional Confluence Engine
The Institutional Confluence Engine is a professional-grade diagnostic tool designed to solve the two biggest problems in technical analysis: market noise and false breakouts.
Unlike standard lagging indicators, the Institutional Confluence Engine uses a sentient resolution engine to adapt its logic based on whether you are scalping or swing trading. It provides a real-time "Efficiency Grade" for the market, allowing you to ignore "C-Grade" chop and focus exclusively on "A-Grade" institutional trends.
Institutional Confluence and Alerts: Notifies you only when the Local, HTF1, and HTF2 timeframes all align at an "A-Grade" efficiency—the hallmark of a major structural move.
How to Trade It
Identify Confluence: Look for the Status Hub in the top right. When all three grades turn Green (A), institutional alignment is at its peak. This is also visible on the chart.
Monitor Trend Core: The ribbon acts as dynamic support/resistance. "Trend Flares" (brightening of the ribbon) indicate significant volume spikes entering the trend.
Profit Targets: Use the dynamic Green/Red expansion lines. These are volatility-adjusted targets that stretch or contract based on market energy (ATR).
Volume Intelligence
1. The Big Money Heatmap (Volume Intelligence)
Institutional players leave footprints in the form of volume. This engine visualizes these footprints using a dynamic Volume Profile integrated directly into your price action.
Big Money Clusters: These are price levels where massive institutional orders are being "filled." They represent high-conviction zones that act as magnets for price.
Major Buy/Sell Zones (POC): This marks the Point of Control—the exact price where the highest volume has transacted. It represents "Fair Value." Breakouts away from this zone often lead to the most explosive moves.
Gap Prediction: The engine analyzes the sentiment within volume nodes to predict if the market is preparing for an institutional "Gap Up" or "Gap Down."
2. The Golden Bridge (Structural Confluence)
The system calculates the Golden Bridge—a dynamic threshold based on the 0.618 Fibonacci ratio between major structural pivots.
The Logic: In institutional finance, the 0.618 level is the "Line in the Sand." If a rally holds above the Golden Bridge, the trend is structurally sound.
Golden Cluster Stronghold: When the Golden Bridge aligns perfectly with a Big Money Cluster, the system identifies a "Stronghold." This is the highest-probability support or resistance level generated by the engine.
3. MTF Efficiency Grading (A/B/C)
The Trend Matrix doesn't just show direction; it calculates Efficiency.
Grade A (High Efficiency): Price is tracking the trend core with minimal deviation. This is where institutional momentum is strongest.
Grade B (Moderate Efficiency): Healthy trending with standard pullbacks.
Grade C (Low Efficiency/Chop): Price is oscillating. The system will automatically "dim" the interface during these periods to prevent you from over-trading.
4. Status Hub & Intelligent Alerts
The Status Hub provides a real-time cockpit of your trading environment, displaying the "Trend Reliability Score" (0-100%) and Multi-Timeframe grades.
Confluence Alerts: Get notified when the Local, HTF1, and HTF2 timeframes all reach "A-Grade" status simultaneously.
Exhaustion Pillars: Vertical pillars on your chart highlight "Volume Spikes," warning you of potential trend exhaustion before the reversal happens.
How to Use
Check the Hub: Ensure the Trend Reliability is above 75%.
Verify Grade: Look for "A-Grade" efficiency on your local timeframe.
Find the Stronghold: Enter trades where the Golden Bridge and Big Money Clusters overlap for the highest-probability entries.
Target Expansion: Follow the dynamic Green/Red target lines for volatility-adjusted take-profits.
Disclaimer: Trading involves significant risk. This tool is designed for educational and diagnostic purposes and should be used as part of a comprehensive trading plan.

MASU+ Institutional: The Ultimate Trading Ecosystem)Stop Trading Retail. Start Trading Institutional.
Welcome to MASU+ Institutional, a comprehensive algorithmic trading framework designed to emulate the logic of hedge funds and institutional market makers. This is not just a "buy/sell" indicator; it is a complete decision-making engine that combines Smart Money Concepts (SMC), Order Flow, and Multi-Timeframe Analysis into a single, automated strategy.
The script is built to filter out market noise and trade only when high-probability conditions align across structure, volume, and momentum.
Key Features
1. Smart Money Intelligence (SMC)
Order Blocks & FVG: Automatically identifies institutional footprints.
Liquidity Sweeps: Detects stop-hunts and manipulation points.
Break of Structure (BOS): Confirms trend continuations with precision.
Demand & Supply Zones: Dynamic plotting of buying and selling pressure zones with mitigation logic.
2. Advanced Order Flow
CVD (Cumulative Volume Delta): Analyses buying vs. selling pressure.
VWAP Bands: Trades based on institutional value areas.
Volume Profile POC: Pinpoints the Point of Control for the current session.
3. Adaptive Risk Management
Kelly Criterion Sizing: Dynamically adjusts position size based on win-rate probability.
Volatility-Based Stops: SL and TP are calculated using ATR to adapt to market conditions.
Auto-Trailing: Locks in profits as the trade moves in your favor.
4. Professional Dashboard A compact, real-time table displaying:
MTF Trends: Status of 15m, 1H, and 4H trends.
Confluence Score: A rating (1-5) of the signal strength.
Market Regime: Identifies if the market is Trending, Ranging, or Volatile.
Risk/Reward: Live R:R calculation for the current setup.
How It Works
The strategy uses a "Waterfall Logic" to enter trades:
Macro Filter: Checks the correlation with major indices (SPX, NDX) to ensure we are trading with the global market.
Trend Alignment: Confirms direction using Multi-Timeframe EMAs.
Volume Confirmation: Requires a spike in volume and positive Order Flow (CVD).
SMC Trigger: Enters on Liquidity Sweeps, FVG fills, or Order Block retests.
Time Filter: Operates only during high-volume sessions (London/NY) to avoid consolidation chop.
Best Practices
Timeframe: Optimized for 15m and 1H.
Assets: Works best on Indices (US30, NAS100, DAX), Crypto (BTC, ETH), and Major Forex Pairs.
Settings: The default settings are tuned for a balance of frequency and accuracy. Use the "Time Filter" to avoid low-volatility sessions.
Disclaimer: This strategy is a tool for analysis and automated execution logic. Past performance does not guarantee future results. Always backtest on your specific asset and broker before deploying real capital.
👇 Drop a BOOST if you want more Institutional Tools! 🚀

@subitrades AIO IndicatorAll In One Indicator by @subitrades
-Initial Balance
-Trading Sessions
-Monday High
-Monday Low
-VAH
-VAL
-POC
-Fibonacci
-VWAP

Group 1: Monthly Permission + Value LocationThis indicator is your monthly gatekeeper: it decides whether trading is allowed and shows where price sits in long-term value, before you ever think about entries.
This script answers one question, clearly and consistently:
“Should I even be trading right now, and where is price sitting inside the big monthly map?”
It is not an entry tool.
It does not tell you when to buy or sell.
It sets permission and context so you don’t make trades in bad environments.
Think of it as the front gate to your system.
What you see on the chart
1. Monthly value levels (manually entered)
You manually enter:
Monthly VAL (Value Area Low)
Monthly VAH (Value Area High)
Optional: Monthly POC, HVN1, HVN2 (display only)
These levels define the monthly value area.
The script never recalculates them or moves them.
Why manual?
Your system defines value from FRVP anchoring.
Automation would break your rules.
This keeps the indicator honest and predictable.
2. Monthly permission: Risk ON vs Risk OFF
The script evaluates the last three completed monthly candles and checks for environments where price is unreliable.
It will mark Risk OFF if any of the following are true:
A. Monthly alternation (chop)
The last three non-doji monthly candles alternate direction
Example: up → down → up
This means direction is not sticking
B. Repeated high volatility
Monthly RangeRatio ≥ your threshold
Happens in 2 of the last 3 months
Indicates unstable movement, not controlled expansion
C. Volume spike during chop
Monthly VolumeRatio spikes above your threshold
Occurs while alternation or chop is present
Indicates emotional participation without structure
If any of those are true → Risk OFF
Otherwise → Risk ON
This matches your rule:
“Avoid environments where closes don’t stick.”
3. Monthly location badge (where price is sitting)
The script classifies the current monthly close into one of five clear states:
Outside Above VAH
Outside Below VAL
Inside (Near VAH)
Inside (Near VAL)
Inside Value
“Near” is defined as a percentage of value width (default 10%), not a guess.
This gives you a fast answer to:
Am I inside value or outside?
If inside, am I near an edge or in the middle?
No interpretation required.
4. Readout dashboard (optional table)
If enabled, the dashboard shows:
Monthly Permission: Risk ON / Risk OFF
Location status (from the badge logic)
Monthly RangeRatio
Monthly VolumeRatio
Monthly ADX(14)
Anchor age (days since you anchored monthly value)
This is a status panel, not a signal board.
How you’re meant to use it
Step 1: Check permission first
If Risk OFF → you do nothing
You do not look for setups
You do not drop to weekly or daily
This enforces discipline.
Step 2: Note monthly location
Inside value → only value rotation logic is allowed later
Outside value → expansion logic may be allowed later
Near an edge → expect interaction, not immediate continuation
This sets the boundaries for all lower-timeframe decisions.
Step 3: Move on to Group 2 only if allowed
This script does not:
Choose Roadmap A or B
Trigger entries
Select targets
That happens later, on weekly and daily charts.
Group 1 only answers:
“Is the environment tradable, and where are we in the big picture?”
What this script deliberately does NOT do
No entries
No exits
No alerts
No pattern guessing
No automated value calculation
No repainting
It is intentionally boring.
That’s the point.
Why this matters (especially for newer traders)
Most traders lose money before the trade:
Trading during chop
Trading inside value as if it’s trending
Trading high volatility without structure
This script prevents that by:
Forcing you to check environment first
Giving you objective monthly context
Removing emotional decision-making
If this script says Risk OFF, you’re already doing the right thing by standing aside.

Global OrderFlow CVD Div (USDT+USD + Multi-OI) [TheActualSnail]Global OrderFlow CVD Div (USDT+USD + Multi-OI)
Global OrderFlow CVD Div is a multi-venue order flow proxy that aggregates CVD (Cumulative Volume Delta) from several exchanges (USDT perpetuals + USD spot) and prints pivot-based divergence labels on the price chart. Optionally, it can filter those divergence labels using Open Interest (OI) trend for extra confluence.
This is designed as a “global read” of participation: perps for positioning, spot for real flow, and OI for leverage context.
What this indicator shows
1) Delta (Orderflow proxy)
Because true bid/ask orderflow isn’t available natively in Pine for most markets, this script uses an intrabar OHLCV proxy:
If intrabar close > open → volume counted as “buy”
If intrabar close < open → volume counted as “sell”
If doji → it falls back to close vs previous close
This happens on a Lower TF (intrabar timeframe), then sums intrabar volume inside each chart candle.
2) CVD (Cumulative Volume Delta)
CVD is the cumulative sum of Delta:
Positive CVD suggests net aggressive buying (proxy)
Negative CVD suggests net aggressive selling (proxy)
You can plot:
AVG CVD (aggregated signal)
Optionally each exchange’s CVD separately (debug / comparison)
3) Divergence labels (pivot-based)
The script marks divergences at confirmed pivots:
Regular Bullish Divergence (Bull Div)
Price makes a Lower Low
CVD makes a Higher Low
Regular Bearish Divergence (Bear Div)
Price makes a Higher High
CVD makes a Lower High
Optional:
Hidden Bullish Divergence (trend continuation type)
Price makes a Higher Low
CVD makes a Lower Low
Hidden Bearish Divergence (trend continuation type)
Price makes a Lower High
CVD makes a Higher High
All labels are drawn at the pivot candle (the pivot is confirmed after Pivot length bars).
Inputs & settings explained
Calculation
Lower TF for intrabars
Sets the timeframe used to build the intrabar delta proxy (ex: 30s / 1m / 3m).
Smaller = more precise, but heavier CPU.
Delta mode
Delta = raw (buy vol − sell vol)
Delta % = delta normalized by total intrabar volume (helps when mixing sources with different volume scales)
CVD reset
Controls when CVD is reset back to 0:
None = continuous cumulative
Daily / Weekly / Monthly = resets at timeframe boundary
Fixed time = resets at a specific hour/min in your chart’s timezone
Session (regular) = uses TradingView’s regular session start
Fixed time hour / min (only used when reset = Fixed time)
CVD Sources (USDT perps + USD spot)
Each source has two controls:
✅ Checkbox = enable/disable that venue in the aggregation
Symbol picker = the actual TradingView symbol used
Defaults include:
USDT perps (Binance/Bybit/OKX/Bitget)
USD spot (Binance USD, Coinbase USD, optionally Kraken/Bitstamp)
Blend method
Average = normalizes by number of enabled sources (recommended for “global” confluence)
Sum = adds them directly (can overweight high-volume venues)
Tip: If a symbol is invalid on your TradingView plan/region, just disable it or change it to a valid ticker.
Open Interest (Perps only)
OI is optional and used as a divergence “filter” (not required).
Enable OI filter = turn OI logic on/off
Per-exchange OI toggles + symbol pickers (Binance/Bybit/OKX/Bitget)
OI blend
Average = average OI from enabled sources (recommended)
Sum = summed OI
OI trend length
Lookback for rising/falling detection
Filter labels by OI
None = no filter
Require OI Rising = only show divergence labels when blended OI is rising
Require OI Falling = only show divergence labels when blended OI is falling
Note: Coinbase has no OI feed here, so OI is perps-only by design.
Divergences
Enable divergence labels = on/off
Pivot length = pivot strength (higher = fewer, stronger signals; lower = more signals)
Use wicks for pivots
ON = pivots use High/Low (more sensitive)
OFF = pivots use Close (more conservative)
Min CVD difference (filter)
Requires the CVD pivot value to differ from the previous CVD pivot by at least this amount.
Also show hidden divergences
Enables hidden divergence labels.
Visuals
Show AVG Delta histogram (pane) = plots aggregated delta columns
Show AVG CVD (pane) = plots the aggregated CVD line
Show each CVD (pane) = plots each venue’s CVD line (useful for checking alignment)
Show AVG OI (pane) = plots blended OI (if enabled)
Show zero line (pane) = plots the 0 baseline
Up/Bear colors = colors used for plots and labels
“Icons” you see in the Inputs panel
TradingView uses common UI controls:
✅ Checkbox → enable/disable a feature or a specific exchange/OI feed
🔽 Dropdown → choose modes like Reset type / Delta mode / Blend method / OI filter
🕒 Timeframe selector → choose Lower TF for intrabars
🎨 Color swatch → change label/plot colors
✏️ Symbol picker → choose the exact exchange ticker used by the script
How to use it (practical workflow)
Pick your sources
Keep 2–4 major venues enabled for clean signal (ex: Binance/Bybit/OKX + Coinbase).
If you see “Invalid symbol”, replace the symbol or turn that source off.
Set intrabar precision
Start with 1m lower TF.
If you need more detail and your chart is smooth, try 30s.
Tune divergence sensitivity
Pivot length 5–10 is a good range.
Use wicks ON for earlier signals; OFF for stricter confirmation.
Add confluence
Use the OI filter to avoid divergences that occur with the “wrong” leverage context.
Combine with HTF levels, market structure, liquidity zones, VWAP/POC/NPOC, etc.
Important notes / limitations
This is a proxy, not true bid/ask delta.
Different exchanges report volume differently; aggregation helps but won’t be perfect.
Pivots are confirmed, so labels appear after the pivot is formed (pivotLen bars later).
More enabled sources + smaller intrabar TF = heavier calculations.
Not financial advice
This indicator is for educational/informational purposes only and does not constitute financial advice. Markets are risky. Always validate signals with other confluences, use proper risk management, and make your own decisions.

DXY vs Small-Cap Divergence [v6]It creates a dedicated panel to monitor the "tug-of-war" between the US Dollar (DXY) and the Russell 2000 (IWM).
As a swing trader, you are looking for Negative Correlation—specifically, the moment the DXY starts to fall while Small Caps maintain their strength.
How to Interpret This on Your Desktop:
Green Background: This highlights the exact bars where the DXY is dropping while the Russell 2000 is gaining ground. This can be your "Go" signal for the small caps that you are monitoring near pivots, prior levels, POC's, or value area highs or lows.
The Green Line (Bottom of the oscillator): When the line hits -0.8, it means the two assets are moving in nearly perfect opposite directions. For a gold bounce and small-cap rally, you want to see this line deep in the green.
The Red Line (Top of the oscillator): If this line stays near +0.8, it means the Dollar and Stocks are moving together. This usually indicates a "Liquidity Flush" where everything is being sold—stay cautious during these periods.

Market Structure Break & OB Probability Toolkit [LuxAlgo]The Market Structure Break & OB Probability Toolkit indicator provides an institutional framework for identifying high-probability liquidity zones and significant market structure transitions using momentum-based filters and volume analysis.
🔶 USAGE
The indicator aims to provide a systematic approach to structural analysis, allowing traders to identify clear institutional footprints. By integrating statistical filters, the tool helps isolate high-conviction signals from market noise.
🔹 Market Structure Breaks (MSB)
Unlike standard fractal-based breaks, the MSB logic in this toolkit utilizes a Momentum Z-Score filter . This ensures that structural shifts are only highlighted when price breaks a pivot with significant conviction.
Pivot Lookback: Custom sensitivity for identifying swing highs and lows.
Volatility Filtering: Only breaks exceeding the statistical threshold are labeled, helping traders avoid low-momentum fakeouts.
🔹 Institutional Order Blocks (OB)
The script automatically detects and manages Order Blocks based on the candle preceding an MSB. Every zone includes a Point of Control (POC) line for precise entry or target consideration.
Standard OBs: Formed during structural transitions, representing potential institutional interest.
High-Probability OBs (HP-OB): Zones identified with exceptionally high impulse and volume signatures (score > 80%). These are visually distinct to highlight their increased significance.
🔹 Session Range Integration
Traders can track the ranges of the London, New York, Tokyo, and Sydney sessions. This allows for the identification of structural breaks occurring at session extremes or during high-liquidity windows.
🔹 Strategy Application
Trend Direction: Identify the prevailing bias through MSB signals. A bullish MSB followed by a retracement into a Bullish OB provides a classic institutional entry scenario.
Zone Confluence: Look for High-Probability OBs that align with Session Highs/Lows for increased trade conviction.
Re-test Analysis: Enable "Extend Broken OBs" to see how price interacts with flipped liquidity zones.
🔶 DETAILS
The toolkit utilizes several advanced logic components to maintain chart clarity and analytical depth:
Intelligent Mitigation Logic: Active zones are managed in real-time. Traders can choose between "Historical" (shows all past zones) or "Present" (shows only active zones) display modes.
Mitigated Extension: A specialized feature to extend recently broken zones, allowing for re-test analysis of formerly active liquidity.
Overlap Filter: Option to hide overlapping Order Blocks to maintain a clean, actionable chart.
🔹 Analytics Dashboard
The built-in dashboard provides a real-time performance suite:
OB Reliability: A percentage-based efficiency metric tracking how many detected zones have been successfully mitigated by price.
High-Prob Zone Count: A live counter of active HP-OBs currently remaining on the chart.
🔶 SETTINGS
🔹 Market Structure
Pivot Lookback: Defines the sensitivity of the market structure detection by adjusting the lookback period for pivots.
MSB Momentum Z-Score: Sets the statistical threshold for a price move to be considered a valid structural break.
🔹 Visuals
Display Mode: Toggles between showing historical mitigated zones or only currently active ones.
🔹 Order Blocks
Max Active OBs: Controls the maximum number of blocks stored and displayed on the chart.
Extend Broken OBs: If enabled, recently mitigated blocks will remain visible to observe potential re-tests.
Hide Overlapping OBs: Removes redundant zones that occupy the same price area as existing ones.
🔹 Sessions
Show Session Ranges: Global toggle for session visualizations.
Session Toggles: Individual controls to enable London, New York, Tokyo, or Sydney ranges with custom time and color inputs.
Institutional trading concepts and Smart Money Concept (SMC) indicators involve significant risk. This tool is designed for educational and analytical purposes. Past performance is not indicative of future results.

Replay FootprintReplay Footprint (RF) is a footprint (cluster) volume analysis indicator with a key feature: full support for Replay mode.
You can rewind to any point in history, and the indicator will re-request real tick data (or the lower timeframe specified in the inputs) and rebuild the footprint as if the market were forming in real time. This allows accurate historical analysis without distorted or pre-aggregated data.
The indicator displays:
buy and sell volume at each price level,
imbalance levels,
delta and volume imbalances,
Point of Control (POC),
Value Area High / Low (VAH / VAL).
Replay note
If you want to play Replay in real time, make sure to run Replay using a lower resolution (ticks or lower timeframe) rather than the chart resolution.
In this mode, the indicator works correctly and updates footprint data in real time.
Requesting detailed data is a resource-intensive operation.
If you encounter memory limit errors, reduce the number of price rows or the amount of detailed bars requested.
If you need more detail, you can increase these values, keeping TradingView limits in mind.

ZigZag Volume Profile [Honestcowboy]The ZigZag Volume Profile Indicator is a combination of 2 very popular trading indicators, the volume profile and zigzag indicator. Instead of using predetermined sessions like traditional volume profile analysis. This indicator expands on zigzag indicators "legs" and draws a volume profile inside each zigzag leg.
What is a Volume Profile?
"Technical analysis tool showing trading volume at specific price levels, creating a horizontal histogram on the side of a chart to reveal areas of high buying/selling interest, unlike traditional volume bars showing volume over time. Key elements include the Point of Control (POC) for most traded price, the Value Area (VAH/VAL), identifying crucial support/resistance, and analyzing profile shapes (like D, B, P) to understand market balance and potential price targets, used by professionals to spot liquidity and market structure."
Key Differences
Does not have a value area but distinguishes each column in relation to the biggest column in percentage terms.
Does not take sessions into account instead using zigzag legs
🟦 CALCULATION
The zigzag volume profile first builds a standard zigzag indicator to find structure in the market. Using pivot points and a minimum % price move threshhold.
Then once it knows the zigzags it will use each leg as a time window to calculate a volume profile inside.
🔹Coloring each column:
The script will find the biggest column in the Profile and use that as a reference for all other columns. It will then decide for each column individually how big it is in % compared to the biggest column. It will use that percentage to decide which color to give it, top 20% will be red, top 40% purple, top 60% blue, top 80% green and all the rest yellow. The user is able to adjust these numbers for further customisation.
🟦 USAGE
The idea behind this indicator is, if you look at markets as different legs (moves) going in a zigzag pattern you might want to look deeper inside your previous moves and see where the actual liquidity/volume was during that move. The hypothesis here is you build trade ideas based on zigzags but then use the volume profiles.
Since volume and market structure are very well known concepts to discretionary traders I'm hoping this indicator might give some different perspective on this relation and help people create a trading approach based on it. Here's some quick cherry picked examples, just as a proof of concept:
🟦 SETTINGS
🔹ZIGZAG SETTINGS
Price Deviotion % : This is the minimum price move in % term from last pivot price needs to move to form a new pivot for the zigzag.
Pivot Legs (Left/Right): The amount of bars a high or a low needs to be higher/lower than to the left and right of the bar. 10 By default to create medium term zigzag
🔹Volume Profile
Profile Rows: The amount of rows in Y axis the zigzag is going to be sliced into to create the volume profile. Higher number is more detailed volume profile but also uses more box objects which is maxed at 500. 25 by default
Profiles to Display: The amount of volume profiles the indicator will draw back in time. Higher number means more history but also longer loading time. 20 by default
🔹Visual Settings
This part is pretty self explanatory and you have can manually select the colors used to create the volume profile. Refer back the the explanation about the "🔹coloring each column" section.

Custom Daily POC with Date LabelsThis indicator provides a clear view of today's control levels in relation to the point of control from previous days, revealing where the big whales are navigating and manipulating the market.
It's a simple yet genius tool...

Unified Field: Clean FVG + Session POCCombines FVG with POC. one can combine SMC with Order Flow Strategies for better confluence.

Volume MarkersMarks POC, VAL, and VAH over a selected period of time and extends a horizontal line from each marker into the future for a selected period of time


Daytrading Suite v6.4: Neon TPO + FVG + IB Lines (Stable)Here is the complete **Trading Manual & Strategy Guide** for the **Master Daytrading Suite (Neon + IB Edition)**.
This guide explains exactly **when** to trade and **how** to execute trades using the tools in the script.
---
# 📘 MASTER TRADING MANUAL (Neon + IB)
### 1. THE BASICS
* **Best Assets:** BTCUSDT & ETHUSDT (Futures).
* **Best Timeframe:** 5 Minutes (Entry) / 15 Minutes (Trend).
* **Key Session:** New York Session (High Volatility).
* **Golden Rule:** Never go **LONG** inside a Red Supply Zone. Never go **SHORT** inside a Green Demand Zone.
---
### 2. THE INDICATORS (Legend)
| Indicator | Color | Function | How to use |
| --- | --- | --- | --- |
| **Supply Zone** | 🟥 **Red Box** | Resistance | Look for Short setups here. |
| **Demand Zone** | 🟩 **Green Box** | Support | Look for Long setups here. |
| **Golden Pocket** | 🟧 **Orange** | Retracement | The "Sweet Spot" for trend entries (Fib 0.618). |
| **VWAP** | 🔵 **Blue Line** | Trend Anchor | Price > VWAP = Bullish. Price < VWAP = Bearish. |
| **Initial Balance (IB)** | 🟨 **Yellow Box** | Opening Range | Breakout above = Bullish. Breakdown below = Bearish. |
| **FVG (Gap)** | 🟩/🟥 **Tiny Box** | Trigger | **Green FVG** = Entry Signal for Longs. **Red FVG** = Entry Signal for Shorts. |
---
### 3. STRATEGY A: The Trend Pullback (High Win Rate)
*Use this when the market is trending smoothly.*
#### ✅ HOW TO ENTER A LONG (BUY) POSITION
1. **Trend Check:** Price is trading **ABOVE** the VWAP (Blue Line) and EMA 9 (Yellow Line).
2. **The Wait:** Wait for the price to drop back down (pullback).
3. **The Zone:** Price touches the **Green Demand Zone** OR the **Orange Golden Pocket**.
4. **The Trigger:** A **Green FVG Box** appears on the 5-minute chart.
5. **Execution:** Enter Long. Stop Loss below the recent low. Take Profit at the next Red Zone.
#### 🔻 HOW TO ENTER A SHORT (SELL) POSITION
1. **Trend Check:** Price is trading **BELOW** the VWAP (Blue Line) and EMA 9 (Yellow Line).
2. **The Wait:** Wait for the price to rally up (pullback).
3. **The Zone:** Price touches the **Red Supply Zone** OR the **Orange Golden Pocket**.
4. **The Trigger:** A **Red FVG Box** appears on the 5-minute chart.
5. **Execution:** Enter Short. Stop Loss above the recent high. Take Profit at the next Green Zone.
---
### 4. STRATEGY B: The IB Breakout (Volatility)
*Use this specifically after the first hour of the New York Session (approx. 10:30 NY time).*
* **The Setup:** Look at the **Yellow Box (Initial Balance)** which marks the high/low of the first hour.
* **Bullish Breakout:** If a candle closes **above** the Yellow Box + Price is above VWAP → **Go Long**.
* **Bearish Breakdown:** If a candle closes **below** the Yellow Box + Price is below VWAP → **Go Short**.
* **The Trap (Fakeout):** If price breaks out but immediately falls back inside the Yellow Box, close the trade immediately.
---
### 5. DAILY ROUTINE (Checklist)
1. **Open TradingView:** Switch to the **15m Chart**.
2. **Check Context:** Where are we? Are we near a big Red Box (Supply) or Green Box (Demand)?
3. **Check Trend:** Is price above or below the Blue VWAP line?
4. **Wait for the Open:** Let the first hour of New York pass (to form the Yellow IB Box).
5. **Set Alerts:** Right-click the chart and set alerts for "IB Breakout" or "Golden Pocket".
6. **Execute:** Switch to the **5m Chart** to find your entry trigger (FVG).
---
### 6. RISK MANAGEMENT RULES
* **Stop Loss:** NEVER trade without one. Place it just outside the FVG box or the Zone.
* **Risk per Trade:** 1% to 2% of your account maximum.
* **No Trade Zone:** If the price is "chopping" (moving sideways) inside the Yellow IB Box, **do not trade**. Wait for a breakout.

Weekly Levels: High/Low/Mid/POCThis is a simple indicator that plots each week (up to 4 weeks) with the high,low, mid point and a customizable POC. Weeks can be toggled on and off and it has a developing level for the current week.
I find these levels valuable in day trading and thought automating them would be ideal.

deKoder | Whale Prints [WP]deKoder | Whale Prints | Large Trade Orderflow Detection
This open-source indicator is a clean, precision tool for revealing hidden large-volume activity directly on your chart. By scanning ultra-low timeframes while you view higher ones, it projects statistically significant volume spikes as intuitive markers giving you a clear window into institutional orderflow without visually overwhelming the price action.
Key Features & Strengths
True Intra-Bar Detection | Monitors lower timeframes down to 1-second bars, catching aggressive block trades and absorption that occur within a single higher-TF candle.
Accurate Trade Levels | Markers are placed at the actual hl2 price of the aggressive lower-TF bar, providing a far more accurate estimate of where the large trade executed than typical mid-candle approximations.
Multiple Trades Per Bar | If several significant volume spikes occur inside one higher-TF candle, all qualifying levels are displayed individually – offering greater granularity and context.
Adaptive Thresholding | Uses higher-TF volume standard deviation (stable baseline) intelligently scaled to the lower timeframe, reducing noise in quiet markets while remaining sensitive to genuine outliers.
Clean Visual Hierarchy | Three tiers (Small 🞉 / Medium ⏣ / Large 🞊) with dynamic symbol size, line thickness, transparency, and user-definable bullish/bearish coloring based on LTF candle direction.
How to Use It as an Orderflow Tool
Large volume spikes often mark the footprints of institutional players. This indicator helps you read those footprints in real time.
Small (🞉) | Moderate excess volume: early interest, probing, or building positions.
Medium (⏣) | Strong spike: increasing conviction, potential momentum shift.
Large (🞊) | Extreme outlier: frequently climactic volume signalling exhaustion or major absorption.
Why Price Often Reverses at These Levels
Large players frequently place limit orders in areas rich with liquidity – commonly just beyond recent highs/lows where retail stop-losses cluster. When price sweeps those zones:
Stop hunts trigger a cascade of forced exits, creating liquidity for larger participants to fill their limit orders.
Breakout traders who entered on the move are trapped offside and become forced buyers/sellers when price reverses.
Institutions use this liquidity to execute large orders at favorable prices with minimal immediate market impact.
The result is aggressive volume at the extreme, followed by reversal as smart money finishes filling and price returns toward fair value. Clusters of medium/large markers at swing points are classic signs of this dynamic.
Practical Analysis Tips
Reversals/Absorption | Clusters of large markers at swing highs/lows (especially opposing-color spikes) signal potential turns – buyers or sellers stepping in aggressively.
Level Defense | Trades piling up at key support/resistance suggest institutions protecting or building positions.
Trapped Traders | Large spikes beyond range pivots followed by reversal back into the range often highlight trapped breakout traders who add fuel to a move when they are forced to liquidate their positions.
Use Offset (-3 to +3) to shift markers away from current price for clearer viewing.
Pro tip: Zoom into the lower TF occasionally to see how these projected levels align exactly with aggressive candles.
Recommended Pairings
This is designed as a pure orderflow overlay to be layered with your existing setup:
Support & Resistance (horizontals, pivots, Volume Profile POC/VAH/VAL)
Market Structure tools (swing points, order blocks, fair value gaps)
Trend filters (EMAs, SuperTrend, higher-TF bias)
Momentum oscillators for timing confluence
Best Suited For
Scalping & day trading (1–15 min charts with 5–30S lower TF)
Swing trading entries (1H–4H charts with 1–5 min lower TF)
High-liquidity markets: crypto perpetuals, forex majors, volatile stocks
Add this indicator to start seeing the hidden aggression driving price and expose the hidden edges beyond the noise.
☠ FR33FA11 | deKoder ☠
Released January 2025 | Open Source

AnchoredVolume ProDescription
AnchoredVolume builds a real-time volume profile that distributes volume across price levels, identifying the Point of Control (POC), Value Area High (VAH), and Value Area Low (VAL). These levels represent where 70% of volume occurred and act as powerful support/resistance zones.

TradeHook.tech - MTMGBS AnchoredVolume ProDescription
AnchoredVolume builds a real-time volume profile that distributes volume across price levels, identifying the Point of Control (POC), Value Area High (VAH), and Value Area Low (VAL). These levels represent where 70% of volume occurred and act as powerful support/resistance zones.

Max. Liquidity & Delta Bias Profile @MaxMaserati 3.0MAX. LIQUIDITY & DELTA BIAS PROFILE @MAXMASERATI 3.0
═══════════════════════════════════════════════════════════════
OVERVIEW
────────
An advanced volume profile tool that analyzes market liquidity and order flow dynamics across different timeframes. This indicator helps traders identify key price levels where significant trading activity and directional bias converge.
DUAL PROFILE SYSTEM
───────────────────
🔷 LIQUIDITY PROFILE (Right Side)
Displays total volume traded at each price level, colored by market bias:
• Green nodes = Bullish dominance (buyers in control)
• Red nodes = Bearish dominance (sellers in control)
• Width represents volume concentration at that level
🔷 DELTA BIAS PROFILE (Left Side)
Shows net buying vs selling pressure at each price level:
• Blue nodes = Positive delta (buying pressure dominates)
• Purple nodes = Negative delta (selling pressure dominates)
• Width represents strength of the imbalance
KEY REFERENCE LEVELS
─────────────
📍 POC (Point of Control)
Yellow horizontal line marking the price with highest traded volume - represents the most accepted fair value during the period.
📍 MAX BULL Level
Green line highlighting the price with strongest bullish conviction - where buyers showed maximum aggression and commitment.
📍 MAX BEAR Level
Red line highlighting the price with strongest bearish conviction - where sellers demonstrated maximum pressure and control.
TOGGLE OFF EVERYTHING EXCEPT THE MAX LINES TO HAVE THIS SETUP
PROFILE STATUS INDICATORS
──────────────────────────
• ▶ ONGOING (Green) = Current developing profile
• ⬛ STOPPED (Red) = Completed profile, new period started
CUSTOMIZATION FEATURES
──────────────────────
✓ Multiple anchor periods (Auto/Session/Day/Week/Month/Quarter/Year)
✓ Independent toggles for each visual element
✓ Individual color and size controls for every label
✓ Adjustable profile width and transparency
✓ Customizable line widths and styles
TRADING APPLICATIONS
────────────────────
• Identify high-probability support/resistance zones
• Spot institutional accumulation/distribution levels
• Detect order flow imbalances before major moves
• Track intraday value areas and fair price zones
• Confirm trend strength through delta analysis
• Find optimal entry/exit levels based on volume
WHO THIS IS FOR
───────────────
Designed for active traders who:
• Trade futures, stocks, forex with volume data
• Use volume profile and market profile concepts
• Analyze order flow and institutional footprints
• Seek data-driven price level identification
• Want visual clarity on market structure
NOTES
─────
• Requires volume data to function properly
• Best used on liquid instruments with consistent volume
• Profiles reset based on selected anchor period
• All visual elements can be toggled independently
• Performance optimized for real-time analysis
⚠️ DISCLAIMER
Educational Tool Only - This indicator is for educational and informational purposes only and does not constitute financial, investment, or trading advice.
Risk Warning - Trading involves substantial risk of loss and is not suitable for all investors. Past performance does not guarantee future results. No representation is made that this indicator will achieve profits or prevent losses.
User Responsibility - All trading decisions are solely your responsibility. The developer and Max Maserati Model assume no liability for losses incurred from using this indicator. Conduct your own research and consult a qualified financial advisor before making investment decisions.
Data Dependency - Indicator accuracy depends on your TradingView plan's data availability and selected timeframe support.
By using this indicator, you acknowledge and agree to these terms.
