[OKX Signal Bot] Indicator Script Set Up TemplateDiscover the power of the Turtle Trade Channels Indicator (TUTCI), an innovative tool that integrates the time-tested principles of the legendary Turtle Trade system. This groundbreaking system shattered the belief that successful traders are born, not made, by transforming ordinary individuals into profitable traders.
The Turtle Trade Experiment, which achieved a remarkable 80% annual return over four years and amassed a staggering $150 million, showcased the immense potential of this trend-following strategy. Unlike the conventional "buy low and sell high" approach, the Turtle Trade system embraces a different philosophy—one of capturing substantial profits by following prevailing trends.
At the heart of the Turtle Trade Channels Indicator lies the concept of Donchian Channels, a powerful technical indicator developed by Richard Donchian. Building upon this foundation, the main rule of TUTCI is to identify 20-day breakouts and capitalize on them, while simultaneously utilizing a profit-taking strategy based on breaching 10-day highs or lows.
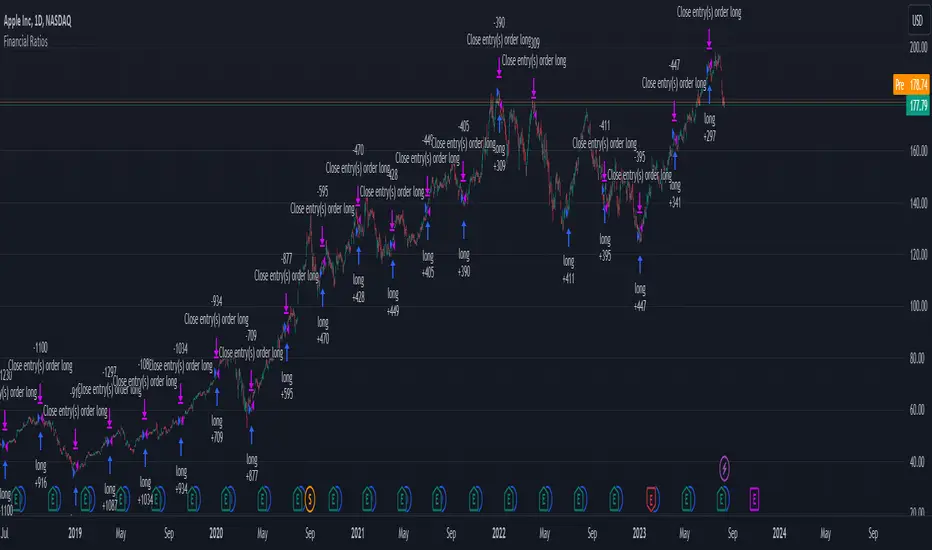
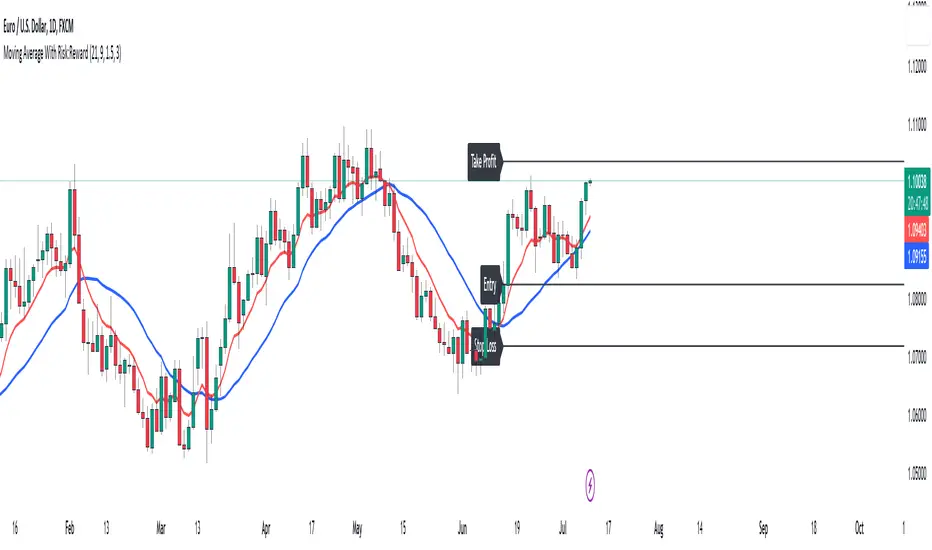
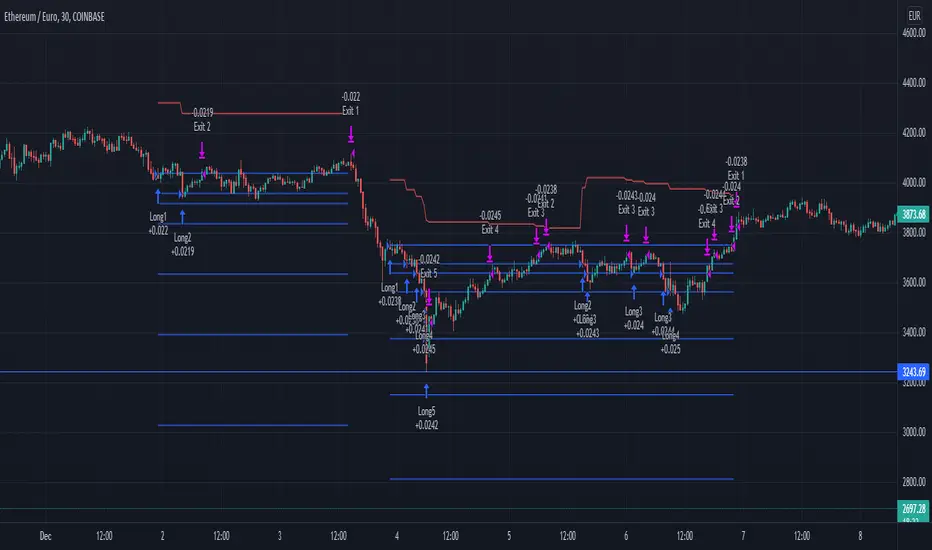
For long trades, the indicator signals a buying opportunity when the price breaks above the 20-day high. Conversely, for short trades, a selling opportunity arises when the price falls below the 20-day low. This systematic approach allows traders to align themselves with the prevailing momentum, capturing significant price movements.
To further enhance trading precision, TUTCI incorporates two key lines. The red line represents the trading line, indicating the direction of the trend. Price bars above the trend line suggest an uptrend, while those below indicate a downtrend. The dotted blue line serves as the exit line, guiding traders to close their positions when price action breaches the 10-day high or low. This rule safeguards profits and helps traders avoid potential trend reversals.
The Turtle Trade Channels Indicator (TUTCI) is a versatile tool applicable to various financial markets, including stocks, commodities, and forex. By harnessing the power of breakouts and integrating profit-taking rules, this indicator empowers traders to capitalize on favorable trading opportunities while managing risk effectively.
As with any trading strategy, it is crucial to conduct thorough backtesting and evaluation of the TUTCI system before implementing it in live trading. Traders can customize the indicator's parameters to align with their trading preferences and adapt to changing market conditions. Employing sound risk management techniques, such as position sizing and stop-loss orders, is paramount to protect capital and minimize potential losses.
Experience the transformational potential of the Turtle Trade Channels Indicator (TUTCI) and embark on a journey of trend following, capturing significant profits, and achieving trading success.
These scripts are only functioning as sample script templates to support okx alert standards. It is not intended to provide any investment, tax, or legal advice, nor should it be considered an offer to purchase, sell, hold or offer any services relating to digital assets. Digital assets, including stablecoins, involve a high degree of risk, can fluctuate greatly, and can even become worthless. You should carefully consider whether trading or holding digital assets is suitable for you in light of your financial condition and risk tolerance. OKX does not provide investment or asset recommendations. You are solely responsible for your investment decisions, and OKX is not responsible for any potential losses. Past performance is not indicative of future results. Please consult your legal/tax/investment professional for questions about your specific circumstances.
Pine Script® indicator