Noro's Trend MAs Strategy v1.7Trade strategy which uses only 2 MA.
The slow MA (blue) is used for definition of a trend
The fast MA (red) is used for an entrance to the transaction
For:
- For H1
- For crypto/fiat
Recomended:
Long = true (if it is profitable as a result of backtests)
Short = true (if it is profitable as a result of backtests)
Stops = false
Stop, % = any
Type of slow MA = 7 (only for Crypto/Fiat)
Source of slow MA = close or OHLC4
Use Fast MA = true
Fast MA Period = 5
Slow MA Period = 20
Bars Q = (2 for "BitCoin/Fiat" or 1 for "Fork/Fiat")
In the new version 1.7
+ stoporders
+ entry arrow (black)
Types of slow MA:
1 = SMA = Simple Moving Average
2 = EMA = Exponential Moving Average
3 = VWMA = Volume-Weighted Moving Average
4 = DEMA = Double Exponential Moving Average
5 = TEMA = Triple Exponential Moving Average
6 = KAMA = Kaufman's Adaptive Moving Average
7 = Price Channel
Search in scripts for "profitable"

Noro's Trend MAs Strategy v1.6Trade strategy which uses only 2 MA.
The slow MA (blue) is used for definition of a trend
The fast MA (red) is used for an entrance to the transaction
For:
- For H1
- For crypto/fiat
Recomended:
Long = true (if it is profitable as a result of backtests)
Short = true (if it is profitable as a result of backtests)
Type of slow MA = 7 (only for Crypto/Fiat)
Source of slow MA = close or OHLC4
Use Fast MA = true
Fast MA Period = 5
Slow MA Period = 20
Bars Q = (2 for "BitCoin/Fiat" or 1 for "Fork/Fiat")
In the new version 1.5
+ Profit became more
+ Losses became less
+ Alerts
+ Background (lime = uptrend, red = downtrend)
Types of slow MA:
1 = SMA = Simple Moving Average
2 = EMA = Exponential Moving Average
3 = VWMA = Volume-Weighted Moving Average
4 = DEMA = Double Exponential Moving Average
5 = TEMA = Triple Exponential Moving Average
6 = KAMA = Kaufman's Adaptive Moving Average
7 = Price Channel

Noro's Trend MAs Strategy 1.5Trade strategy which uses only 2 MA .
The slow MA (blue) is used for definition of a trend
The fast MA (red) is used for an entrance to the transaction
For:
- For H1
- For crypto/fiat
Recomended:
Long = true (if it is profitable as a result of backtests)
Short = true (if it is profitable as a result of backtests)
Type of slow MA = 7 (only for Crypto/Fiat)
Source of slow MA = clole or OHLC4
Use Fast MA = true
Fast MA Period = 5
Slow MA Period = 20
Bars Q = (2 for "BitCoin/Fiat" or 1 for "Fork/Fiat")
In the new version 1.5
+ Source
+ Types of slow MA
Types of slow MA:
1 = SMA = Simple Moving Average
2 = EMA = Exponential Moving Average
3 = VWMA = Volume-Weighted Moving Average
4 = DEMA = Double Exponential Moving Average
5 = TEMA = Triple Exponential Moving Average
6 = KAMA = Kaufman's Adaptive Moving Average
7 = Price Channel
PS: 100000000%, because of use of a piramiding have turned out

Noro's Trend SMA Strategy v1.4Trade strategy which uses only 2 SMA .
The slow SMA (blue) is used for definition of a trend
The fast SMA (red) is used for an entrance to the transaction
Recomended:
For H1
For crypto/fiat
Long = true (if it is profitable as a result of backtests)
Short = true (if it is profitable as a result of backtests)
Use Fast SMA = true
Fast SMA Period = 5
Slow SMA Period = 20
Bars = (2 for "BitCoin/Fiat" or 1 for "Fork/Fiat")
In the new version 1.4
- Parameters are added
Russian:
Перевожу на понятный. В новой версии 1.4 ничего не поменялось в логике, работает так же. Но добавлены новые параметры, можно поэкспериментировать с настройками, убедиться как что выгоднее.
Есть галка лонг и шорт. По умолчанию обе включены. Если убрать галку лонг, то исчезнут лонги вообще, если убрать шорт, то соответственно исчезнут шорты. По идее галку надо будет снимать если стратегия создает убыточные шорты, то их можно отключить. Смотреть в сводке показателей тестера стратегий профитны они или нет. По идее почти на всех парах крипто/фиат лучше ставить обе галки. Или убирайте галку шорт если не хотите шортить из религиозных соображений.
Добавлена галка отключающая быструю SMA. То есть если галку убрать то стратегия будет её игнорировать. Таким образом, параметр Fast SMA (который 5) перестанет влиять на результаты. Однако, скорее всего без этой галки станет только хуже. Но можете проверить. Позволяет убедиться что входить в сделку по быстрой SMA в среднем немного профитнее, чем входить где попало.
"Bars" - количество свечек одного цвета после после которых будет открываться сделка. По умолчанию 2. Можно от 0 до 3 ставить. Если 0 то цвет свечек игнорируется. Если 3, значит будет ждать 3 красных свечи подряд чтобы открыть лонг. Так же и с зелеными свечами для шорта. 2 - оптимально для пар типа биткойн/фиат. А для пар типа форк/фиат лучше ставить 1 свеча в параметре "Bars".

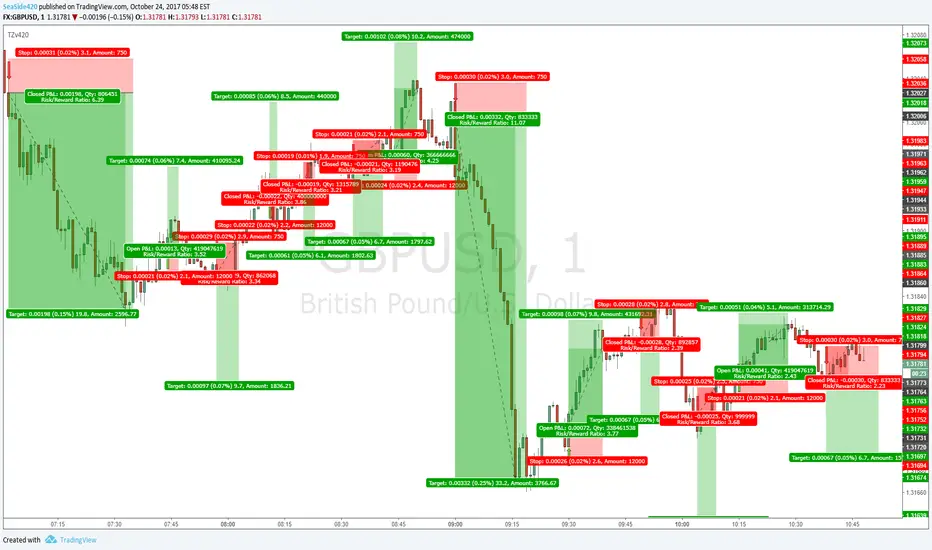
TZv420simplified version of TZ original. With Alert function
Transient Zones (v420)
I drew the trades on the arrow signals so you can see, its not all win, but with good money management and other ways of finding Target points (MA's or Pivots or Fib or Structure etc)
It is profitable. No repaint, No offset
CCI Level Zero Strategy (by Marcoweb) v1.0Hi guys,
My strategy is ready :)
Finally the zero level of the CCI gives the start and stop to my positions. As you could notice, setting up the CCI length to 340 area on 1 minute chart will let the profit factor go up to 20% from an already wonderful 16%. This is a great result cause will let profitable trades run while stopping the wrong ones with a very limited loss. What makes our profit are not several small little positions that are clearly unrepitable in real trade but few and very profitable positions in which jumping in will be easier due to their length (71 bars average).
Please share with me your impressions and suggestions.
Have a nice trade :)

I_Heikin Ashi CandleWhen apply a strategy to Heikin Ashi Candle chart (HA candle), the strategy will use the open/close/high/low values of the Heikin Ashi candle to calculate the Profit and Loss, hence also affecting the Percent Profitable, Profit Factor, etc., often resulting a unrealistic high Percent Profitable and Profit Factor, which is misleading. But if you want to use the HA candle's values to calculate your indicator / strategy, but pass the normal candle's open/close/high/low values to the strategy to calculate the Profit / Loss, you can do this:
1) set up the main chart to be a normal candle chart
2) use this indicator script to plot a secondary window with indicator looks exactly like a HA-chart
3) to use the HA-candle's open/close/high/low value to calculate whatever indicator you want (you may need to create a separate script if you want to plot this indicator in a separate indicator window)

MACDouble + RSI (rec. 15min-2hr intrv) Uses two sets of MACD plus an RSI to either long or short. All three indicators trigger buy/sell as one (ie it's not 'IF MACD1 OR MACD2 OR RSI > 1 = buy", its more like "IF 1 AND 2 AND RSI=buy", all 3 match required for trigger)
The MACD inputs should be tweaked depending on timeframe and what you are trading. If you are doing 1, 3, 5 min or real frequent trading then 21/44/20 and 32/66/29 or other high value MACDs should be considered. If you are doing longer intervals like 2, 3, 4hr then consider 9/19/9 and 21/44/20 for MACDs (experiment! I picked these example #s randomly).
Ideal usage for the MACD sets is to have MACD2 inputs at around 1.5x, 2x, or 3x MACD1's inputs.
Other settings to consider: try having fastlength1=macdlength1 and then (fastlength2 = macdlength2 - 2). Like 10/26/10 and 23/48/20. This seems to increase net profit since it is more likely to trigger before major price moves, but may decrease profitable trade %. Conversely, consider FL1=MCDL1 and FL2 = MCDL2 + (FL2 * 0.5). Example: 10/26/10 and 22/48/30 this can increase profitable trade %, though may cost some net profit.
Feel free to message me with suggestions or questions.

SPY Master v1.0This is a simple swing trading algorithm that uses a fast RSI-EMA to trigger buy/cover signals and a slow RSI-EMA to trigger sell/short signals for SPY, an xchange-traded fund for the S&P 500.
The idea behind this strategy follows the premise that most profitable momentum trades usually occur during periods when price is trending up or down. Periods of flat price actions are usually where most unprofitable trades occur. Because we cannot predict exactly when trending periods will occur, the algorithm basically bets money on all trade opportunities during all market conditions. Despite an accuracy rate of only 40%, the algorithm's asymmetric risk/reward profile allows the average winner to be 2x the average loser. The end result is a positive (profitable) net payout.
TRADING RULES:
Buy/Cover = EMA3(RSI2) cross> 50
Sell/Short = EMA5(RSI2) cross< 50
BACKTEST SETTINGS:
- Period = March 2011 - Present
- Initial capital = $10,000
- Dividends excluded
- Trading costs excluded
PERFORMANCE COMPARISON:
There are 657 trades, which means 1,314 orders. Assuming each order costs $2 (what I pay for at Interactive Brokers), total trading costs should be $2,628.
-SPY (buy & hold) = 132.73 ---> 193.22 = +45.57% (dividends excluded)
-SPY Master v1.0 = $12,649 - $2,628 = $10,021 = +100.21%
DISCLAIMER: None of my ideas and posts are investment advice. Past performance is not an indication of future results. This strategy was constructed with the benefit of hindsight and its future performance cannot be guaranteed.

Ichimoku EMA BandsSome find Ichimoku Clouds bit complicated. This simplified version is combined with EMA Bands may be profitable. Give a try!. I recommend hourly timeframe for good results. Aye! :D

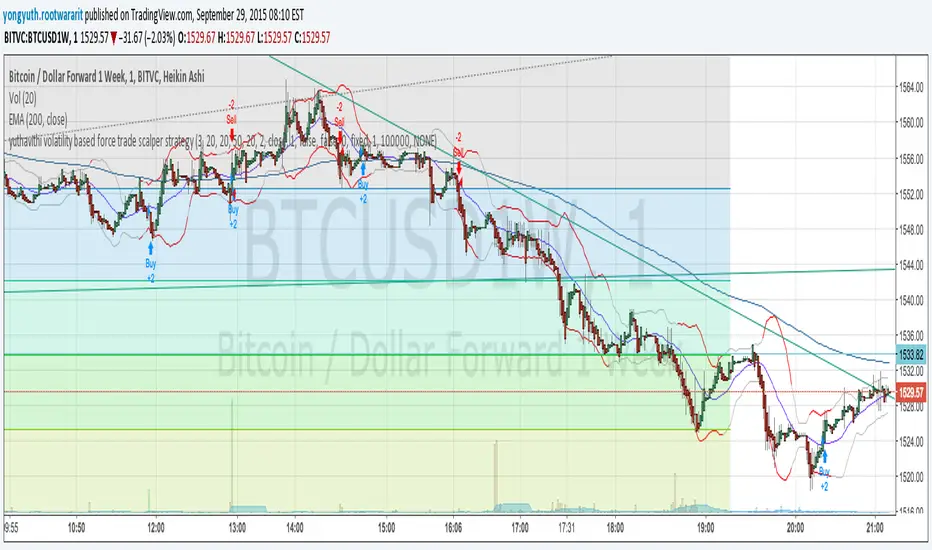
yuthavithi volatility based force trade scalper strategyI have converted my volatility based force scalper into strategy. Nice to see it is so profitable. Work best with Heikin Ashi bar.
BACKTEST SCRIPT 0.999 ALPHATRADINGVIEW BACKTEST SCRIPT by Lionshare (c) 2015
THS IS A REAL ALTERNATIVE FOR LONG AWAITED TV NATIVE BACKTEST ENGINE.
READY FOR USE JUST RIGHT NOW.
For user provided trading strategy, executes the trades on pricedata history and continues to make it over live datafeed.
Calculates and (plots on premise) the next performance statistics:
profit - i.e. gross profit/loss.
profit_max - maximum value of gross profit/loss.
profit_per_trade - each trade's profit/loss.
profit_per_stop_trade - profit/loss per "stop order" trade.
profit_stop - gross profit/loss caused by stop orders.
profit_stop_p - percentage of "stop orders" profit/loss in gross profit/loss.
security_if_bought_back - size of security portfolio if bought back.
trades_count_conseq_profit - consecutive gain from profitable series.
trades_count_conseq_profit_max - maxmimum gain from consecutive profitable series achieved.
trades_count_conseq_loss - same as for profit, but for loss.
trades_count_conseq_loss_max - same as for profit, but for loss.
trades_count_conseq_won - number of trades, that were won consecutively.
trades_count_conseq_won_max - maximum number of trades, won consecutively.
trades_count_conseq_lost - same as for won trades, but for lost.
trades_count_conseq_lost_max - same as for won trades, but for lost.
drawdown - difference between local equity highs and lows.
profit_factor - profit-t-loss ratio.
profit_factor_r - profit(without biggest winning trade)-to-loss ratio.
recovery_factor - equity-to-drawdown ratio.
expected_value - median gain value of all wins and loss.
zscore - shows how much your seriality of consecutive wins/loss diverges from the one of normal distributed process. valued in sigmas. zscore of +3 or -3 sigmas means nonrandom realitonship of wins series-to-loss series.
confidence_limit - the limit of confidence in zscore result. values under 0.95 are considered inconclusive.
sharpe - sharpe ratio - shows the level of strategy stability. basically it is how the profit/loss is deviated around the expected value.
sortino - the same as sharpe, but is calculated over the negative gains.
k - Kelly criterion value, means the percentage of your portfolio, you can trade the scripted strategy for optimal risk management.
k_margin - Kelly criterion recalculated to be meant as optimal margin value.
DISCLAIMER :
The SCRIPT is in ALPHA stage. So there could be some hidden bugs.
Though the basic functionality seems to work fine.
Initial documentation is not detailed. There could be english grammar mistakes also.
NOW Working hard on optimizing the script. Seems, some heavier strategies (especially those using the multiple SECURITY functions) call TV processing power limitation errors.
Docs are here:
docs.google.com

CM Stochastic POP Method 1 - Jake Bernstein_V1A good friend ucsgears recently published a Stochastic Pop Indicator designed by Jake Bernstein with a modified version he found.
I spoke to Jake this morning and asked if he had any updates to his Stochastic POP Trading Method. Attached is a PDF Jake published a while back (Please read for basic rules, which also Includes a New Method). I will release the Additional Method Tomorrow.
Jake asked me to share that he has Updated this Method Recently. Now across all symbols he has found the Stochastic Values of 60 and 30 to be the most profitable. NOTE - This can be Significantly Optimized for certain Symbols/Markets.
Jake Bernstein will be a contributor on TradingView when Backtesting/Strategies are released. Jake is one of the Top Trading System Developers in the world with 45+ years experience and he is going to teach how to create Trading Systems and how to Optimize the correct way.
Below are a few Strategy Results....Soon You Will Be Able To Find Results Like This Yourself on TradingView.com
BackTesting Results Example: EUR-USD Daily Chart Since 01/01/2005
Strategy 1:
Go Long When Stochastic Crosses Above 60. Go Short When Stochastic Crosses Below 30. Exit Long/Short When Stochastic has a Reverse Cross of Entry Value.
Results:
Total Trades = 164
Profit = 50, 126 Pips
Win% = 38.4%
Profit Factor = 1.35
Avg Trade = 306 Pips Profit
***Most Consecutive Wins = 3 ... Most Consecutive Losses = 6
Strategy 2:
Rules - Proprietary Optimization Jake Will Teach. Only Added 1 Additional Exit Rule.
Results:
Total Trades = 164
Profit = 62, 876 Pips!!!
Win% = 38.4%
Profit Factor = 1.44
Avg Trade = 383 Pips Profit
***Most Consecutive Wins = 3 ... Most Consecutive Losses = 6
Strategy 3:
Rules - Proprietary Optimization Jake Will Teach. Only added 1 Additional Exit Rule.
Results:
Winning Percent Increases to 72.6%!!! , Same Amount of Trades.
***Most Consecutive Wins = 21 ...Most Consecutive Losses = 4
Indicator Includes:
-Ability to Color Candles (CheckBox In Inputs Tab)
Green = Long Trade
Blue = No Trade
Red = Short Trade
-Color Coded Stochastic Line based on being Above/Below or In Between Entry Lines.
Link To Jakes PDF with Rules
dl.dropboxusercontent.com

Vervoort Heiken Ashi Candlestick OscillatorHeiken-Ashi Candlestick Oscillator (HACO), by Sylvian Vervoort, is a digital oscillator version of the colored candlesticks.
Explanation from Vervoort:
"HACO is not meant to be an automatic trading system, so when there is a buy or sell signal from HACO, make sure it is confirmed by other TA techniques. HACO will certainly aid in signaling buy/sell opportunities and help you hold on to a trade, making it more profitable. The behavior of HACO is closely related to the level and speed of price change. It can be used on charts of any time frame ranging from intraday to monthly."
HACO has 2 configurable length parameters - "UP TEMA length" and "Down TEMA length". Vervoort suggests having them the same value.
I have also added an option to color the bars (overlay mode).
More info:
Trading with the Heiken-Ashi Candlestick Oscillator - Sylvian Vervoort
List of my other indicators:
- GDoc: docs.google.com
- Chart:

DEnvelope [Better Bollinger Bands]*** ***
Bollinger Bands (BB) usually expand quickly after a volatility increase but contract more slowly as volatility declines. This extended time it takes for BB to contract after a volatility drop can make trading some instruments using BB alone difficult or less profitable.
In the October 1998 issue of "Futures" there is an article written by Dennis McNicholl called "Better Bollinger Bands", in which the author recommends improving BB by modifying:
- the center line formula &
- different equations for calculating the bands.
These bands, called "DEnvelope", follow price more closely and respond faster to changes in volatility with these modifications.
Fore more indicators, check out my "Master Index of indicators" (Also check my published charts page for new ones I haven't added to that list):
More scripts related to DEnvelope:
------------------------------------------------
- DEnvelope Bandwidth: pastebin.com
- DEnvelope %B : pastebin.com
Sample chart with above indicators: www.tradingview.com

Reversal Detection v3.1 - Real-Time Pro (Non-Repainting)Reversal Detection Pro v3.1 - Universal Non-Repainting
ACKNOWLEDGMENTS
Special thanks to @ksiva100 for extensive testing and detailed feedback on v3.0 that led to the major improvements in v3.1. Their real-world testing on GC, ES, NQ, NG, and CL futures across 3-5 minute timeframes identified critical issues with sensitivity scaling and helped shape the universal ATR-adaptive system that makes this version work seamlessly across all instruments and timeframes.
Community feedback like this is invaluable in creating better tools for all traders.
FULL DESCRIPTION:
OVERVIEW
Reversal Detection Pro v3.1 is a non-repainting reversal identification system designed for futures trading across all timeframes. The indicator uses ATR-adaptive thresholds combined with a zigzag-based pivot detection algorithm to identify confirmed price reversals. A triple EMA trend filter provides directional context, while optional supply/demand zones highlight key reversal areas.
The indicator automatically scales to any instrument's price level and volatility through its ATR-adaptive mechanism, eliminating the need for manual threshold adjustments when switching between instruments or timeframes.
KEY FEATURES
Non-Repainting Confirmation System
All confirmed reversal signals are final and do not disappear or move to different bars. The indicator includes an optional preview mode that shows potential reversals before confirmation, clearly labeled to distinguish them from confirmed signals. Users can add extra confirmation bars for additional validation before signals appear.
ATR-Adaptive Sensitivity
The indicator uses Average True Range (ATR) as its primary sensitivity mechanism. Five preset sensitivity levels (Very High, High, Medium, Low, Very Low) multiply the ATR by factors ranging from 0.8x to 3.5x. This approach automatically adapts to:
Different price levels (works equally on $25 micro futures and $25,000 instruments)
Varying volatility conditions (calm vs. volatile markets)
Multiple timeframes (1-minute through daily charts)
Different trading sessions (regular hours vs. after-hours)
Triple EMA Trend Detection
Three exponential moving averages (9, 14, and 21 periods) create a trend identification system. The info table displays current trend status as BULLISH, BEARISH, or NEUTRAL. Strong signals occur when a reversal aligns with the prevailing trend direction.
Supply and Demand Zones
Optional rectangular zones display at confirmed pivot points. These zones are color-coded (green for demand/support, red for supply/resistance) and can be configured for thickness, extension length, and maximum number displayed. Zones can be toggled on or off independently of reversal signals.
Information Display Table
A customizable table shows real-time indicator settings including:
Current signal mode (Confirmed Only, Preview, or Both)
Active sensitivity preset
ATR multiplier value
Percentage threshold
Current ATR reading
Calculated reversal threshold
Current trend status
Comprehensive Alert System
Eight different alert conditions cover all signal types:
Bullish reversal confirmed
Bearish reversal confirmed
Any reversal (combined)
EMA buy signal (trend change to bullish)
EMA sell signal (trend change to bearish)
Trend changed to bullish
Trend changed to bearish
Strong bullish (reversal + bullish trend aligned)
Strong bearish (reversal + bearish trend aligned)
HOW IT WORKS
Reversal Detection Algorithm
The indicator tracks price using a zigzag methodology that requires a minimum reversal amount before confirming a pivot. This reversal threshold is calculated using three components:
ATR Component (Primary): ATR × Sensitivity Multiplier
Percentage Component (Safety Floor): Close Price × Percentage Threshold
Absolute Component (Minimum Floor): Fixed dollar/point amount
The reversal threshold equals whichever of these three values is largest. This ensures appropriate sensitivity across all instruments and timeframes.
Pivot Confirmation Process
Price must move in one direction to establish a high or low pivot point. When price reverses by the minimum threshold amount, that pivot is confirmed. A reversal signal triggers when price subsequently breaks through the previous confirmed pivot in the opposite direction.
Signal Generation
Green labels and lines: Bullish reversal confirmed (buy signal)
Red labels and lines: Bearish reversal confirmed (sell signal)
Preview labels (if enabled): Potential reversals not yet confirmed (semi-transparent)
Trend Filter Operation
The 9/14/21 EMA system identifies trend direction:
BULLISH: 9 EMA > 14 EMA > 21 EMA, with price above 9 EMA
BEARISH: 9 EMA < 14 EMA < 21 EMA, with price below 9 EMA
NEUTRAL: EMAs not in sequential order
Strong signals occur when reversals align with trend direction.
HOW TO USE
Initial Setup
Add Indicator to Chart
Search "Reversal Detection Pro v3.1" in TradingView indicators
Click to add to any futures chart
Default settings work immediately on any instrument/timeframe
Choose Signal Mode (Signal Controls section)
Confirmed Only: Shows only final, non-repainting signals (recommended for trading)
Confirmed + Preview: Shows both confirmed and potential signals
Preview Only: Shows only potential signals (educational/learning mode)
Set "Extra Confirmation Bars" to 0 for immediate signals, or 1-5 for additional validation
Select Sensitivity (Main Controls section)
Very High: Maximum signals, catches small swings (0.8× ATR)
High: Active trading with more opportunities (1.2× ATR)
Medium: Balanced quality and quantity - recommended starting point (2.0× ATR)
Low: Conservative, higher quality signals (2.8× ATR)
Very Low: Major reversals only, highest quality (3.5× ATR)
Recommended Settings by Timeframe
1-2 Minute Charts (Ultra-Short Scalping)
Sensitivity: High or Very High
Confirmation Bars: 0
Expected: 10-20+ signals per session
Best for: Quick scalps, high-frequency trading
3-5 Minute Charts (Active Day Trading)
Sensitivity: Medium or High
Confirmation Bars: 0-1
Expected: 5-15 signals per session
Best for: Standard scalping, intraday swings
15-30 Minute Charts (Swing Trading)
Sensitivity: Medium or Low
Confirmation Bars: 0-1
Expected: 2-8 signals per session
Best for: Larger intraday swings, part-time trading
1-4 Hour Charts (Position Trading)
Sensitivity: Low or Very Low
Confirmation Bars: 1-2
Expected: 1-5 signals per week
Best for: Multi-day position trades
Daily Charts (Long-Term Swing Trading)
Sensitivity: Very Low
Confirmation Bars: 1-3
Expected: 1-4 signals per month
Best for: Weekly to monthly swing trades
Customizing Display
Supply/Demand Zones (Zones section)
Enable "Show Supply/Demand Zones" to display rectangular areas at pivots
Adjust "Number of Zones" to control how many recent zones appear (0-20)
Set "Zone Box Extension" for forward projection length (5-100 bars)
Modify "Zone Thickness" as percentage of price (0.01%-0.2%)
Visual Elements (Labels section)
"Stop Line Extension": Length of horizontal lines at reversal points (1-50 bars)
"Maximum Lines to Display": Limits historical lines visible (3-50)
"Label Size": Small, Normal, or Large text
Information Table (Info Table section)
Toggle "Show Info Table" on/off
Choose "Table Position": Six position options
Select "Table Size": Tiny through Huge
Setting Up Alerts
Click the "Alert" button (clock icon) on TradingView
Select "Reversal Detection Pro v3.1" from Condition dropdown
Choose specific alert type or "Any REVERSAL" for all signals
Set "Options" to "Once Per Bar Close" (recommended)
Configure notifications (popup, email, SMS, webhook)
Name your alert and click "Create"
For highest-probability trades, use "STRONG Bullish Signal" and "STRONG Bearish Signal" alerts which combine reversals with trend confirmation.
Advanced Settings (Custom Mode)
For experienced users, selecting "Custom" sensitivity unlocks manual control:
Calculation Method: "average" for smoother signals, "high_low" for more responsive
Percentage Reversal: Manual percentage threshold (0.01%-1.0%)
Absolute Reversal: Fixed dollar/point minimum ($0.01-$50)
ATR Multiplier: Manual ATR multiplication factor (0.1-10.0)
ATR Length: Period for ATR calculation (1-50, standard is 14)
Average Length: Smoothing period for high/low when using "average" method (1-50)
Trading Workflow Example
Identify Market Context
Check info table for trend status (BULLISH, BEARISH, NEUTRAL)
Note current ATR and reversal threshold values
Observe recent reversal signal quality
Wait for Signal
Green label = potential long entry (bullish reversal)
Red label = potential short entry (bearish reversal)
Horizontal line shows reversal pivot level
Evaluate Signal Quality
Strongest signals align with trend (STRONG alerts)
Check if reversal occurs at supply/demand zone
Verify adequate volume on reversal bar
Execute Trade
Enter on signal confirmation
Place stop loss below/above reversal pivot line
Target next supply/demand zone or opposing reversal signal
Manage Position
Trail stop loss with price movement
Take partial profits at zones
Exit on opposing reversal signal or stop hit
Multi-Timeframe Analysis
For optimal results, use multiple timeframes:
Higher timeframe (3-5× larger): Determine overall trend direction
Trading timeframe: Execute trades on reversal signals
Lower timeframe (3-5× smaller): Fine-tune entries and exits
Example: Trade ES futures
1 Hour chart: Identify BULLISH trend
5 Minute chart: Take only green (long) reversal signals
1 Minute chart: Time precise entry after signal appears
IMPORTANT USAGE NOTES
Understanding Signal Timing
This is a reversal identification indicator, not a prediction tool. Signals appear AFTER price begins reversing from a pivot, not at the exact top or bottom. This is intentional design - the confirmation process ensures reliability at the cost of capturing the absolute extremes.
Timeframe and Signal Frequency
Higher timeframes naturally produce fewer signals. This is correct behavior:
Daily charts: 1-4 signals per month is normal
1-hour charts: 1-5 signals per week is normal
5-minute charts: 5-15 signals per day is normal
1-minute charts: 10+ signals per hour is normal
If you want more signals, either use a lower timeframe or higher sensitivity setting.
Optimal Market Conditions
Best performance occurs during:
Regular trading hours (RTH) with normal volume
Trending or ranging markets
Liquid instruments with tight spreads
Normal volatility environments
Reduced performance may occur during:
Major economic announcements (FOMC, NFP, CPI)
Opening gaps or halted trading
Extremely thin markets (after-hours, holidays)
Flash crash or extreme volatility events
Risk Management Requirements
Always use stop losses (place beyond reversal pivot)
Position size appropriately (1-2% account risk per trade)
Account for commissions and slippage in planning
Never trade with funds you cannot afford to lose
Paper trade new settings before using real capital
Not a Complete Trading System
This indicator identifies potential reversal points but should be used as part of a complete trading plan including:
Overall market analysis and context
Risk/reward assessment
Position sizing methodology
Trade management rules
Psychological discipline
TECHNICAL SPECIFICATIONS
Calculation Method
Base Algorithm: Modified zigzag with adaptive thresholds
Primary Sensitivity: ATR-based multiplier system
Trend Filter: Triple EMA (9/14/21 exponential moving averages)
Price Calculation: Configurable (high/low or EMA-smoothed high/low)
Confirmation: Configurable delayed confirmation (0-5 bars)
Resource Usage
Maximum Boxes: 50 (for supply/demand zones)
Maximum Lines: 200 (user-configurable display limit)
Maximum Labels: 100 (for reversal markers)
Calculation Speed: Fast (minimal computational overhead)
Compatibility
TradingView Pine Script: Version 6
Chart Types: All (candlestick, bar, line, etc.)
Instruments: All futures contracts (optimized for liquid markets)
Timeframes: All (1 second through 1 month)
Features: Alerts, Strategy Tester compatible
SUITABLE INSTRUMENTS
Micro E-mini Futures
MES (Micro E-mini S&P 500), MNQ (Micro E-mini Nasdaq-100), MYM (Micro E-mini Dow), M2K (Micro E-mini Russell 2000), MGC (Micro Gold), MCL (Micro Crude Oil)
E-mini Futures
ES (E-mini S&P 500), NQ (E-mini Nasdaq-100), YM (E-mini Dow), RTY (E-mini Russell 2000)
Commodities
GC (Gold), SI (Silver), CL (Crude Oil), NG (Natural Gas), HG (Copper), ZW (Wheat), ZC (Corn), ZS (Soybeans)
Indices
SPX (S&P 500 Index), NDX (Nasdaq-100 Index), DJI (Dow Jones Industrial Average)
Currencies
6E (Euro FX), 6B (British Pound), 6J (Japanese Yen), 6A (Australian Dollar)
Interest Rates
ZB (30-Year T-Bond), ZN (10-Year T-Note), ZF (5-Year T-Note)
Crypto Futures
BTC (Bitcoin Futures), ETH (Ethereum Futures)
The ATR-adaptive system works on any liquid futures contract. Results may vary on extremely thin markets or instruments with unusual price structures.
LIMITATIONS AND CONSIDERATIONS
What This Indicator Does
Identifies confirmed price reversals after they begin
Adapts threshold requirements to market volatility
Provides trend context through EMA analysis
Marks potential support/resistance zones
Generates alerts for reversal conditions
What This Indicator Does NOT Do
Predict future price movements
Guarantee profitable trades
Work equally in all market conditions
Eliminate the need for trader judgment
Replace a complete trading strategy
Known Limitations
Signals lag actual reversal by design (confirmation required)
May generate false signals during choppy, directionless markets
Not optimized for gapping markets or illiquid instruments
Requires normal volatility (extreme VIX can affect performance)
EMAs are lagging indicators (trend status reflects recent past)
User Responsibility
Users are responsible for:
Backtesting settings on their chosen instruments
Understanding how the indicator works before trading
Implementing proper risk management
Complying with their broker's margin requirements
Following applicable regulations in their jurisdiction
DISCLAIMERS
Educational Purpose
This indicator is provided for educational and informational purposes only. It is a technical analysis tool designed to assist traders in identifying potential reversal points. It does not constitute financial advice, investment recommendations, or trading signals.
No Performance Guarantees
Past performance of this indicator does not guarantee future results. Markets are inherently uncertain and no technical indicator can predict future price movements with certainty. Losses are a normal part of trading and users should expect both winning and losing trades.
Risk Warning
Trading futures involves substantial risk of loss and is not suitable for all investors. Users should carefully consider whether trading is appropriate for them in light of their experience, objectives, financial resources, and other relevant circumstances. Users should only trade with capital they can afford to lose entirely.
No Liability
The indicator creator and publisher are not responsible for any losses incurred through use of this indicator. Users assume full responsibility for their trading decisions and outcomes. The indicator is provided "as-is" without warranties of any kind.
Testing Requirement
Users should thoroughly test this indicator using paper trading or small position sizes before committing significant capital. Different instruments, timeframes, and market conditions will produce different results. What works well in one context may not work in another.
Not Investment Advice
Nothing in this description or in the indicator itself constitutes investment advice or a recommendation to buy or sell any security. Users should consult with a licensed financial advisor before making investment decisions.
SUPPORT AND UPDATES
Version Information
Current Version: 3.1
Release Date: 21 January 2025
Pine Script Version: 6
Updates and Improvements
This indicator may receive updates to improve functionality, fix bugs, or add features. Users will automatically receive updates through TradingView's indicator system. Major version changes may include breaking changes to settings or behavior.
User Feedback
Community feedback helps improve the indicator. Users are encouraged to share their experiences, report issues, and suggest enhancements through comments. Please include specific details about instruments, timeframes, and settings when reporting issues.
Following for Updates
Click "Follow" on the @NPR21 profile to receive notifications about new indicators, updates, and educational content.

Gapper SHORT Signal# TradingView Publication Description
## Title
**Gapper Short Signal - Genetic Optimized (81.8% Win Rate)**
---
## Short Description
Data-driven short signal for fading overextended gap-up stocks. Optimized using genetic algorithms on 166 historical gappers.
---
## Full Description
### 📊 What Is This?
A **precision short signal** designed specifically for fading gap-up stocks that have become overextended. Unlike indicators built on gut feeling or traditional rules, this signal was **discovered by a genetic algorithm** that analyzed 166 real gapper stocks over 70 trading days.
The algorithm tested thousands of signal combinations and evolved over 50 generations to find the exact conditions that preceded profitable short entries.
---
### 🎯 Performance (Backtest)
| Metric | Value |
|--------|-------|
| **Win Rate** | 81.8% |
| **Profit Factor** | 20.34 |
| **Stop Loss** | 3.4% |
| **Take Profit** | 8.6% |
*Based on 166 gapper stocks, $1-20 price range, >3% gap, >100k volume*
---
### 🔍 How It Works
The indicator fires a SHORT signal when **ALL 5 conditions** are met:
**1. Overextended Above VWAP**
Price must be trading more than 1.5 ATR above VWAP. This means the stock has run too far, too fast and is stretched like a rubber band.
**2. Volume Dying Down**
NOT a volume climax (RVOL < 3x). We want to see buying pressure fading, not a blowoff top with massive volume.
**3. Rejection Candle (Key Signal!)**
Upper wick must be >51% of the candle range. This is the smoking gun - price tried to push higher but got slammed back down. Sellers are stepping in.
**4. Still Elevated**
Price must be at least 6.66% above the low of day. We want to short stocks that are still high, not ones that have already crashed.
**5. Time Window**
Within the first 5.5 hours of trading. Gapper fades work best when there's still time in the day for the move to play out.
---
### 📈 Best Used On
- **Timeframe:** 1-minute charts
- **Stocks:** Gap-up stocks (>3% gap from previous close)
- **Price Range:** $1-20 (small caps / penny stocks)
- **Volume:** High relative volume days
- **Session:** Regular trading hours
---
### 🖥️ Features
✅ Clean visual signals (red triangles)
✅ Auto-drawn stop loss and take profit levels
✅ Real-time info table showing all conditions
✅ Condition status indicators (✓/✗)
✅ Entry label with exact stop/target prices
✅ Built-in alerts
---
### ⚙️ Settings
| Input | Default | Description |
|-------|---------|-------------|
| Stop Loss % | 3.4% | Distance to stop loss |
| Take Profit % | 8.6% | Distance to profit target |
| Show Info Table | On | Display condition status |
| Show All Conditions | Off | Expanded table view |
---
### 🧬 The Science Behind It
This indicator wasn't designed by a human - it was **evolved**.
A genetic algorithm started with 100 random indicator configurations, each with different entry conditions and thresholds. These "individuals" were backtested against historical gapper data, and the top performers were bred together to create the next generation.
After 50 generations of evolution, only the fittest signals survived. The result is the 5-condition setup you see here.
**Why genetic optimization?**
- Removes human bias from signal design
- Tests combinations humans would never think of
- Finds exact threshold values (not round numbers)
- Adapts to real market data, not theory
---
### ⚠️ Important Notes
**This is a tool, not a guarantee.**
- Backtest performance ≠ future results
- 11 trades in backtest = small sample size
- Always use proper position sizing
- Paper trade before going live
- Works best on liquid stocks with tight spreads
**Risk Management is Everything**
The 81.8% win rate means nothing if you size incorrectly or move your stops. Stick to the 3.4% stop / 8.6% target that the algorithm optimized for.
---
### 💡 Trading Tips
1. **Wait for the signal** - Don't anticipate. Let all 5 conditions align.
2. **Check the table** - Use the info panel to see which conditions are met.
3. **Respect the stop** - The 3.4% stop is part of the edge. Don't widen it.
4. **Let winners run** - 8.6% target gives you 2.5:1 reward-to-risk.
5. **One trade per setup** - Don't re-enter if stopped out.
---
### 🔔 Alerts
Set up alerts for "SHORT Signal" to get notified when all conditions align. Works with TradingView mobile notifications.
---
### 📝 Changelog
**v1.0** (January 2026)
- Initial release
- Genetic optimization on 166 gappers / 70 trading days
- 5-condition SHORT signal
---
### 🙏 Credits
Built using genetic algorithm optimization techniques applied to Polygon.io historical data. Special thanks to the algo trading community for inspiration.
---
### ⚖️ Disclaimer
This indicator is for educational and informational purposes only. It is not financial advice. Trading involves substantial risk of loss. Past performance does not guarantee future results. Always do your own research and consult with a qualified financial advisor before making trading decisions.
---
## Tags
`short` `gapper` `gap-up` `fade` `mean-reversion` `genetic-algorithm` `machine-learning` `day-trading` `momentum` `vwap` `rejection` `small-cap` `penny-stocks`
---
## Category
Trend Analysis / Momentum / Volatility

DayTradeMind Combined High Win Rate StrategyThe DayTradeMind Combined High Win Rate Strategy is a trend-following system that relies on confluence—the idea that a trade signal is stronger when multiple independent indicators agree. Instead of entering on a single indicator's whim, it uses a "voting" system to qualify entries and a strict risk-to-reward ratio to manage exits.Here is a breakdown of the three main layers of this strategy:1. The Voting Engine (Confluence Model)The strategy tracks four indicators and assigns a "point" for a bullish or bearish bias. It requires a minimum number of points (set by minConfirmations, usually 2/4) before it even considers a trade.IndicatorBullish Condition (1 point)Bearish Condition (1 point)PurposeMACDMACD Line > Signal LineMACD Line < Signal LineMeasures short-term momentum.DonchianPrice > 20-period MedianPrice < 20-period MedianIdentifies price relative to recent range.SuperTrendPrice above trend linePrice below trend lineFilters for the "Macro" trend direction.%B (Bollinger)Price in lower-mid range (0.2–0.5)Price in upper-mid range (0.5–0.8)Prevents buying when overextended.2. The Entry TriggerHaving enough "votes" (confirmations) isn't enough to enter. The strategy waits for a trigger event to ensure you aren't entering a stale trend. An entry only occurs if the minimum confirmations are met AND one of the following happens on the current bar:MACD Cross: The MACD line crosses over the signal line.Structural Break: The price crosses over the Donchian Middle (Median) line.This "Confirmation + Trigger" approach is designed to catch the start of a momentum push rather than buying a flat market.3. Mathematical Risk ManagementThe performance you see in your backtest (like the 46.86% return) is largely driven by the 2:1 Reward-to-Risk (RR) Ratio.Stop Loss (SL): Fixed at 2% below entry.Take Profit (TP): Fixed at 4% above entry.By aiming for a target twice as large as the risk, the strategy can remain profitable even with a win rate as low as 35%–40%. Mathematically, your winning trades compensate for more than two losing trades.Visualizing the SystemTriangles: Small green (up) and red (down) triangles appear on your chart only when the Votes + Trigger align perfectly.Background Shading: Faint green or red bands show you exactly when the "Confluence" is active. If the background is gray, the indicators are in conflict.Dashboard: The table in the top-right summarizes the current "score" for each indicator, letting you know how close you are to a potential trade signal.

STAX# STAX - MapleStax Candle by Candle Automation
## Overview
STAX is a trend-following indicator that automates the "MapleStax Candle by Candle (CBC)" methodology for futures and equity trading. This system uses a higher timeframe anchor trend combined with lower timeframe execution filters to identify high-probability pullback entries in the direction of the prevailing trend.
## How It Works
### 1. Anchor Trend Detection (10-Minute CBC Flip)
The core of this system is the CBC (Candle by Candle) flip logic on the anchor timeframe (default: 10 minutes):
- **Bullish Flip**: Occurs when a 10m candle closes ABOVE the high of the previous 10m candle
- **Bearish Flip**: Occurs when a 10m candle closes BELOW the low of the previous 10m candle
- Once a flip occurs, the trend remains in that direction until an opposite flip happens
The anchor trend is calculated using `request.security()` with `lookahead=barmerge.lookahead_off` and indexed historical data ` ` to ensure non-repainting behavior. This means signals will not change or disappear after they appear.
### 2. Execution Filters (Current Timeframe)
On your current chart timeframe (recommended: 3 minutes), the indicator applies two key filters:
**EMA Confirmation**:
- For LONG signals: 9-period EMA must be greater than 20-period EMA
- For SHORT signals: 9-period EMA must be less than 20-period EMA
**VWAP Filter** (Strict or Target mode):
- **Strict Mode** (default): Only shows signals when price is on the correct side of VWAP
- LONG signals only above VWAP
- SHORT signals only below VWAP
- **Target Mode**: Shows all valid signals but uses VWAP as the take profit target when price is on the "wrong" side
### 3. Entry Signal Logic
The indicator looks for pullback entries:
- **BUY Signal**: 10m trend is Bullish + EMA 9 > 20 + Current 3m candle is RED (close < open)
- Logic: Wait for a red pullback candle in a bullish trend with bullish EMA alignment
- **SELL Signal**: 10m trend is Bearish + EMA 9 < 20 + Current 3m candle is GREEN (close > open)
- Logic: Wait for a green retracement candle in a bearish trend with bearish EMA alignment
This pullback logic helps you enter after a brief counter-trend move, improving risk/reward compared to chasing breakouts.
### 4. Risk Management
**Stop Loss**: Automatically set at the previous 10-minute candle's low (for longs) or high (for shorts). This represents the last swing point that would invalidate the trend structure.
**Take Profit**:
- When aligned with VWAP: Fixed tick-based target (default: 20 ticks, adjustable)
- When counter to VWAP: Target is VWAP itself, providing a logical profit target
The indicator displays TP and SL levels visually and alerts when they are hit.
### 5. Signal Management
To prevent over-trading, the indicator includes a **cooldown period** (default: 10 bars minimum between signals). This stops signal spam in choppy conditions and forces you to wait for the market to develop before taking another trade.
### 6. Time Session Filters
Two separate trading sessions can be configured with 12-hour clock inputs:
- **Session 1**: Default 9:30 AM - 4:00 PM (New York regular hours)
- **Session 2**: Optional second session for extended hours or different time zones
Signals only appear during enabled sessions, helping you trade during liquid market hours.
## What Makes This Original
This indicator automates a specific methodology (MapleStax CBC) that combines multiple proven concepts:
1. Higher timeframe trend structure (CBC flip logic)
2. Lower timeframe execution timing (EMA filters)
3. Pullback entry strategy (counter-colored candles)
4. Volume-based target selection (VWAP integration)
5. Swing-based stop placement (previous anchor swing points)
The combination of these elements into an automated system with visual feedback and alert functionality is what provides value beyond using these indicators separately.
## How to Use
1. **Choose Your Timeframes**:
- Anchor timeframe: 10 minutes (adjustable) for trend direction
- Execution timeframe: 3-5 minutes recommended for entries
2. **Select VWAP Mode**:
- **Strict Mode**: More conservative, only trades with VWAP bias
- **Target Mode**: More aggressive, uses VWAP as profit target
3. **Configure Sessions**: Enable Session 1 and optionally Session 2 to match your trading hours
4. **Set Risk Parameters**: Adjust take profit ticks based on your instrument and risk tolerance
5. **Watch for Signals**:
- Green "BUY" label below bars = Long entry
- Red "SELL" label above bars = Short entry
- Dashed red line = Stop loss level
- Green "TP ✓" or Red "SL ✗" labels show exit points
6. **Monitor the Status Table**: The table in the top-right shows:
- Current 10m trend direction
- EMA alignment status
- VWAP position
- Active session status
- Current signal state
- Active trade information
7. **Set Alerts**: Use TradingView's alert system with the built-in alert conditions:
- BUY Signal
- SELL Signal
- Take Profit Hit
- Stop Loss Hit
## Best Practices
- **Recommended Timeframes**: 3m execution chart with 10m anchor works well for active trading
- **Instrument Selection**: Works best on liquid futures contracts (ES, NQ, CL, etc.) and major forex pairs
- **Session Trading**: Enable Session 1 for New York hours; avoid low-volume periods
- **Backtest First**: Always backtest the settings on your specific instrument before live trading
- **Use Realistic Parameters**: Default 20-tick TP is conservative; adjust based on instrument volatility
## Limitations and Warnings
**This indicator does NOT**:
- Guarantee profitable trades (past performance does not indicate future results)
- Account for slippage, commissions, or real-world execution challenges
- Work equally well in all market conditions (performs poorly in low-volume, range-bound markets)
- Replace proper risk management and position sizing
- Provide financial advice
**Repainting**: This indicator is designed to be non-repainting. Signals use indexed historical data from the anchor timeframe, meaning they will not change or disappear after they appear. However, the current bar's status will update in real-time until it closes.
**Market Conditions**: This trend-following pullback system performs best in trending markets with clear directional bias. In choppy, range-bound conditions, expect more false signals despite the cooldown filter.
**Stop Loss Execution**: The stop loss levels shown are theoretical. In fast-moving markets, actual fills may occur at worse prices due to slippage.
## Input Parameters
**Anchor Settings**:
- Anchor Timeframe: Higher timeframe for trend detection (default: 10 minutes)
**EMA Settings**:
- Fast EMA: Short-period EMA for execution bias (default: 9)
- Slow EMA: Long-period EMA for execution bias (default: 20)
**VWAP Settings**:
- Strict VWAP Filter: Toggle between strict filtering and target mode
**Signal Management**:
- Min Bars Between Signals: Cooldown period to prevent spam (default: 10 bars)
**Time Filters**:
- Session 1 & 2: Configure up to two trading sessions with start/end times in 12-hour format
**Risk Management**:
- Take Profit (Ticks): Fixed tick target when aligned with VWAP (default: 20)
**Visual Settings**:
- Show Trend Background: Background color based on 10m trend
- Show Stop Loss Lines: Display SL levels on chart
- Show EMAs: Display 9/20 EMAs on chart
- Show VWAP: Display daily VWAP on chart
## Technical Notes
- Uses Pine Script v5
- Non-repainting implementation via `request.security()` with `lookahead_off` and indexed data
- Suitable for alerts and automated trading integration
- Maximum 50 labels and 50 lines to maintain performance
- Status table updates on each bar close
## Credits
This indicator automates the MapleStax Candle by Candle methodology. The CBC flip logic and pullback entry concept are part of the MapleStax trading education system.
---
**Disclaimer**: This indicator is for educational and informational purposes only. It is not financial advice. Trading futures, forex, and equities carries substantial risk of loss. Past performance is not indicative of future results. Always trade with risk capital you can afford to lose and use proper position sizing.

Midnight Open Levels by haze!This indicator automatically plots the midnight open prices for both the New York (00:00 EST) and London (00:00 GMT) trading sessions. These levels are widely recognized in institutional trading frameworks as significant reference points for intraday price action.
What Are Midnight Open Levels?
Midnight open levels represent the price at which each major trading session begins at 00:00 local time. Institutional traders and algorithmic systems often reference these levels when making trading decisions, which can create zones of increased liquidity and potential price reactions.
This indicator is provided for educational purposes. No indicator guarantees profitable trades. Always practice proper risk management, use appropriate position sizing, and conduct your own analysis before making trading decisions.

ColorFlow EMA📊 ColorFlow EMA — Trend Flow & Bias Indicator
🔹 What This Indicator Does
ColorFlow EMA is a clean, visual trend-flow indicator designed to show directional bias and momentum state at a glance.
It uses two exponential moving averages:
Fast EMA (default: 10)
Slow EMA (default: 20)
The area between the EMAs is color-shaded to clearly display whether price is in a bullish or bearish flow.
🎨 Visual Logic
🔵 Blue shading → Bullish flow
(Fast EMA above Slow EMA)
🔴 Red shading → Bearish flow
(Fast EMA below Slow EMA)
Optional crossover markers can be enabled for visual confirmation when EMA alignment changes.
🧠 How to Use ColorFlow EMA
This indicator is not a standalone strategy and is not intended for signal-chasing.
It is best used as a context and bias filter alongside:
Price action
Market structure (HH/HL, LH/LL)
Support & resistance or supply & demand zones
Pullbacks vs premium/discount
Typical use cases:
Favor longs when the flow is blue
Favor shorts when the flow is red
Avoid forcing trades when EMAs are tangled or flat
Wait for pullbacks into structure instead of chasing price
⚠️ Important Notes
EMA crossovers alone do not guarantee profitable trades
Market conditions, structure, and location always matter
Works best in trending or transitioning markets
Not designed for ranging/choppy environments without context
⚙️ Customization
EMA lengths can be adjusted
Crossover markers can be toggled on/off
Designed to stay visually clean and uncluttered
🎯 Who This Indicator Is For
Traders who prioritize price action over indicators
Intraday traders (forex, indices, ETFs, stocks)
Traders who want clarity, not noise
📝 Final Thought
ColorFlow EMA answers one simple question:
“Should I be looking for longs or shorts here?”
Use it for bias, not prediction.

VWMA Cross Buy SignalCore Components & Logic
1. The Entry Engine (VWMA + Filters)
The strategy triggers a long signal when a Volume Weighted Moving Average (VWMA) crossover occurs.
Unlike a standard Simple Moving Average, the VWMA gives more weight to bars with higher volume. This ensures the indicator responds faster to "Smart Money" moves and slower to low-volume noise.
It uses a secondary Trend Filter (defaulting to the 200 EMA). By only buying when the price is above this line, the indicator forces you to stay on the right side of the primary market trend.
It requires volume to be higher than its recent average (e.g., 1.1× or 10% higher). This prevents entries on weak, low-conviction price moves.
2. The Dynamic Exit System
You have two distinct ways to manage your risk and targets, toggleable in the settings:
ATR Based (Volatility Adjusted): It calculates the Average True Range (ATR) to determine how volatile the stock is. By setting your Stop Loss at 2.0×ATR, you avoid getting "shaken out" by normal daily price fluctuations. The Take Profit is set at 4.4×ATR to capture large trend extensions.
Fixed % (Static): A more rigid approach where you set a hard percentage target (e.g., 10% gain / 5% loss).
3. The Performance Analytics Table
The grey minimalist table in the bottom-right corner uses cumulative percentage-based math to show:
Realized RRR: The actual Reward-to-Risk ratio based on your closed trades.
Break-Even Win Rate: The minimum win rate you need to stay profitable with your current RRR. It uses the formula:
BE WR=1+RRR1
Current Win Rate: Highlighted in Green if you are beating the Break-Even rate, or Red if the strategy is currently losing money on that specific stock.
Max Drawdown %: The most important metric for risk. It shows the largest peak-to-trough decline in your equity curve, letting you know how much losing streak can hurt your equity.
Strategic Use Case
This indicator is optimized for Stock Screening. When you flip through your watchlist, the table updates instantly.
If you see a stock with a high Win Rate and a Max Drawdown under 10%, you have found a ticker where the VWMA crossover logic is highly compatible with that stock's specific volatility. If the Win Rate cell is Red, you know the strategy is "un-tuned" for that asset and needs adjustment.
