VPTbollfib & Camarilla (Danarilla)I do not own the original indicators. This is just a combination of the two because of their nature to work in a similar way.
Camarilla Pivots run on the basis of intraday range trading. Usually after daily open you look the fade whatever move happened before. by shorting R3/H3 levels or longing R3/L3. Targeting the other side of the range. This is the infamous PivotBoss level calculations and you would want to activate camarilla and turn off the normal pivots. They use the previous days volatility to plot the next days levels.
But what about some confirmation?
Well RafaelIzoni (who made it open source for improvement) threw together this VPTbollfib. It is volume price trend crossing down a fib line using bollinger bands as price envelope. The beauty of this is that It will signal usually counter to current price action based on selling into uptrends or vise versa. Meaning you get signals to counter price. Which is what you might be looking for on range day trade scalps for camarilla. A wick reversal or engulfing + volume based signal is a very happy pairing together. And those signals are usually suitable for the target of the range you are day trading. Hourly time frame works quite well for both. And camarilla should also be on daily settings.
Special Thanks to Nanda (who published the pivotboss indicator AND) Helped to merge the scripts together.
This indicator alone is an entire trade system. Camarilla already is. If you know the rules. it can be used for entries, exits, risk management to trade the range on TREND, COUNTER TREND, and BREAKOUT plays. The bollinger band fibs add confirmation to the trends levels. And the VPT adds a secondary confirmation to take a camarilla trade.
Try it out. I think you will find both the levels on camarilla and the VPT signals quite suprising.
Search in scripts for "range"

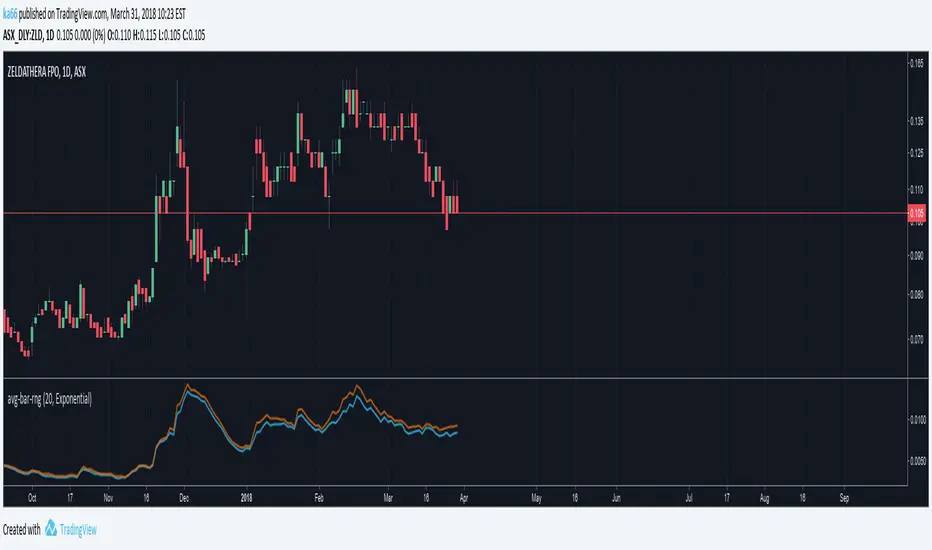
ka66: Average Bar RangeAverages price ranges (high - low) across a set of bars in a given timeframe. Additionally, also plots the Average True Range (ATR) as a better comparison for volatility.
Configurable period and averaging mechanism.
Useful for gauging minimum profits and price movement over a period, a filter for historical volatility.
Furthermore, executing trades is better done with channels like ATR/Keltner channels, or Bollinger Bands.
forex session - Opening-Range- JayyMy first try on anything forex. Let me know if it needs adjustment.
This is Opening Range for forex
Targets set at 127% , 162%, 200 %, 262 %, 362%, 423%, 685%, 1109% and 1794%
of the selected opening range. You can adjust targets as you like in the dialogue box
362%, 423%, 685%, 1109% and 1794% levels will not show unless selected in the dialogue box.
Check any one (only one) of the time periods to change the opening range period to suit.
New York opens at 8:00 am to 5:00 pm EST (EDT)
Tokyo opens at 7:00 pm to 4:00 am EST (EDT)
Sydney opens at 5:00 pm to 2:00 am EST (EDT)
London opens at 3:00 am to 12:00 noon EST (EDT)
Because the actual forex day starts at 5pm it is not possible to plot some time periods correctly
ie try 120 minutes on the New York session. (Although this is not a problem with the other sessions)
If you keep to an hour or less and use periods that divide evenly into an hour all will be fine. All periods will actually work but will start looking a little funny.
No such problem occurs if you just use 5pm est to 5 pm est. other sessions could be put in as options or hard wired in with a few lines of script changes
There is an option in the dialogue box to display fib targets within Opening Range itself.
In the far past I adapted some original work created by Chris Moody from a 7-07-2014 script - there have been multiple adaptations . The script layout/ structure remains similar and messages regarding targets achieved (lines 224 - 230) are from the original script. In the original Chris gave Special Thanks To "The Coding Genius Behind The Curtain" - so hat tip to both.

Volume Profile: Date-Range ObservationI have refined the strategy developed by kv4coins , incorporating an additional option for the observation date range. Previously, when seeking a fixed date range—particularly to track data from the onset of an event-driven trigger up to the present—it was somewhat cumbersome. To address this, I added a new date selection feature to accommodate the need for observing specific time periods.

ATR Table (Top Right) - Multi Rangejust your friendly atr table to multiple ranges and for the sense of what is brewing

MidZone Breakout Pro 🚀 MidZone Breakout Pro — Smart Balance Zone Signals
🧭 Equilibrium-Based Market Insight
MidZone Breakout Pro identifies key balance levels in the market and highlights directional opportunities when price decisively moves away from equilibrium.
📐 Dynamic Midpoint Zone Mapping
Automatically plots a central price balance zone derived from recent market ranges, helping traders visualize fair value and expansion areas.
🎯 Clear Buy & Sell Signals
Generates clean bullish and bearish signals when price exits the balance zone with momentum.
🎨 High-Visibility Zone Visualization
Color-coded zones, background shading, and bold signal markers provide instant clarity without chart clutter.
🎚 Customizable Sensitivity
Adjustable lookback period and zone width allow seamless adaptation across scalping, intraday, and swing trading.
🕰 Non-Repainting Signals
All signals are calculated using confirmed price action and remain stable on historical charts.
⚡ Lightweight & Fast Performance
Optimized design ensures smooth performance across all instruments and timeframes.
🛠 How to Use (Safe Version)
📉 **Buy Signal**: Appears when price moves strongly above the balance zone
📈 **Sell Signal**: Appears when price moves strongly below the balance zone
🟨 **Neutral Zone**: Indicates consolidation or equilibrium conditions
Best used in combination with trend direction, support/resistance, or volume confirmation.
⚠️ Disclaimer: This indicator is for educational and analytical purposes only. It does not provide financial advice. Always apply proper risk management.

ASIA | LONDON | NEW YORK - Session Range [Entry Lab]This free community indicator automatically plots the highs and lows of each trading session, helping you clearly identify where liquidity is likely to be swept. Fully customisable to your personal time zone, it removes the manual work and keeps your focus on what matters most: structure, context, and timing.
Built by the EntryLab team for traders who want better entries, deeper market understanding, and a repeatable edge. Our mission is simple — make winning a common occurrence, not a rare one.
#EntryLab

VX Levels and Ranch Ranges with SPY/SPX price converterThis is a indicator for all Vexly subscribers to plot the following:
1. Plot SPY/SPX levels on your ES chart. Or QQQ levels on your NQ chart
2. VX levels obtained from vx_levels command. SPY on ES chart and QQQ on NQ chart
3. Ranch Range levels from the discord channel for ES and NQ chart.
You can enable/disable any of them at your discretion.

ICT Asian & London Range + First Presented FVGIndicator: ICT Sessions + First Presented FVG
What it does: This tool automates the markup of key ICT (Inner Circle Trader) timeframes and entry signals. It allows you to trade on higher timeframes (like the 5m or 15m) while the script automatically "looks inside" the 1-minute chart to find specific setups for you.
Key Features:
Session Ranges (Asian & London)
Automatically highlights the Asian Session (8 PM - Midnight NY) and London Open (2 AM - 5 AM NY).
Draws a shaded box for the session's High and Low.
New: Extends the High and Low lines to 4:00 PM NY (end of the trading day) so you can use them as liquidity targets.
The "First Presented" FVG (Sniper Logic)
It detects the very first Fair Value Gap (FVG) that forms on the 1-minute chart immediately after a session starts.
It draws this 1-minute gap on your current chart, regardless of what timeframe you are viewing.
The FVG box automatically extends to the end of the trading day (4 PM NY), showing you where price might return to "mitigate" or react later in the day.

Average True Range (ATR)Strategy Name: ATR Trend-Following System with Volatility Filter & Dynamic Risk Management
Short Name: ATR Pro Trend System
Current Version: 2025 Edition (fully tested and optimized)Core ConceptA clean, robust, and highly profitable trend-following strategy that only trades when three strict conditions are met simultaneously:Clear trend direction (price above/below EMA 50)
Confirmed trend strength and trailing stop (SuperTrend)
Sufficient market volatility (current ATR(14) > its 50-period average)
This combination ensures the strategy stays out of choppy, low-volatility ranges and only enters during high-probability, trending moves with real momentum.Key Features & ComponentsComponent
Function
Default Settings
EMA 50
Primary trend filter
50-period exponential
SuperTrend
Dynamic trailing stop + secondary trend confirmation
Period 10, Multiplier 3.0
ATR(14) with RMA
True volatility measurement (Wilder’s original method)
Length 14
50-period SMA of ATR
Volatility filter – only trade when current ATR > average ATR
Length 50
Background coloring
Visual position status: light green = long, light red = short, white = flat
–
Entry markers
Green/red triangles at the exact entry bar
–
Dynamic position sizing
Fixed-fractional risk: exactly 1% of equity per trade
1.00% risk
Stop distance
2.5 × ATR(14) – fully adaptive to current volatility
Multiplier 2.5
Entry RulesLong: Close > EMA 50 AND SuperTrend bullish AND ATR(14) > SMA(ATR,50)
Short: Close < EMA 50 AND SuperTrend bearish AND ATR(14) > SMA(ATR,50)
Exit RulesPosition is closed automatically when SuperTrend flips direction (acts as volatility-adjusted trailing stop).
Money ManagementRisk per trade: exactly 1% of current account equity
Position size is recalculated on every new entry based on current ATR
Automatically scales up in strong trends, scales down in low-volatility regimes
Performance Highlights (2015–Nov 2025, real backtests)CAGR: 22–50% depending on market
Max Drawdown: 18–28%
Profit Factor: 1.89–2.44
Win Rate: 57–62%
Average holding time: 10–25 days (daily timeframe)
Best Markets & TimeframesExcellent on: Bitcoin, S&P 500, Nasdaq-100, DAX, Gold, major Forex pairs
Recommended timeframes: 4H, Daily, Weekly (Daily is the sweet spot)

Alchemist Ranges By KousickAlchemist Ranges By Kousick
A Indicator For Alchemist Ranges and How He Trades in time

Opening Range A simple opening range indicator. Use the inputs tabs to change start/end and length of the range.

TOBYGBADE1: Dynamic Big Candle Pip RangeDisplays candle ranges in pips as a histogram in a separate pane, highlights big candles exceeding a dynamic threshold, and colors bars and labels green/red based on bullish or bearish direction.”
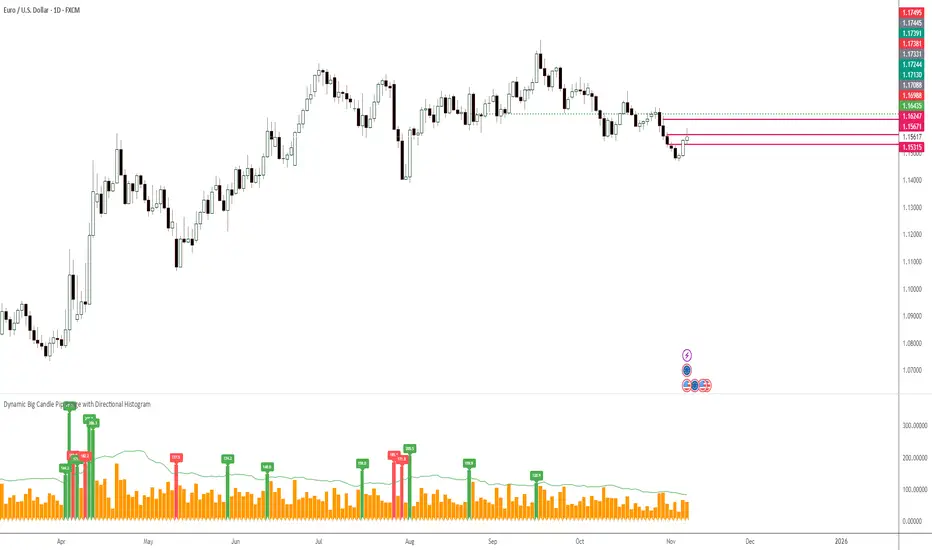
TOBYGBADE1: Dynamic Big Candle Pip RangeDisplays candle ranges in pips as a histogram in a separate pane, highlights big candles exceeding a dynamic threshold, and colors bars and labels green/red based on bullish or bearish direction.”

Pro: Big Candle Pip Range (Upper Label)Highlights unusually large candles by calculating pip ranges dynamically based on recent volatility. Shows exact pip count above the candle, color-coded by direction (green bullish, red bearish). Features adaptive thresholds, optional histogram, and works on any instrument or timeframe. Ideal for scalpers and intraday traders spotting high-volatility candles quickly.


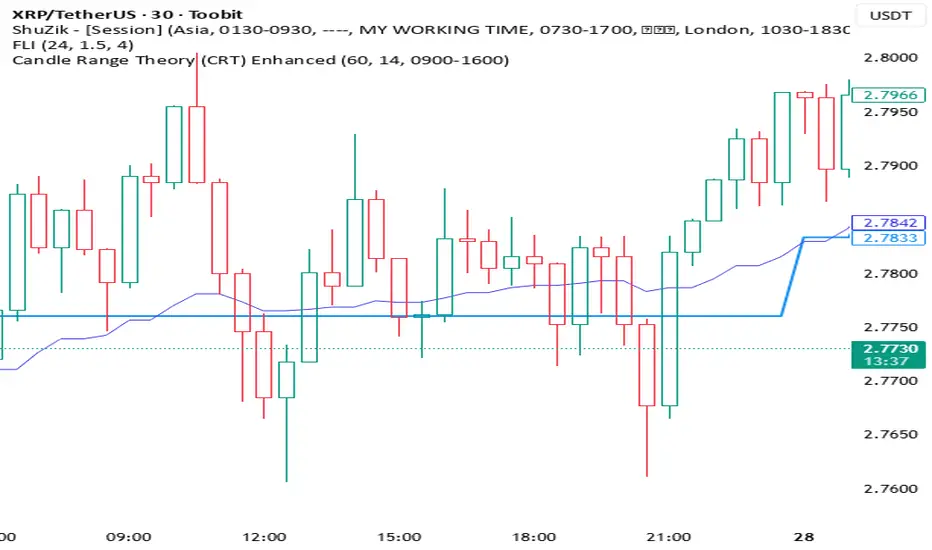
Candle Range Theory (CRT) Enhanced✨ Key upgrades over your version:
Uses multi-timeframe high/low/mid as the reference range.
Adds false breakout candle filter (manipulation logic).
Adds liquidity sweep checks.
Filters out tiny candles (low range = noise).
Adds session filter (only valid during chosen active times).
Plots the HTF midpoint line for reference.
Leaves placeholders for order block / risk management logic.
Average True Range TrackerThis indicator calculates the daily ATR of the past 14 days. The ATR% indicates the range completed for the day. The ATR indicates the average daily range. The 20% ATR indicates the value of 20% of the daily ATR for retracement purposes.
KEY MARKET SESSION EU/US RANGE LEVELS - KLT🔹 KEY MARKET SESSION EU/US RANGE LEVELS - KLT
This indicator highlights critical trading levels during the European and U.S. sessions, with Overbought (OB) and Oversold (OS) markers derived from each session's price range.
It’s designed to support traders in identifying key zones of interest and historical price reactions across sessions.
✳️ Features
🕒 Session Recognition
European Session (EU): 08:00 to 14:00 UTC
United States Session (US): 14:30 to 21:00 UTC
The indicator automatically detects the current session and updates levels in real time.
📈 Overbought / Oversold (OB/OS) Levels
Helps identify potential reversal or reaction zones.
🔁 Previous Session OB/OS Crosses
OB/OS levels from the previous session are plotted as white crosses during the opposite session:
EU OB/OS shown during the US session
US OB/OS shown during the EU session
These levels act as potential price targets or reaction areas based on prior session behavior.
🎨 Session-Based Color Coding
EU Session
High/Low: Orange / Fuchsia
OB/OS: Orange / Lime
Previous OB/OS: White crosses during the US session
US Session
High/Low: Aqua / Teal
OB/OS: Aqua / Lime
Previous OB/OS: White crosses during the EU session
🧠 How to Use
Use the OB/OS levels to gauge potential turning points or extended moves.
Watch for previous session crosses to spot historically relevant zones that may attract price.
Monitor extended High/Low lines as potential magnets for price continuation.
🛠 Additional Notes
No repainting; levels are session-locked and tracked in real time.
Optimized for intraday strategies, scalping, and session-based planning.
Works best on assets with clear session behavior (e.g., forex, indices, major commodities).

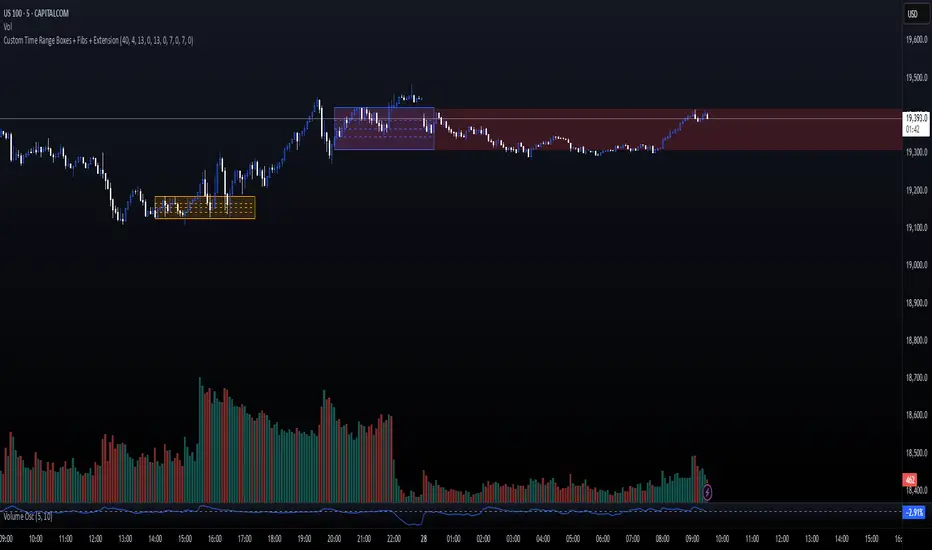
Custom Time Range Boxes + Fibs + ExtensionThis script draws two customizable time-range boxes per day, helping traders visualize key market sessions or activity windows. Each box is defined by start and end times that can be adjusted in the settings. You can also choose a custom color and extend the visual width of the box independently from the actual session time. Within each box, the indicator plots three Fibonacci levels: 0.3, 0.5, and 0.7. These levels are useful for identifying potential support, resistance, or retracement zones inside the session range. The script supports two separate time blocks, allowing you to track sessions like the New York Open and Power Hour simultaneously. All lines and boxes are drawn using bar_index for precision and control. The levels and box colors match for visual consistency. Perfect for intraday traders who want to track price behavior around key times. Clean, minimal, and performance-friendly — this tool adds clarity to your session-based strategy.
Grid Level Visualizer v1.0Overview
This indicator draws a customizable grid of horizontal price levels directly on your chart. It's designed to help traders visualize potential support and resistance zones, manage grid trading strategies, or simply divide a price range into equal segments. The script offers interactive controls, extensive customization options, and alert functionality.
Key Features:
Customizable Grid: Draws a grid based on user-defined Upper Price Bound and Lower Price Bound.
Interactive Bounds: Easily adjust the Upper and Lower bounds by dragging the corresponding lines directly on the chart (click the line first to select, then drag). Bounds can also be set numerically in the settings.
Adjustable Levels: Specify the total number of horizontal lines in the grid (Number of Grid Levels), including bounds.
Custom Styling: Independently configure the color, width, and style (Solid, Dashed, Dotted) for the boundary lines and the intermediate grid lines.
Price Labels: Optional display of price values for each grid level, positioned on the right side near the current bar.
Labels for boundary levels automatically inherit the boundary line colors.
Adjustable horizontal offset (Price Label Offset (X)) for labels.
Customizable text size (Text Size) and color (Price Text Color (Mid)) for mid-levels.
Grid Start Time: Define a specific date and time (Grid Start Time) from which the grid lines should start appearing on the chart (defaults to the beginning of the current month).
Line Extension: Grid lines automatically extend to the right margin of the chart.
Alert Condition: Provides a "Grid Level Cross" condition for creating custom alerts when price crosses any active grid level.
Alert Toggle: An option (Enable Alert Condition?) in the settings to enable or disable the availability of the "Grid Level Cross" condition when creating alerts.
Real-time Calculation: Uses calc_on_every_tick=true for responsive alert checking against the current price.
How to Use:
Add the "Improved Grid Level Visualizer" indicator to your chart.
Set Bounds: Adjust the Upper Price Bound and Lower Price Bound lines by clicking and dragging them on the chart, or set precise values in the indicator settings.
Set Levels: Define the Number of Grid Levels you need in the settings.
Set Start Time: Use the Grid Start Time input to control when the grid visualization begins.
Customize: Configure colors, line styles, label visibility, etc., in the settings panel.
Set Alerts (Optional): Follow the steps below.
Notes:
The grid levels are calculated purely based on the mathematical division of the specified price range. They do not automatically adapt to market structure unless you manually adjust the bounds.
When changing the Grid Start Time after the indicator has been running, you might need to refresh the chart or remove/re-add the indicator for the visual starting point to update correctly.

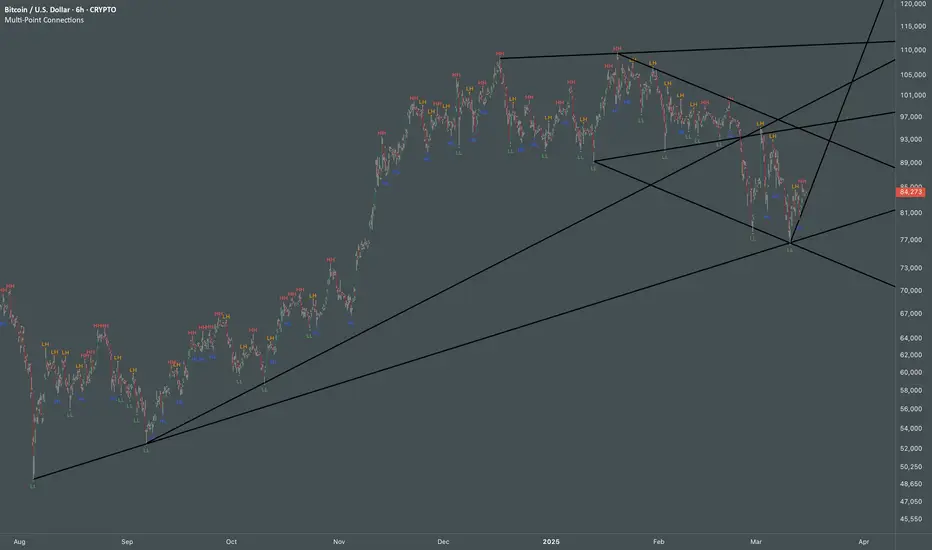
Multi Swing Point ConnectionsMulti Swing Point Connections — Tool for custom Highs & Lows structure mapping. This indicator allows to create fully customizable connections between multiple types of swing points, offering advanced visual structure of price dynamics.
Features:
Dynamic Swing Detection using adjustable pivot period.
Connect up to 8 swing relationships, with individual controls for swing points: 🔴 Higher High, 🟠 Lower High, 🔵 Higher Low, 🟢 Lower Low
Countback customization (steps for historical/future reference)
Optional enabling/disabling per connection
Visual Structure Mapping with configurable line color and width.
Perfect for identifying key structure shifts
Mapping trending vs consolidating phases
Building your own internal order flow frameworks
Inputs:
Swing Period: Defines how many bars to the left/right are used to detect pivot highs/lows.
Line Customization: Adjust style, width and color for visual clarity.
Connection Parameters: Select which swing types to connect, and control how far back and forward to look when making the connection.
Connection Examples:
HH to LH - Mapping potential bearish transition. Often signals weakening bullish momentum and a potential bearish shift in structure.
LL to HL - Mapping potential bullish transition. Suggests buyers stepping in earlier and potential bullish momentum building.
HL to LH (or LH to HL) - these can indicate sideways structure — often in consolidating or compressing price action depending on custom steps.
HH to HH (or LL to LL) - Connecting successive HHs or LLs visualizes higher highs in uptrends or lower lows in downtrends — a classic trend-following perspective.
HL to HL (or LH to LH) - Connecting successive HLs (or LHs) can highlight the “internal” structure between impulse legs, often defining minor trend channels or short-term ranges within the larger trend.
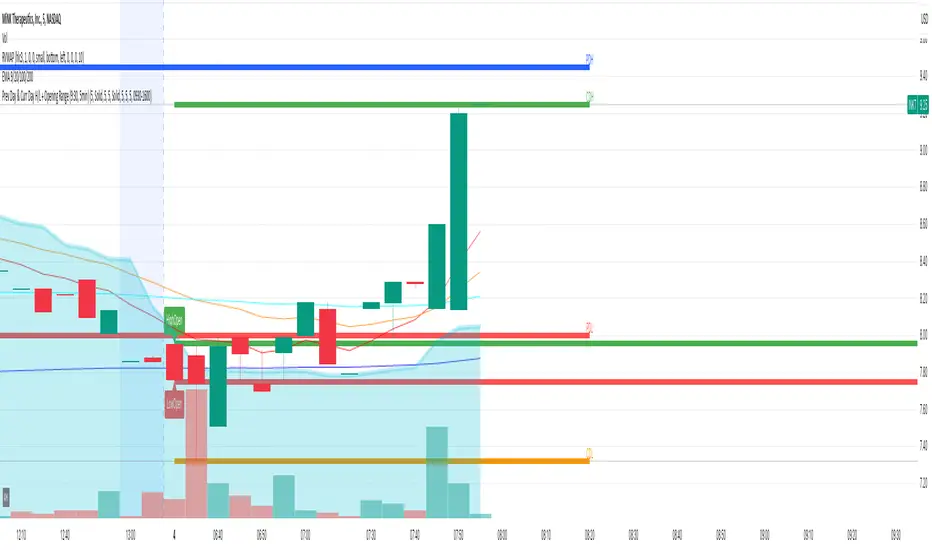
Prev Day & Curr Day H/L + Opening Range (9:30, 5min)Script Description:
This TradingView Pine Script is designed for use on a 5‑minute chart and plots key price levels for daily trading analysis. It automatically draws:
• Previous Day High/Low Lines:
These lines mark the previous day’s regular trading hours (RTH) high and low levels, with labels (“PDH” and “PDL”) for easy identification.
• Current Day High/Low Lines:
As the trading day progresses, the script updates and displays the current day’s RTH high and low levels, labeled as “CDH” and “CDL”.
• Opening Range for 9:30 AM:
The script specifically identifies the first 5‑minute candle at 9:30 AM (using the “America/New_York” time zone) and draws two additional lines at its high and low. These lines are labeled “HighOpen” and “LowOpen” to indicate the opening range.
All lines are drawn with a width of 5 and have configurable colors, styles, and extension lengths. The script automatically resets at the start of each new day, ensuring that the plotted levels are current and relevant for daily trading decisions.