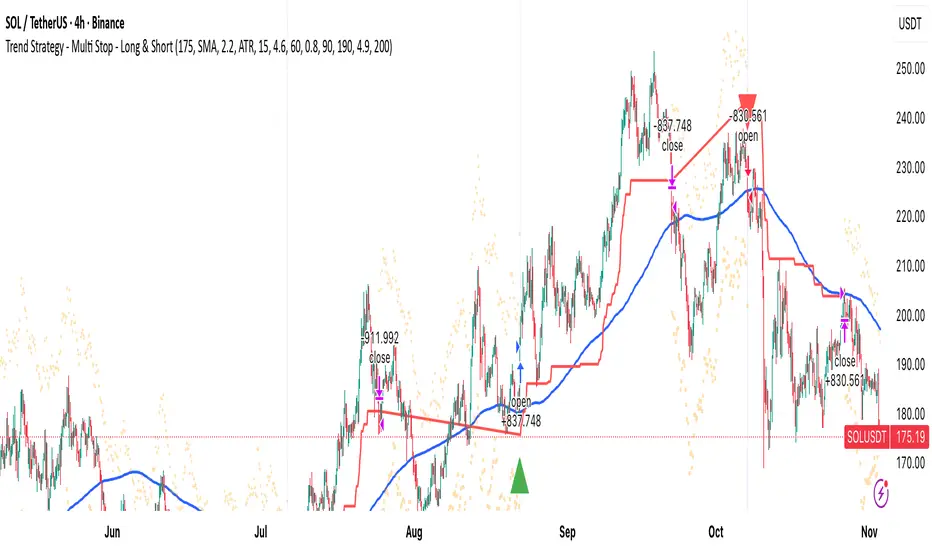
MA Break Trend Strategy - Multi Stop MethodsThis is a trend-following trading strategy with multiple stop loss options for both long and short positions.
Entry Signal: Trades are triggered when price crosses above (long) or below (short) a configurable moving average (EMA or SMA, default 200-period)
Volume Confirmation: Optional filter requiring volume to exceed a multiplier (default 1.5x) of the 20-period volume average before entering trades
Five Stop Loss Methods:
- ATR-based: Dynamic stop using Average True Range multiplier below/above entry price
- MA Buffer: Stop set at a percentage offset from a separate moving average (default 50-period EMA)
- Donchian Channel: Uses the lowest low/highest high over a specified lookback period
- Keltner Channel: ATR-based bands around an EMA basis
- Lowest Low/Highest High: Simple swing point stops based on recent price extremes
- Trailing Stops: All stop methods automatically trail in the profitable direction (upward for longs, downward for shorts) to lock in gains while never moving against the position
Visual Indicators:
- Plots the trend-following moving average in blue
- Shows active stop loss levels in red when in a position
- Displays reference lines for all stop types when flat
- Entry signals marked with triangles (green up for long, red down for short)
- Background highlighting for volume-confirmed crossovers
Search in scripts for "range"
Buy&Hold Profitcalculator in EuroTitle: Buy & Hold Strategy in Euro
Description:
This Pine Script implements a simple yet flexible Buy & Hold strategy denominated in Euros, suitable for a wide range of assets including cryptocurrencies, forex pairs, and stocks.
Key Features:
Custom Investment Amount: Define your invested capital in Euros.
Flexible Start & End Dates: Specify exact entry and exit dates for the strategy.
Automatic Currency Conversion: Supports assets priced in USD or USDT, converting the invested capital to chart currency using the EUR/USD exchange rate.
Single Entry and Exit: Executes a one-time Buy & Hold position based on the defined timeframe.
Profit and Performance Tracking: Calculates total profit/loss in Euros and percentage returns.
Smart Exit Label: Displays a dynamic label at the exit showing final position value, net profit/loss, and return percentage. The label automatically adjusts its position above or below the price bar for optimal visibility.
Visual Enhancements:
Position value and profit/loss plotted on the chart.
Background color highlights the active investment period.
Buy and Sell markers clearly indicate entry and exit points.
This strategy is ideal for traders and investors looking to simulate long-term positions and evaluate performance in Euro terms, even when trading USD-denominated assets.
Usage Notes:
Best used on daily charts for medium- to long-term analysis.
Adjust start and end dates, as well as invested capital, to simulate different scenarios.
Works with any asset, but currency conversion is optimized for USD or USDT-pegged instruments.

Enhanced MA Crossover Pro📝 Strategy Summary: Enhanced MA Crossover Pro
This strategy is an advanced, highly configurable moving average (MA) crossover system designed for algorithmic trading. It uses the crossover of two customizable MAs (a "Fast" MA 1 and a "Slow" MA 2) as its core entry signal, but aggressively integrates multiple technical filters, time controls, and dynamic position management to create a robust and comprehensive trading system.
💡 Core Logic
Entry Signal: A bullish crossover (MA1 > MA2) generates a Long signal, and a bearish crossover (MA1 < MA2) generates a Short signal. Users can opt to use MA crossovers from a Higher Timeframe (HTF) for the entry signal.
Confirmation/Filters: The basic MA cross signal is filtered by several optional indicators (see Filters section below) to ensure trades align with a broader trend or momentum context.
Position Management: Trades are managed with a sophisticated system of Stop Loss, Take Profit, Trailing Stops, and Breakeven stops that can be fixed, ATR-based, or dynamically adjusted.
Risk Management: Daily limits are enforced for maximum profit/loss and maximum trades per day.
⚙️ Key Features and Customization
1. Moving Averages
Primary MAs (MA1 & MA2): Highly configurable lengths (default 8 & 20) and types: EMA, WMA, SMA, or SMMA/RMA.
Higher Timeframe (HTF) MAs: Optional MAs calculated on a user-defined resolution (e.g., "60" for 1-hour) for use as an entry signal or as a trend confirmation filter.
2. Multi-Filter System
The entry signal can be filtered by the following optional conditions:
SMA Filter: Price must be above a 200-period SMA for long trades, and below it for short trades.
VWAP Filter: Price must be above VWAP for long trades, and below it for short trades.
RSI Filter: Long trades are blocked if RSI is overbought (default 70); short trades are blocked if RSI is oversold (default 30).
MACD Filter: Requires the MACD Line to be above the Signal Line for long trades (and vice versa for short trades).
HTF Confirmation: Requires the HTF MA1 to be above HTF MA2 for long entries (and vice versa).
3. Dynamic Stop and Target Management (S/L & T/P)
The strategy provides extensive control over exits:
Stop Loss Methods:
Fixed: Fixed tick amount.
ATR: Based on a multiple of the Average True Range (ATR).
Capped ATR: ATR stop limited by a maximum fixed tick amount.
Exit on Close Cross MA: Position is closed if the price crosses back over the chosen MA (MA1 or MA2).
Breakeven Stop: A stop can be moved to the entry price once a trigger distance (fixed ticks or Adaptive Breakeven based on ATR%) is reached.
Trailing Stop: Can be fixed or ATR-based, with an optional feature to auto-tighten the trailing multiplier after the breakeven condition is met.
Profit Target: Can be a fixed tick amount or a dynamic target based on an ATR multiplier.
4. Time and Session Control
Trading Session: Trades are only taken between defined Start/End Hours and Minutes (e.g., 9:30 to 16:00).
Forced Close: All open positions are closed near the end of the session (e.g., 15:45).
Trading Days: Allows specific days of the week to be enabled or disabled for trading.
5. Risk and Position Limits
Daily Profit/Loss Limits: The strategy tracks daily realized and unrealized PnL in ticks and will close all positions and block new entries if the user-defined maximum profit or maximum loss is hit.
Max Trades Per Day: Limits the number of executed trades in a single day.
🎨 Outputs and Alerts
Plots: Plots the MA1, MA2, SMA, VWAP, and HTF MAs (if enabled) on the chart.
Shapes: Plots visual markers (BUY/SELL labels) on the bar where the MA crossover occurs.
Trailing Stop: Plots the dynamic trailing stop level when a position is open.
Alerts: Generates JSON-formatted alerts for entry ({"action":"buy", "price":...}) and exit ({"action":"exit", "position":"long", "price":...}).

AnkeAlgo A68 strategy™ || AnkeAlgo®[16.6]## ✅ Multi-Timeframe Trend Strategy Based on MFI and Momentum Factors
### 📌 Overview
This strategy combines **Money Flow Index (MFI)** and **Momentum** to identify trend continuation and momentum reversal opportunities in the crypto market. It focuses on volume-weighted capital flow and price strength, generating trend-biased signals suitable for swing and intraday traders.
---
### 📊 Technical Indicators Used
| Indicator | Purpose |
|-----------|---------|
| **MFI (Money Flow Index)** | Detects capital inflow/outflow and filters range-bound markets |
| **Momentum Indicator** | Measures price acceleration and confirms breakout strength |
| **Optional: ATR / EMA Filters** | Can be added for volatility stop or trend validation |
---
### ⚙️ Core Logic
- **Trend Confirmation**: MFI exceeds threshold and aligns with price direction
- **Momentum Entry Trigger**: Trades are executed only when momentum crosses a signal level
- **Noise Filter**: Avoids entries when MFI divergence or momentum weakness is detected
- **Position Management**: Supports ATR-based or percentage-based stop-loss systems
---
### 🪙 Market and Asset
✅ Designed for crypto derivatives
**Recommended symbol:** `ETHUSDT.P` (Perpetual Futures)
---
### ⏱️ Recommended Timeframes
- 30-minute
- 45-minute
- 1-hour
> The **45m timeframe** shows the most stable performance in forward testing.
---
### 📈 Strategy Features
- Performs best during trending and high-momentum phases
- Low overfitting risk, adaptable across different volatility environments
- Can be used as a signal engine for grid, martingale, or multi-asset systems
- Easily extendable to BTC, SOL, BNB, and other high-liquidity assets
---
### ⚠️ Risk Disclaimer
- This is **not** a mean-reversion strategy and may produce false signals in sideways markets
- Stop-loss management and position sizing are required for live deployment
- Backtest results do not guarantee live trading performance due to slippage and trading fees
---

Tristan's Multi-Indicator Reversal StrategyMulti-Indicator Reversal Strategy - Buy Low, Sell High
A comprehensive reversal detection system that combines multiple proven technical indicators to identify high-probability entry points for catching reversals at market extremes.
📊 Strategy Overview
This strategy is designed for traders who want to buy at lows and sell at highs by detecting when stocks are overextended and ready to reverse. It works by requiring multiple technical indicators to align before generating a signal, significantly reducing false entries.
Best Used On:
Timeframe: 1-hour charts (also works on 15min, 30min, 4hour)
Session: NY Trading Session (9:30 AM - 4:00 PM ET)
Assets: Stocks, ETFs, Crypto (particularly volatile tech stocks like ZM, TSLA, AAPL)
Trading Style: Swing trading, Intraday reversals
🔧 Technical Components
The strategy combines FIVE powerful technical indicators:
1. RSI (Relative Strength Index)
2. MACD (Moving Average Convergence Divergence)
3. Williams %R
4. Bollinger Bands
5. Volume Analysis
6. Divergence Detection (Optional)
🎨 Visual Signals
Entry Signals:
🟢 Green Triangle (below candle) = BUY LONG signal
🔴 Red Triangle (above candle) = SELL SHORT signal
Exit Signals:
🟣 Purple Label = Position closed (shows "x2", "x3" if multiple entries)
Additional Indicators:
💎 Aqua Diamond = Bullish divergence detected
💎 Fuchsia Diamond = Bearish divergence detected
🔵 Blue Background = NY Session active
🟡 Yellow Bar Tint = Volume spike detected
⚪ Small Circles = Near-signal conditions (2+ indicators aligned)
Live Counter:
Top corner shows: "Bull: X/4" and "Bear: X/4"
Indicates how many indicators currently align
⚙️ How to Use This Strategy
For Beginners (More Signals):
Set "Min Indicators Aligned" to 2
Turn OFF "Require Divergence"
Turn OFF "Require Volume Spike"
Turn OFF "Require Reversal Candle Pattern"
Keep "Allow Multiple Entries" OFF
This gives you more frequent signals to learn from.
For Advanced Traders (High Probability):
Set "Min Indicators Aligned" to 3 or 4
Turn ON "Require Divergence"
Turn ON "Require Volume Spike"
Turn ON "Require Reversal Candle Pattern"
Adjust stop loss to your risk tolerance
This filters for only the highest-quality setups.
Recommended Settings for 1-Hour Charts:
Min Indicators Aligned: 3
Stop Loss: 2.5%
Take Profit: 5.0%
RSI Length: 14
Williams %R Length: 14
Volume Multiplier: 1.5x
Session: NY only (for stocks)
BUY SIGNAL generated when:
2-4 indicators show oversold/bullish conditions:
RSI < 30 and turning up
MACD crossing bullish or histogram positive
Williams %R < -80 and turning up
Price at/below lower Bollinger Band
Optional confirmations (if enabled):
Bullish divergence detected
Volume spike present
Bullish reversal candle pattern
Session filter: Signals only during NY trading hours
SELL SIGNAL Generated When:
2-4 indicators show overbought/bearish conditions:
RSI > 70 and turning down
MACD crossing bearish or histogram negative
Williams %R > -20 and turning down
Price at/above upper Bollinger Band
Optional confirmations (if enabled):
Bearish divergence detected
Volume spike present
Bearish reversal candle pattern
🛡️ Risk Management Features
Automatic Stop Loss: Protects capital (default 2.5%)
Take Profit Target: Locks in gains (default 5.0%)
Pyramiding Control: Toggle to prevent position stacking
Session Filter: Avoids overnight risk and low-liquidity periods
Position Flipping: Automatically reverses when opposite signal appears
💡 Best Practices
✅ DO:
Wait for candle close before entering (built into strategy)
Use on volatile assets with clear trends
Combine with your own analysis and risk management
Backtest on your specific assets and timeframes
Start with paper trading to learn the signals
Adjust indicator requirements based on market conditions
❌ DON'T:
Use on very low timeframes (<5 min) without adjustment
Ignore the session filter on stocks
Use maximum leverage - these are reversal trades
Trade during major news events or earnings
Expect 100% win rate - focus on risk/reward ratio
📊 Performance Notes
This strategy prioritizes quality over quantity. With default settings, you may see:
2-5 signals per week on 1-hour charts
Higher win rate with stricter settings (3-4 indicators aligned)
Best performance during trending markets with clear reversals
Reduced performance in choppy, sideways markets
Tip: Adjust "Min Indicators Aligned" based on market conditions:
Trending markets: Use 3-4 (fewer but stronger signals)
Range-bound markets: Use 2 (more signals, but watch for false breakouts)

Gold 15m: Trend + S/R + Liquidity Sweep (RR 1:2)This strategy is designed for short-term trading on XAUUSD (Gold) using the 15-minute timeframe. It combines trend direction, support/resistance pivots, liquidity sweep detection, and momentum confirmation to identify high-probability reversal setups in line with the dominant market trend.
⚙️ Core Logic:
Trend Filter (EMA 200):
The strategy only takes long positions when price is above the 200 EMA and short positions when price is below it.
Support/Resistance via Pivots:
Dynamic swing highs and lows are identified using pivot points. These act as local supply and demand levels where liquidity is likely to accumulate.
Liquidity Sweep Detection:
A bullish liquidity sweep occurs when price briefly breaks below the last pivot low (grabbing liquidity) and then closes back above it.
A bearish sweep occurs when price breaks above the last pivot high and then closes back below.
Momentum & Candle Strength:
The strategy filters signals based on candle range and body size to ensure entries occur during strong price reactions, not weak retracements.
Risk Management (1:2 RR):
Stop-loss is placed slightly beyond the last pivot level using ATR-based buffers, and take-profit is set at 2× the risk distance, maintaining a reward-to-risk ratio of 1:2.
💼 Trade Logic Summary:
Long Entry:
After a bullish liquidity sweep & reclaim, momentum confirmation, and trend alignment (above EMA 200).
Short Entry:
After a bearish sweep & reclaim, momentum confirmation, and trend alignment (below EMA 200).
Exit:
Automated via ATR-based Stop Loss and Take Profit targets.
📊 Customization Options:
Adjustable EMA length, pivot settings, ATR multipliers, and RR ratio.
Option to enable/disable trend filter.
Toggle display of S/R zones on chart.
🧠 Best Use:
Works best during London and New York sessions when Gold shows strong momentum.
Can be adapted for forex pairs and indices by tuning ATR and pivot parameters.

AIBTC Automated Trading Strategy🧠 AIBTC Automated Trading Strategy
Overview:
The AIBTC Automated Trading Strategy is a fully autonomous system designed for 4-hour timeframes (4H). It dynamically identifies support and resistance levels based on price action, and automatically executes trades when valid breakouts occur above resistance or below support. The system adapts in real time to changing market volatility, ensuring stable performance across different market conditions.
⚙️ Strategy Logic
Dynamic Support & Resistance Detection
The strategy uses an adaptive Pivot Point algorithm that adjusts parameters according to market volatility (ATR) and price deviation (Standard Deviation).
When volatility increases, the algorithm automatically widens its detection range and recalibrates channel width for better accuracy.
All support and resistance levels are detected dynamically — no manual configuration is required.
Trend & Volatility Filtering
The system applies ADX (Average Directional Index) to measure trend strength.
When ADX > 25, only strong levels are considered valid to avoid noise during weak trends.
ATR-based volatility adjustments automatically optimize lookback periods and detection sensitivity.
Breakout Signal Detection
A long position is triggered when price breaks above resistance with a valid breakout margin (default filter: 0.1%).
A short position is triggered when price breaks below support with the same breakout filter applied.
This breakout filter effectively minimizes false breakouts and improves signal quality.
Fully Automated Execution
The system is designed for both backtesting and live simulation.
All buy/sell entries are executed automatically without manual input once conditions are met.
🕒 Recommended Timeframe
4-hour (4H) candles
Suitable for short-to-medium term swing trading, balancing signal precision and trade frequency.
📊 Key Features
✅ Fully Automated — Executes long/short positions on valid breakouts
✅ Adaptive Parameters — Automatically adjusts to changing volatility
✅ Trend-Aware Filtering — Uses ADX to avoid false signals in ranging markets
✅ Multi-Asset Compatibility — Works on BTC, ETH, or any high-liquidity instrument
⚠️ Disclaimer
This strategy is a technical and algorithmic tool, not financial advice.
Always backtest and simulate before using it on live markets.
During periods of extreme volatility, signals may delay or show false breakouts — consider using stop-loss mechanisms accordingly.

VWAP & Band Cross Strategy v6VWAP & Band Cross Strategy v6: Script Summary
This Pine Script implements a highly flexible, multi-layered trading strategy centered around the Volume Weighted Average Price (VWAP) and its associated Standard Deviation Bands.
The strategy is designed to test various entry/exit models based on how the price interacts with the central VWAP line and the upper/lower volatility bands, with extensive risk management and confirmation filters.
1. Core Mechanics (VWAP & Bands)
VWAP Calculation: Calculates the VWAP based on a user-defined source (default is the close price).
Standard Deviation Bands: Creates upper and lower bands by calculating the standard deviation of the price (over 20 periods by default) and multiplying it by a user-defined Multiplier (default is 2.0). These bands dynamically expand and contract with volatility.
Plotting: The script clearly plots the VWAP (purple), the Upper Band (green), and the Lower Band (red), with a colored fill between the bands.
2. Entry Triggers
The core entry logic is based on a single, user-selected cross event between the price and the VWAP/Bands. The user can choose from six predefined entry types:
Entry Type Category
Entry Trigger (Long)
Entry Trigger (Short)
Mean Reversion
Price crosses over the Lower Band.
Price crosses under the Upper Band.
Trend Following
Price crosses over the Upper Band (Breakout).
Price crosses under the Lower Band (Breakout).
VWAP Cross
Price crosses over the VWAP.
Price crosses under the VWAP.
3. Filters and Confirmation
Trades are only executed if they pass a series of optional filters, making the strategy highly customizable:
Technical Confirmation (Optional): Users can enable and configure up to three additional indicators that must align with the trade direction:
RSI: Price must be Oversold (for Long) or Overbought (for Short).
SMMA: Price must be above the SMMA (for Long) or below (for Short).
MACD: MACD line must cross the Signal line and the Histogram must be positive/negative.
Time and Day Filters: Trades are restricted to a defined Entry Start/End Hour/Minute window, and only execute on user-selected Trading Days of the week.
Trade Direction: Can be toggled to execute Long Only, Short Only, or Both.
4. Advanced Risk Management (Daily Limits)
The strategy incorporates robust daily limits that reset at a configured Daily Reset Hour/Minute:
Daily Profit/Loss Limits: If the running total of Realized PnL (closed trades) + Unrealized PnL (open position) exceeds a user-defined Daily Take Profit (in Ticks) or falls below the Daily Stop Loss (in Ticks), the strategy locks out new trades and immediately closes any open position.
Max Daily Trades: Prevents the strategy from entering more than a specified number of trades per day.
5. Exit Logic
The strategy exit is also highly configurable via the Exit Type setting:
Fixed Ticks / ATR / Capped ATR: If one of these is selected, the script calculates a static Stop Loss and Take Profit level upon entry, using either fixed tick values or dynamic values based on the Average True Range (ATR), which are then executed using Pine Script's strategy.exit function.
Cross Exits (VWAP/Bands): If selected, the position is closed when the price crosses the VWAP or a specific band in the opposite direction.
End-of-Day Close: An unconditional exit that closes all open positions at a user-defined Close All Hour/Minute, regardless of profit/loss or limit status, preventing positions from being held overnight.

Mario vr SIT MC Utilizar en el gráfico
4
1
55
🧠 Market Structure Pro System – MVR
Market Structure Pro System – MVR is an advanced trading strategy designed to detect key reversal and trend-break zones with high precision.
It combines multiple professional tools within a single algorithm — integrating market structure, dynamic channels, volatility filters, and trend confirmations — making it ideal for scalping and swing trading across different markets (Forex, indices, cryptocurrencies, or stocks).
⚙️ How it works
The algorithm performs a complete structural analysis of the market through several technical layers:
🔹 1. Price Structure (BOS, Supply & Demand)
The system automatically detects:
Order Blocks
Supply and Demand Zones
Break of Structure (BOS) to identify market structure shifts
This allows traders to recognize where price is likely to react or break a trend, anticipating major market movements.
🔹 2. Keltner Channels and Linear Regression
The strategy uses multiple Keltner Channels with different settings to measure volatility expansion and contraction.
In combination, a dynamic linear regression line shows the overall market direction, helping confirm whether price is trending or ranging.
🔹 3. Volatility and Trend Filters
It integrates several complementary systems:
ATR (Average True Range): measures the strength and volatility of price movement.
PSAR (Parabolic SAR): identifies potential trend reversals.
Supertrend: acts as the main trend filter and confirmation tool.
These filters work together to avoid false signals in ranging or low-volatility conditions.
🔹 4. Swing Highs / Lows and Dynamic Lines
The indicator also marks swing high and low points, helping visualize dynamic support and resistance levels and potential price reversal areas.
📈 Signal Interpretation
BUY signals:
Occur when price breaks a demand zone or bearish structure, while trend filters (Supertrend / PSAR) confirm bullish direction.
SELL signals:
Trigger when price breaks a supply zone or bullish structure, with bearish confirmation from the trend filters.
These conditions can be further validated by visual confirmations from the Keltner Channel or a color change in the linear regression.
Script protegido
Este script se publica como código cerrado. Sin embargo, puede utilizarlo libremente y sin limitaciones: obtenga más información aquí.
mariovr_usd
Exención de responsabilidad
La información y las publicaciones que ofrecemos, no implican ni constituyen un asesoramiento financiero, ni de inversión, trading o cualquier otro tipo de consejo o recomendación emitida o respaldada por TradingView. Puede obtener información adicional en las Condiciones de uso.
1 comentario

Enhanced OB Retest Strategy v7.0The OB Retest Strategy is a full Order Block retest trading system that detects, plots, and trades OB zones across multiple timeframes. It uses structure breaks, retrace depth, and ATR filters to identify strong reversal or continuation setups.
⸻
⚙️ Core Features
• Multi-timeframe OB detection using break-of-structure (BOS) logic
• Automatic zone creation for bullish and bearish order blocks
• Smart merging of overlapping OB zones
• Dynamic flip-zone logic that turns invalidated OBs into new zones
• Wick zone detection for high-precision entries
• ATR-based trailing stop and optional breakeven
• Adjustable retrace depth, breakout %, and ATR filters
• Built-in performance table showing PnL, win rate, and total trades
• Fully backtestable with date range and commission control
⸻
🧠 Logic Summary
1. Detects a BOS on the higher timeframe.
2. Identifies the last opposing candle as the valid OB.
3. Validates the OB based on ATR size and breakout strength.
4. Waits for price to retest the zone to a set depth.
5. Executes trades and manages exits using trailing stop or breakeven.
6. Flips invalidated zones automatically.
⸻
💡 Usage Tips
• Best used on 1H to 4H charts for swing setups.
• Tune ATR and breakout thresholds for your market’s volatility.
• Combine with higher-timeframe bias or liquidity levels for better accuracy.
⸻
⚠️ Notes
• For educational and testing purposes only.
• Backtested results do not predict future performance.
• Always test before live use.

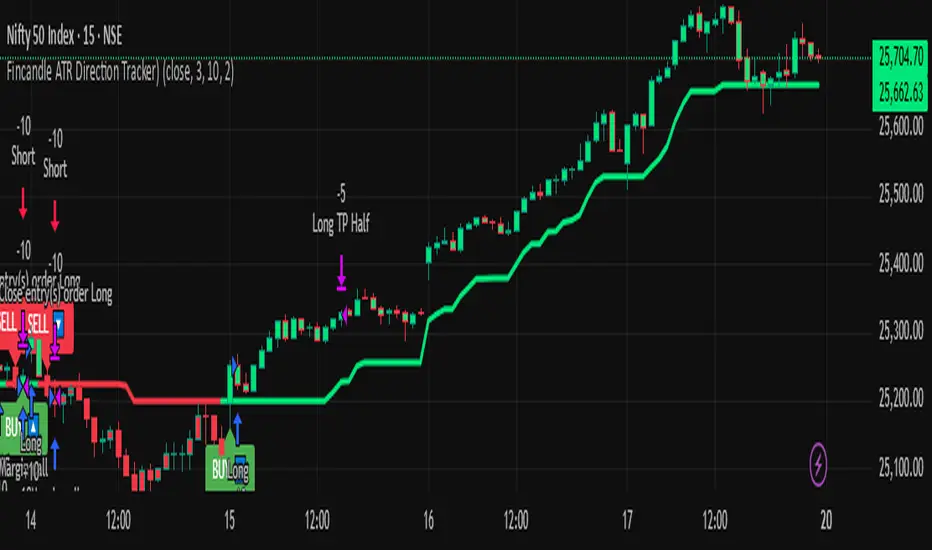
Fincandle ATR Direction TrackerOverview
The Fincandle ATR Direction Tracker is a strategy designed to capture momentum moves in the market using a dynamic ATR-based trailing stop. It identifies strong momentum candles and filters signals using trend alignment with moving averages.
Partial exits allow users to take a portion of profit at a predefined ATR multiple while keeping the remaining position open until the opposite signal occurs.
How It Works
Momentum Detection:
Measures candle body size relative to the Average True Range (ATR).
A candle is considered momentum if its body size exceeds ATR × Multiplier.
Trend Filter:
Uses two moving averages (Fast MA and Slow MA) to determine the market trend.
Bullish trend: Fast MA > Slow MA → long trades allowed
Bearish trend: Fast MA < Slow MA → short trades allowed
Trend filter can be toggled on or off.
ATR Trailing Stop:
A dynamic trailing stop adapts to price volatility.
Crossing above the trail triggers a buy signal, crossing below triggers a sell signal.
Partial Exit / Take Profit:
Step 1: Exit 50% of the position when price moves a configurable multiple of ATR in your favor.
Step 2: Close the remaining position when the opposite signal occurs (e.g., price crosses below/above the ATR trail).
How to Use
Add the strategy to any chart (stocks, indices, forex, crypto).
Configure ATR period, sensitivity, take profit multiple, and moving average lengths to suit the timeframe and asset.
Monitor buy/sell markers and dynamic ATR trail on the chart.
Optional: Set alerts for real-time notifications when signals trigger.
Adjust partial exit multiplier to control risk/reward.
Example Settings
ATR Period: 10
ATR Sensitivity: 3 × ATR
Take Profit: 2 × ATR
Fast MA: 50
Slow MA: 200
Partial Exit: 50% of position at take profit, remaining exits on opposite signal
Key Features
Adaptive ATR trailing stop for volatility-based entries/exits.
Trend alignment filter with Fast/Slow MA.
Partial exit logic for better risk management.
Visual BUY/SELL markers and alerts.
Fully Pine Script v6 compatible.
Disclaimer
This strategy is for educational and analytical purposes only.
It does not guarantee profits. Traders should always use proper risk management.
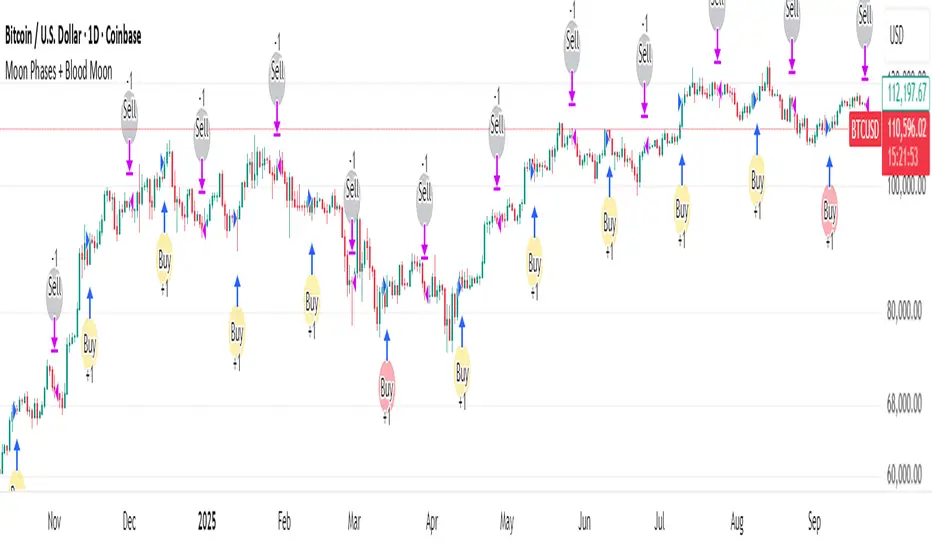
Moon Phases + Blood MoonWhat it is
This is a simple, time-based strategy that goes long on full moons and exits on the next new moon, while visually highlighting historically known “Blood Moon” (total lunar eclipse) dates. It’s built for exploratory testing of lunar timing effects on price, not for predictive claims.
Why it’s useful / originality
Most lunar scripts only mark phases. This one (1) computes lunar phases on the chart, (2) normalizes and flags Blood Moon days from a curated list, and (3) turns the phase changes into an executable strategy with clear, reproducible entry/exit rules and a configurable start date—so traders can quickly evaluate whether a lunar timing overlay adds any edge on their market/timeframe.
How it works (concept)
Moon phase detection: Uses Julian date conversion and standard astronomical approximations to determine the most recent phase change at each bar. The script classifies phase turns as +1 = New Moon and –1 = Full Moon, tracking the latest valid time to avoid lookahead.
Blood Moon tagging: A built-in array of UTC timestamps (total lunar eclipses) is date-matched to the current session and marked as “Blood Moon” when a full moon coincides with a listed date.
Signals & trades
Plot circles above/below bars: New Moon (above), Full Moon (below), Blood Moon (below, red).
Entry: Long at Full Moon once the bar time ≥ the user’s Start date.
Exit: Close the long on the next New Moon.
How to use
Add to your chart (non-monthly timeframes only).
Optionally adjust the Start date (default: 2001-12-31 UTC) to control the backtest window.
Use the color inputs to style New Moon / Full Moon / Blood Moon markers.
Evaluate performance on liquid symbols and timeframes that provide a sufficient number of phase cycles.
Default / publish settings
Initial capital: $10,000 (suggested)
Commission: 0.05% per trade (suggested)
Slippage: 1 tick (suggested)
Position sizing: TradingView strategy defaults (no leverage logic is added).
Timeframes: Intraday/Daily/Weekly supported. Monthly is blocked by design.
Chart type: Use standard chart types only (no Heikin Ashi, Renko, Kagi, P&F, Range) for signals/backtests.
Reading the chart
New Moon: soft gray circle above bars.
Full Moon: soft yellow circle below bars.
Blood Moon (if date-matched): soft red circle below bars.
The script also ensures symbol/timeframe context is visible—keep your chart clean so the markers are easy to interpret.
Limitations & important notes
This is a time-based heuristic. It does not forecast price and does not repaint via lookahead tricks; it avoids future leakage by anchoring to the last known phase time at each bar.
No non-standard chart signals. Using non-standard charts can produce unrealistic results.
Strategy properties like commission/slippage materially affect results—please set them to realistic values.
Backtests should include a large sample (ideally >100 trades over many cycles) to make statistics meaningful.
Past performance does not guarantee future results.
Open-source reuse / credits
Uses standard, public-domain techniques for Julian date conversion and lunar-phase approximations.
Blood Moon dates are incorporated as a hard-coded list for convenience; you may extend or adjust this list as needed.
No third-party proprietary code is reused.
Changelog / versioning
v1: Initial public release on Pine v6 with phase detection, Blood-Moon tagging, and a minimal long-only phase strategy.
Fury by Tetrad Fury by Tetrad
What it is:
A rules-based Bollinger+RSI strategy that fades extremes: it looks for price stretching beyond Bollinger Bands while RSI confirms exhaustion, enters countertrend, then exits at predefined profit multipliers or optional stoploss. “Ultra Glow” visuals are purely cosmetic.
How it works — logic at a glance
Framework: Classic Bollinger Bands (SMA basis; configurable length & multiplier) + RSI (configurable length).
Long entries:
Price closes below the lower band and RSI < Long RSI threshold (default 28.3) → open LONG (subject to your “Market Direction” setting).
Short entries:
Price closes above the upper band and RSI > Short RSI threshold (default 88.4) → open SHORT.
Profit exits (price targets):
Uses simple multipliers of the strategy’s average entry price:
Long exit = `entry × Long Exit Multiplier` (default 1.14).
Short exit = `entry × Short Exit Multiplier` (default 0.915).
Risk controls:
Optional pricebased stoploss (disabled by default) via:
Long stop = `entry × Long Stop Factor` (default 0.73).
Short stop = `entry × Short Stop Factor` (default 1.05).
Directional filter:
“Market Direction” input lets you constrain entries to Market Neutral, Long Only, or Short Only.
Visuals:
“Ultra Glow” draws thin layered bands around upper/basis/lower; these do not affect signals.
> Note: Inputs exist for a timebased stop tracker in code, but this version exits via targets and (optional) price stop only.
Why it’s different / original
Explicit extreme + momentum pairing: Entries require simultaneous band breach and RSI exhaustion, aiming to avoid entries on gardenvariety volatility pokes.
Deterministic exits: Multiplier-based targets keep results auditable and reproducible across datasets and assets.
Minimal, unobtrusive visuals: Thin, layered glow preserves chart readability while communicating regime around the Bollinger structure.
Inputs you can tune
Bollinger: Length (default 205), Multiplier (default 2.2).
RSI: Length (default 23), Long/Short thresholds (28.3 / 88.4).
Targets: Long Exit Mult (1.14), Short Exit Mult (0.915).
Stops (optional): Enable/disable; Long/Short Stop Factors (0.73 / 1.05).
Market Direction: Market Neutral / Long Only / Short Only.
Visuals: Ultra Glow on/off, light bar tint, trade labels on/off.
How to use it
1. Timeframe & assets: Works on any symbol/timeframe; start with liquid majors and 60m–1D to establish baseline behavior, then adapt.
2. Calibrate thresholds:
Narrow/meanreverting markets often tolerate tighter RSI thresholds.
Fast/volatile markets may need wider RSI thresholds and stronger stop factors.
3. Pick realistic targets: The default multipliers are illustrative; tune them to reflect typical mean reversion distance for your instrument/timeframe (e.g., ATRinformed profiling).
4. Risk: If enabling stops, size positions so risk per trade ≤ 1–2% of equity (max 5–10% is a commonly cited upper bound).
5. Mode: Use Long Only or Short Only when your discretionary bias or higher timeframe model favors one side; otherwise Market Neutral.
Recommended publication properties (for backtests that don’t mislead)
When you publish, set your strategy’s Properties to realistic values and keep them consistent with this description:
Initial capital: 10,000 (typical retail baseline).
Commission: ≥ 0.05% (adjust for your venue).
Slippage: ≥ 2–3 ticks (or a conservative pertrade value).
Position sizing: Avoid risking > 5–10% equity per trade; fixedfractional sizing ≤ 10% or fixedcash sizing is recommended.
Dataset / sample size: Prefer symbols/timeframes yielding 100+ trades over the tested period for statistical relevance. If you deviate, say why.
> If you choose different defaults (e.g., capital, commission, slippage, sizing), explain and justify them here, and use the same settings in your publication.
Interpreting results & limitations
This is a countertrend approach; it can struggle in strong trends where band breaches compound.
Parameter sensitivity is real: thresholds and multipliers materially change trade frequency and expectancy.
No predictive claims: Past performance is not indicative of future results. The future is unknowable; treat outputs as decision support, not guarantees.
Suggested validation workflow
Try different assets. (TSLA, AAPL, BTC, SOL, XRP)
Run a walkforward across multiple years and market regimes.
Test several timeframes and multiple instruments. (30m Suggested)
Compare different commission/slippage assumptions.
Inspect distribution of returns, max drawdown, win/loss expectancy, and exposure.
Confirm behavior during trend vs. range segments.
Alerts & automation
This release focuses on chart execution and visualization. If you plan to automate, create alerts at your entry/exit conditions and ensure your broker/venue fills reflect your slippage/fees assumptions.
Disclaimer
This script is provided for educational and research purposes. It is not investment advice. Trading involves risk, including the possible loss of principal. © Tetrad Protocol.

Ekoparaloji Cyrpto StrategyEkoparaloji Crypto Strategy - User Information Document
📊 Strategy Overview
This strategy provides long-term position management in cryptocurrency markets using the averaging down (pyramiding) technique. The basic logic is to controllably grow positions as prices decline and exit when specific profit targets are reached.
🎯 Key Features
✅ Automatic Entry System
Market direction is determined using a proprietary trend identification algorithm
Trades are only opened in uptrends
Initial position opens automatically when specific conditions are met
📈 Pyramiding Mechanism
New positions are automatically added as price decreases
Up to 10 positions can be added maximum
Each addition occurs at predetermined decline levels
Risk management through dynamic position sizing
💰 Profit and Loss Management
Take Profit: All positions close when the specified percentage above average cost is reached
Stop Loss (Optional): Protects a specified percentage of total capital
A certain ratio of available capital is used in each trade
📊 Visual Tracking System
The following information is displayed in real-time on the chart:
✅ Average cost level
✅ Profit target level
✅ Stop loss level (if active)
✅ Next pyramiding level
✅ Liquidation (capital reset) level
✅ Trend indicator
🛡️ Risk Management Features
1. Dynamic Capital Protection
Automatic exit when losses exceed a specified percentage of total capital
Complete loss scenario can be previewed through liquidation level calculation
2. Position Control System
Protection preventing multiple trades on the same bar
Double trigger prevention mechanism
Maximum position limit
3. Time Filter
Optional trading within a date range
Ideal for testing on historical data
📱 Information Panel
Information table always visible in the upper right corner of the strategy:
When Position is Open:
Number of active positions
Average cost
Current price
Total capital status
Capital loss percentage
Profit target
Stop loss level and distance
Next entry level
Liquidation level and distance
When No Position:
Market trend (Uptrend/Downtrend)
Ready to trade?
Reason for waiting
Initial position size
Target profit percentage
⚙️ Adjustable Parameters
Customizable by user:
💵 Capital Amount: Base amount to be used for each position
📊 Profit Target: Profit percentage at which to exit
🛑 Stop Loss: Usage status and maximum loss percentage
📅 Time Filter: Start and end dates for testing
💬 Trade Comments: Custom labels for each trade
📘 Understanding Leverage Effect
1. What is the Leverage Effect?
Although there's no real leverage in the spot market, when Capital Amount is increased, capital usage works like leverage:
Capital Amount 5% (1.0x): 100% capital usage with full pyramiding = All your money in trades
Capital Amount 10% (2.0x): 200% capital usage with full pyramiding = Attempting to open trades worth 2x your capital
Capital Amount 15% (3.0x): 300% capital usage with full pyramiding = Attempting to open trades worth 3x your capital
⚠️ IMPORTANT: If your capital runs out in the spot market, you cannot open new positions, therefore it's recommended to keep Capital Amount at 5% or below!
⚠️ Important Warnings
Pyramiding Risk: If price continues to decline, position grows and risk increases
Capital Requirements: Up to 10 positions can be added, requiring sufficient capital
Trend Dependency: Only works in uptrends
Backtest Results: Past performance is not a guarantee of future results
Real Trading Risks: Slippage, commissions, and market conditions can affect results
🎓 How to Use
Add the strategy to your chart
Adjust parameters according to your risk appetite
Examine past performance by backtesting
Optionally set up alerts to activate notifications
Test with paper trading first
This strategy is for educational purposes. Do your own research and only trade with capital you can afford to lose.
Disclaimer: This strategy is not financial advice. All investment decisions are the user's responsibility.
Happy trading! 📊

Ekoparaloji Strategy Crypto Ekoparaloji Crypto Strategy - User Information Document
📊 Strategy Overview
This strategy provides long-term position management in cryptocurrency markets using the averaging down (pyramiding) technique. The basic logic is to controllably grow positions as prices decline and exit when specific profit targets are reached.
🎯 Key Features
✅ Automatic Entry System
Market direction is determined using a proprietary trend identification algorithm
Trades are only opened in uptrends
Initial position opens automatically when specific conditions are met
📈 Pyramiding Mechanism
New positions are automatically added as price decreases
Up to 10 positions can be added maximum
Each addition occurs at predetermined decline levels
Risk management through dynamic position sizing
💰 Profit and Loss Management
Take Profit: All positions close when the specified percentage above average cost is reached
Stop Loss (Optional): Protects a specified percentage of total capital
A certain ratio of available capital is used in each trade
📊 Visual Tracking System
The following information is displayed in real-time on the chart:
✅ Average cost level
✅ Profit target level
✅ Stop loss level (if active)
✅ Next pyramiding level
✅ Liquidation (capital reset) level
✅ Trend indicator
🛡️ Risk Management Features
1. Dynamic Capital Protection
Automatic exit when losses exceed a specified percentage of total capital
Complete loss scenario can be previewed through liquidation level calculation
2. Position Control System
Protection preventing multiple trades on the same bar
Double trigger prevention mechanism
Maximum position limit
3. Time Filter
Optional trading within a date range
Ideal for testing on historical data
📱 Information Panel
Information table always visible in the upper right corner of the strategy:
When Position is Open:
Number of active positions
Average cost
Current price
Total capital status
Capital loss percentage
Profit target
Stop loss level and distance
Next entry level
Liquidation level and distance
When No Position:
Market trend (Uptrend/Downtrend)
Ready to trade?
Reason for waiting
Initial position size
Target profit percentage
⚙️ Adjustable Parameters
Customizable by user:
💵 Capital Amount: Base amount to be used for each position
📊 Profit Target: Profit percentage at which to exit
🛑 Stop Loss: Usage status and maximum loss percentage
📅 Time Filter: Start and end dates for testing
💬 Trade Comments: Custom labels for each trade
📘 Understanding Leverage Effect
1. What is the Leverage Effect?
Although there's no real leverage in the spot market, when Capital Amount is increased, capital usage works like leverage:
Capital Amount 5% (1.0x): 100% capital usage with full pyramiding = All your money in trades
Capital Amount 10% (2.0x): 200% capital usage with full pyramiding = Attempting to open trades worth 2x your capital
Capital Amount 15% (3.0x): 300% capital usage with full pyramiding = Attempting to open trades worth 3x your capital
⚠️ IMPORTANT: If your capital runs out in the spot market, you cannot open new positions, therefore it's recommended to keep Capital Amount at 5% or below!
⚠️ Important Warnings
Pyramiding Risk: If price continues to decline, position grows and risk increases
Capital Requirements: Up to 10 positions can be added, requiring sufficient capital
Trend Dependency: Only works in uptrends
Backtest Results: Past performance is not a guarantee of future results
Real Trading Risks: Slippage, commissions, and market conditions can affect results
🎓 How to Use
Add the strategy to your chart
Adjust parameters according to your risk appetite
Examine past performance by backtesting
Optionally set up alerts to activate notifications
Test with paper trading first
This strategy is for educational purposes. Do your own research and only trade with capital you can afford to lose.
Disclaimer: This strategy is not financial advice. All investment decisions are the user's responsibility.

LW Outside Day Strategy[SpeculationLab]This strategy is inspired by the “Outside Day” concept introduced by Larry Williams in Long-Term Secrets to Short-Term Trading, and has been extended with configurable risk management tools and realistic backtesting parameters.
Concept
The “Outside Day” is a classic price action pattern that reflects strong market rejection or continuation pressure.
An Outside Bar occurs when the current bar’s high exceeds the previous high and the low falls below the previous low.
A body-size filter ensures only significant candles are included.
Entry Logic
Buy setup: Price closes below the previous low (bullish rejection).
Sell setup: Price closes above the previous high (bearish rejection).
Only confirmed bars are used (no intrabar signals).
Stop-Loss Modes
Prev Low/High: Uses the previous swing point ± ATR-based buffer.
ATR: Dynamic stop based on Average True Range × multiplier.
Fixed Pips: User-defined fixed distance (for forex testing).
Take-Profit Modes
Prev High/Low (PHL): Exits near the opposite swing.
Risk-Reward (RR): Targets a user-defined multiple of the stop distance (default = 2 : 1).
Following Price Open (FPO): Exits on the next bar’s open if price opens in profit (used to test overnight price continuation).
Risk Management & Backtest Settings
Default risk per trade is set at 10% of account equity (user-adjustable).
Commission = 0.1% and slippage = 2 ticks are applied to simulate realistic conditions.
For reliable statistics, test on data that yields over 100 trades.
Suitable for daily and 4-hour timeframes across stocks, forex, and crypto markets.
Visual Elements
Green and red triangles show entry signals.
Stop-loss (red) and take-profit (green) reference lines are drawn for clarity.
Optional alerts notify when a valid setup forms.
Disclaimer
This script is for educational and research purposes only.
It does not constitute financial advice or guarantee profits.
Always backtest thoroughly and manage your own risk.
Enhancements over Classic Outside Bar Models
Adjustable stop and target logic with ATR and buffer multipliers.
“Following Price Open” exit logic for realistic day-end management.
Optimized to avoid repainting and bar-confirmation issues.
Built with realistic trading costs and position sizing.
策略逻辑
外包线识别
当日最高价高于前一日最高价,且当日最低价低于前一日最低价,即形成外包线。
同时过滤掉较小实体的 K 线,仅保留实体显著大于前一根的形态。
方向过滤
收盘价低于前一日最低价 → 视为买入信号。
收盘价高于前一日最高价 → 视为卖出信号。
止损设置(可选参数)
前低/高止损:以形态前低/前高为止损,带有缓冲倍数。
ATR 止损:根据平均波动率(ATR)动态调整。
固定点数止损:按照用户设定的点数作为止损范围。
止盈设置(可选参数)
前高/低止盈(PHL):以前高/前低为目标。
固定盈亏比(RR):根据用户设定的风险回报比自动计算。
隔夜开盘(FPO):若次日开盘价高于进场价(多单)或低于进场价(空单),则平仓。
信号标记
在图表中标注买入/卖出信号(三角形标记)。
绘制止损与目标位参考线。
使用说明
适用周期:建议用于 日线图(Daily)。
适用市场:股票、外汇、加密货币等各类市场均可。
提示:此策略为历史研究与学习用途,不构成投资建议。实际交易请结合自身风险管理。

DCA with the Money Supply Index DCA with the Money Supply Index (MSI) by zdmre
This strategy is based on the Money Supply Index (MSI) by zdmre and enhances it with two functional options for users: a DCA (Dollar-Cost Averaging) approach and a signal-based buy/sell mode. It’s designed to help traders and investors make data-driven, disciplined entry decisions based on monetary supply trends.
🧠 Concept Overview
The Money Supply Index (MSI) provides insight into how liquidity (money supply) influences market movements. This strategy builds upon that foundation by allowing users to either:
Accumulate positions over time using DCA, based on favorable MSI conditions.
Execute a single buy and sell trade, optimized for bull market conditions.
⚙️ Inputs Explained
General Parameters
Start Bar Index / Stop Bar Index
Defines the range of bars (historical data) for backtesting or strategy visualization.
Long DCA
Activates the DCA mode. If unchecked, the strategy operates in single-entry/single-exit signal mode.
Trading Signal
Enables signal-based entries and exits when the MSI reaches predefined thresholds.
DCA Parameters
Entry Value
The MSI value that triggers a DCA buy event. When the MSI crosses below this value, the strategy considers it a favorable moment to deploy the saved capital.
Saved Amount
The amount of money set aside regularly (e.g., monthly) for investment. This simulates the DCA effect by accumulating capital and deploying it when conditions are optimal.
Data Inputs
Money Supply
The data source for the Money Supply Index (default: ECONOMICS:USM2).
Relational Symbol
The market instrument to compare against the money supply (default: NASDAQ_DLY:NDX). This allows the strategy to measure liquidity impact on a specific market.
Chart Display Options
You can toggle these metrics on the chart for better visualization:
Entry Price (green) – The price level of executed buys.
Cash Balance (yellow) – Remaining uninvested capital.
Invested Capital (red) – Total amount currently invested.
Current Value (blue) – The current valuation of the investment.
Profit (purple) – The total realized and unrealized profit.
Trades on Chart / Signal Labels / Quantity – Enables trade markers, signal text, and position size visualization.
📈 How the Strategy Works
1️⃣ DCA Mode
In DCA mode, the strategy simulates periodic savings and only invests when the MSI indicates favorable liquidity conditions (based on the Entry Value).
This approach aims to achieve the best possible average entry price over time — a powerful strategy for long-term investors seeking stable accumulation with reduced emotional bias.
2️⃣ Signal-Based Mode
In signal mode (with DCA disabled), the strategy performs one buy and one sell trade based on MSI turning points.
It’s most effective during bull markets, where liquidity expansion supports upward momentum.
This mode helps identify high-probability entry and exit zones rather than averaging in continuously.
💡 Additional Notes
This strategy includes helpful metrics to monitor your personal investment performance — showing invested capital, cash reserves, and profit in real-time.
The goal is to combine macroeconomic insight (money supply) with disciplined execution and capital management.
⚠️ Disclaimer
This strategy is for educational and research purposes only. It does not constitute financial advice. Always conduct your own analysis before making investment decisions.

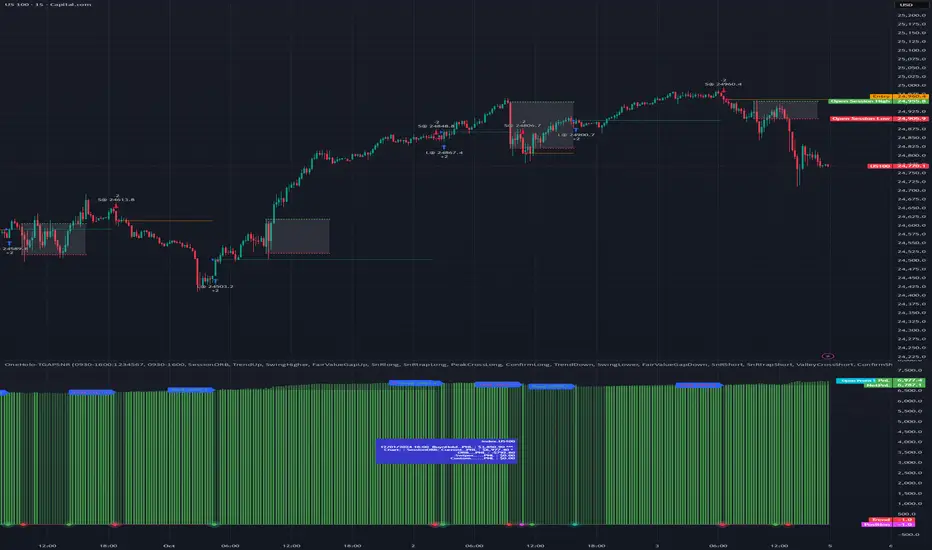
OneHolo-TGAPSNRTGAPSNR: Multi time frame - Trend Gap Stop And Reverse strategy/Study PnL. This script outlines a systematic approach to generating buy and sell signals by combining Fair Value Gaps (FVGs), specific market structures, and three different trend direction methods (Swing, Gravity, and FVG Inverse direction). The strategy incorporates multiple entry modes, such as Hyper Mode, Swiper Mode, and a Custom mode, allowing users to tailor signal conditions, alongside extensive logic for trade management, higher time frame analysis, and various visual indicators for plotting trend, pivots, and profit and loss information.
I. Core Trend Direction Consensus (The Three-Pillar System)
The primary method for determining market bias is a three-pillar consensus model, requiring all directional methods to align before the overall Trend Direction is established (up or down). This ensures high conviction for trend signals.
• Pillar 1: Swing Direction: Determines market direction based on classic price action, specifically checking for continuous higher highs and higher lows for an upward bias, or lower lows and lower highs for a downward bias.
• Pillar 2: Gravity Direction (Peak and Valley): This uses specific market structure pivots. Direction is set based on whether the close price successfully crosses the established recent Peak High (indicating upward momentum) or crosses under the recent Valley Low (indicating downward pressure).
• Pillar 3: FVG Inverse Direction: This relies on Fair Value Gaps (FVGs), defined as a gap between the current bar's price and the price two bars prior. Direction shifts occur when the Close price crosses the midpoint of the last relevant FVG. For instance, crossing above the midpoint of the last FVG Down signals a potential inverse long trade.
II. Flexible Signal Generation Modes
The strategy offers several pre-configured and highly detailed entry modes, plus a powerful Custom Mode:
• Session Open Range Break (ORB) Mode: Uses the high/low of the session's first bar to generate initial signals, then defaults to the Three-Pillar Trend Direction after the ORB session concludes.
• Swiper Mode: Designed to identify continuations, combining a confirmed Trend Direction with a Stop and Reverse signal (SnR) while actively avoiding confirmed pivot breaks.
• Hyper/Aggressive Modes: These modes use broad combinations of signals, allowing for earlier entry based on momentum and structural breaks (like PeakCrossLong, SnRtrapLong, or FVG signals).
• Custom Query Mode (The Seven-Slot Logic): This non-redundant system allows the user to define complex, tailored entry conditions by selecting any combination of 14 core patterns across seven distinct slots.
◦ AND/OR Combination: For each of the seven slots, the user determines if the chosen pattern must be met (AND component) or if it can serve as an alternative trigger (OR component).
◦ The final signal requires that all configured AND conditions are true and then integrates the result of the OR conditions, allowing for highly specific "hook queries" (e.g., "Condition A AND Condition B, OR Condition C").
III. Advanced PnL and Mobile App Diagnostics
A key proprietary element is the implementation of a dual PnL system and customized visualization features:
• Dual PnL Display (Strategy PnL vs. Study PnL): Users can choose to view either the native platform's strategy performance data or the script's internal, proprietary Study PnL. The Study PnL calculates profits/losses based strictly on the close price and tracks performance using Pine Script® arrays, providing a transparent, diagnostic view of performance independent of broker/platform simulation biases.
• Lower Panel Visualization: Both PnL types are displayed on the lower panel using detailed bar plots (style=plot.style_columns), which color according to profitability, and include labels that show current open profit and total net profit.
• Detailed Trade Labels: The script generates detailed, customizable labels on both the chart (above/below bars) and the lower PnL panel, providing historical PnL, number of trades, and real-time profit information for each entry or exit.
IV. Higher Time Frame (HTF) Context and Lookahead Prevention
The strategy integrates multi-time frame analysis using strict methodology to prevent lookahead bias:
• HTF Bias Filtering: When enabled, the strategy uses the position calculated on a user-defined higher time frame (HTF) as a mandatory filter. A long signal on the current chart is only executed if the HTF is also in a long position, and vice-versa.
• Lookahead Prevention: To maintain integrity, all HTF data requests use a mandatory lookback index (often ) to ensure the script only accesses confirmed data from the prior completed bar on the higher timeframe.
• HTF Visual Mode: The user can opt to display key structural elements—such as the Gravity Pivots and the Trend Direction blocks—as calculated on the HTF, overlaying this higher-level context onto the current chart for visual analysis.
The TGAPSNR: Multi time frame - Trend Gap Stop And Reverse strategy/Study PnL script, despite its complexity, intentionally excludes realistic considerations such as fees, slippage, and explicit risk management settings (like fixed stop-loss or take-profit rules) from its primary logic.
Here is an explanation of why these elements are omitted in the strategy's current implementation and why they must be applied by the user for real-world application, drawing on the context of the sources:
1. Absence of Realistic Fees, Commissions, and Slippage
The primary function of the TGAPSNR script is to execute intricate signal generation and diagnostic PnL calculation based on its three-pillar trend system and Custom Mode logic.
However, the strategy's backtesting results, particularly those displayed by the internal Study PnL feature, are based purely on price difference (e.g., (close - lse) * syminfo.pointvalue * IUnits).
• Strategy Result Requirements: TradingView explicitly states that strategies published publicly should strive to use realistic commission AND slippage when calculating backtesting results to avoid misleading traders.
• User Responsibility: Since the script currently focuses on signal integrity and uses a fixed contract size (IUnits = 1) without configurable commission/slippage inputs shown in the source, the user must manually configure these fees within the Pine Script® Strategy Tester settings (Properties tab) to ensure the strategy results are reflective of actual trading costs.
2. Omission of Built-in Risk Management (Stop-Loss and Take-Profit)
The TGAPSNR strategy's core focuses on entry signals and trend confirmation. Exits are primarily governed by:
• Reversal signals (BuyStop or SellStop).
• End-of-Day (EOD) session closures (EODStop).
• HTF bias opposition.
What is Missing: The script does not include explicit, hard-coded risk management parameters for traditional stop-loss (SL) or take-profit (TP) levels (e.g., risk percentage or ATR-based exits).
• Viable Risk: TradingView guidelines stipulate that strategies should generally risk sustainable amounts of equity, usually not exceeding 5-10% on a single trade, and trade size must be appropriate.
• User Application: To ensure the strategy operates within realistic risk boundaries, users must apply their own risk management rules. This includes:
◦ Implementing realistic stops and profit targets, which can be added via Pine Script® code or manually managed during live trading.
◦ Sizing trades to only risk sustainable amounts of equity. The current default unit size (IUnits = 1) is unrealistic for risk assessment unless the symbol is micro-sized.
3. Execution Quality (Fills)
The strategy is set to fill_orders_on_standard_ohlc = true and operates on confirmed bar closes (barstate.isconfirmed).
• Fill Assumption: This suggests the strategy primarily uses close price or the HTF close price (EntryPrice = HTFClose) for execution.
• Real-World Limitation: In volatile markets, obtaining a fill price equal to the close of the bar is rare. The user must be aware that the simulated fill price shown in backtesting may differ significantly from actual execution prices due to market action and chosen order type, reinforcing the importance of applying slippage settings.
In summary, while the script provides highly detailed and unique signal generation and internal PnL diagnostics, users must exercise caution and apply their own realistic parameters for fees, slippage, and explicit risk controls to prevent misleading performance results and ensure viable trading
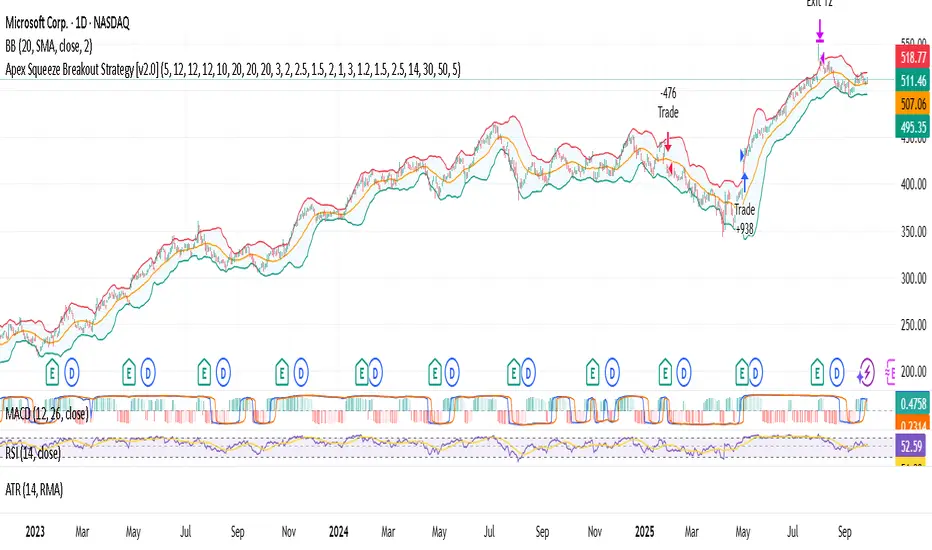
Apex Squeeze Breakout Strategy (v1.0 by SKC)The Apex Squeeze Breakout Strategy is a powerful momentum-based system designed to capture explosive price moves following periods of low volatility compression (squeeze). It combines five key conditions to validate high-probability breakouts:
🔵 TTM Squeeze Detection using Bollinger Bands and Keltner Channels
🔊 Volume Spike Confirmation relative to a moving average
📈 Breakout Trigger above/below a recent high/low range
💪 Momentum Acceleration using percentage change over time
♻️ RSI Recovery / Overbought Logic to confirm shift in strength
The strategy includes:
Configurable swing/day trading modes
Dynamic ATR-based Stop Loss and TP1/TP2 system
Modular input structure for easy customization
Clear entry/exit visual markers and trade zones
It’s designed for disciplined traders who want to catch high-energy moves after consolidation, suitable for both intraday and swing setups.
Order Block Volumatic FVG StrategyInspired by: Volumatic Fair Value Gaps —
License: CC BY-NC-SA 4.0 (Creative Commons Attribution–NonCommercial–ShareAlike).
This script is a non-commercial derivative work that credits the original author and keeps the same license.
What this strategy does
This turns BigBeluga’s visual FVG concept into an entry/exit strategy. It scans bullish and bearish FVG boxes, measures how deep price has mitigated into a box (as a percentage), and opens a long/short when your mitigation threshold and filters are satisfied. Risk is managed with a fixed Stop Loss % and a Trailing Stop that activates only after a user-defined profit trigger.
Additions vs. the original indicator
✅ Strategy entries based on % mitigation into FVGs (long/short).
✅ Lower-TF volume split using upticks/downticks; fallback if LTF data is missing (distributes prior bar volume by close’s position in its H–L range) to avoid NaN/0.
✅ Per-FVG total volume filter (min/max) so you can skip weak boxes.
✅ Age filter (min bars since the FVG was created) to avoid fresh/immature boxes.
✅ Bull% / Bear% share filter (the 46%/53% numbers you see inside each FVG).
✅ Optional candle confirmation and cooldown between trades.
✅ Risk management: fixed SL % + Trailing Stop with a profit trigger (doesn’t trail until your trigger is reached).
✅ Pine v6 safety: no unsupported args, no indexof/clamp/when, reverse-index deletes, guards against zero/NaN.
How a trade is decided (logic overview)
Detect FVGs (same rules as the original visual logic).
For each FVG currently intersected by the bar, compute:
Mitigation % (how deep price has entered the box).
Bull%/Bear% split (internal volume share).
Total volume (printed on the box) from LTF aggregation or fallback.
Age (bars) since the box was created.
Apply your filters:
Mitigation ≥ Long/Short threshold.
Volume between your min and max (if enabled).
Age ≥ min bars (if enabled).
Bull% / Bear% within your limits (if enabled).
(Optional) the current candle must be in trade direction (confirm).
If multiple FVGs qualify on the same bar, the strategy uses the most recent one.
Enter long/short (no pyramiding).
Exit with:
Fixed Stop Loss %, and
Trailing Stop that only starts after price reaches your profit trigger %.
Input settings (quick guide)
Mitigation source: close or high/low. Use high/low for intrabar touches; close is stricter.
Mitigation % thresholds: minimal mitigation for Long and Short.
TOTAL Volume filter: skip FVGs with too little/too much total volume (per box).
Bull/Bear share filter: require, e.g., Long only if Bull% ≥ 50; avoid Short when Bull% is high (Short Bull% max).
Age filter (bars): e.g., ≥ 20–30 bars to avoid fresh boxes.
Confirm candle: require candle direction to match the trade.
Cooldown (bars): minimum bars between entries.
Risk:
Stop Loss % (fixed from entry price).
Activate trailing at +% profit (the trigger).
Trailing distance % (the trailing gap once active).
Lower-TF aggregation:
Auto: TF/Divisor → picks 1/3/5m automatically.
Fixed: choose 1/3/5/15m explicitly.
If LTF can’t be fetched, fallback allocates prior bar’s volume by its close position in the bar’s H–L.
Suggested starting presets (you should optimize per market)
Mitigation: 60–80% for both Long/Short.
Bull/Bear share:
Long: Bull% ≥ 50–70, Bear% ≤ 100.
Short: Bull% ≤ 60 (avoid shorting into strong support), Bear% ≥ 0–70 as you prefer.
Age: ≥ 20–30 bars.
Volume: pick a min that filters noise for your symbol/timeframe.
Risk: SL 4–6%, trailing trigger 1–2%, distance 1–2% (crypto example).
Set slippage/fees in Strategy Properties.
Notes, limitations & best practices
Data differences: The LTF split uses request.security_lower_tf. If the exchange/data feed has sparse LTF data, the fallback kicks in (it’s deliberate to avoid NaNs but is a heuristic).
Real-time vs backtest: The current bar can update until close; results on historical bars use closed data. Use “Bar Replay” to understand intrabar effects.
No pyramiding: Only one position at a time. Modify pyramiding in the header if you need scaling.
Assets: For spot/crypto, TradingView “volume” is exchange volume; in some markets it may be tick volume—interpret filters accordingly.
Risk disclosure: Past performance ≠ future results. Use appropriate position sizing and risk controls; this is not financial advice.
Credits
Visual FVG concept and original implementation: BigBeluga.
This derivative strategy adds entry/exit logic, volume/age/share filters, robust LTF handling, and risk management while preserving the original spirit.
License remains CC BY-NC-SA 4.0 (non-commercial, attribution required, share-alike).

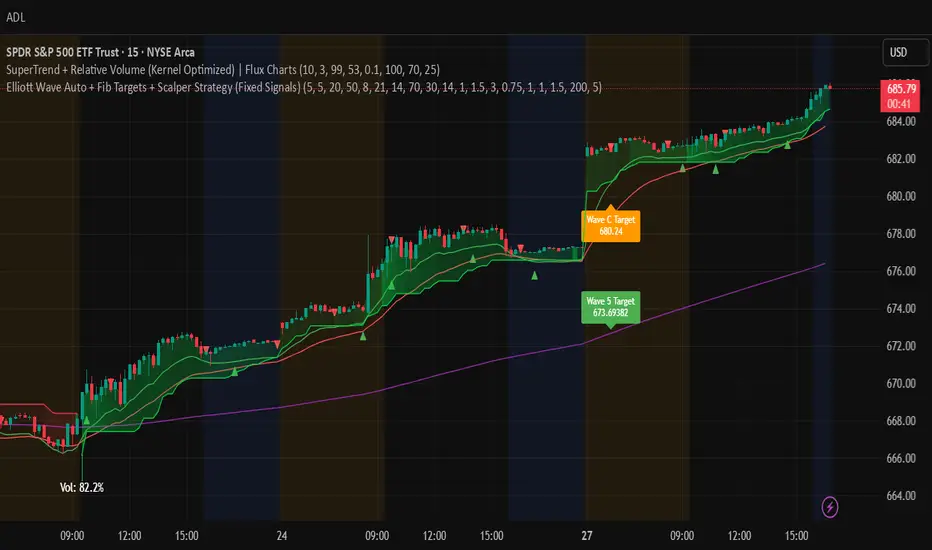
Elliott Wave Auto + Fib Targets + Scalper Strategy (Fixed)// Elliott Wave Auto + Fib Targets + Scalper Strategy
//
// Fixed by expert trader:
// - Replaced table with label-based visualization to avoid 'Column 2 is out of table bounds' error.
// - Uses label.new to display buy/sell signal counts in top-right corner, mimicking table layout.
// - Fixed array.sum() error: Replaced invalid range-based array.sum() with custom sum_array_range() function.
// - Removed barstate usage to fix 'Undeclared identifier barstate' error.
// - Replaced barstate.isconfirmed with true (process every bar).
// - Replaced barstate.isfirstconfirmed with bar_index == 0 (first bar).
// - Replaced strategy.alert with label.new for long/short entry signals (buy/sell markers).
// - Fixed array index out-of-bounds: Protected array.get() calls with size checks.
// - Fixed pyramiding: Set constant pyramiding=4 (max 5 entries); use allow_pyramiding to limit entries.
// - Fixed default_qty_value: Set constant default_qty_value=100.0; use entry_size_pct to scale qty.
// - Replaced alertcondition with labels for Elliott Wave patterns.
// - Fixed partial exits: 50% at TP1 with fixed SL, 50% at TP2 with fixed SL or trailing.
// - Fixed Elliott Wave pivot indexing for alternating H/L check.
// - Ensured proper position sizing and exit logic.
The Best Strategy Template[LuciTech]Hello Traders,
This is a powerful and flexible strategy template designed to help you create, backtest, and deploy your own custom trading strategies. This template is not a ready-to-use strategy but a framework that simplifies the development process by providing a wide range of pre-built features and functionalities.
What It Does
The LuciTech Strategy Template provides a robust foundation for building your own automated trading strategies. It includes a comprehensive set of features that are essential for any serious trading strategy, allowing you to focus on your unique trading logic without having to code everything from scratch.
Key Features
The LuciTech Strategy Template integrates several powerful features to enhance your strategy development:
•
Advanced Risk Management: This includes robust controls for defining your Risk Percentage per Trade, setting a precise Risk-to-Reward Ratio, and implementing an intelligent Breakeven Stop-Loss mechanism that automatically adjusts your stop to the entry price once a specified profit threshold is reached. These elements are crucial for capital preservation and consistent profitability.
•
Flexible Stop-Loss Options: The template offers adaptable stop-loss calculation methods, allowing you to choose between ATR-Based Stop-Loss, which dynamically adjusts to market volatility, and Candle-Based Stop-Loss, which uses structural price points from previous candles. This flexibility ensures the stop-loss strategy aligns with diverse trading styles.
•
Time-Based Filtering: Optimize your strategy's performance by restricting trading activity to specific hours of the day. This feature allows you to avoid unfavorable market conditions or focus on periods of higher liquidity and volatility relevant to your strategy.
•
Customizable Webhook Alerts: Stay informed with advanced notification capabilities. The template supports sending detailed webhook alerts in various JSON formats (Standard, Telegram, Concise Telegram) to external platforms, facilitating real-time monitoring and potential integration with automated trading systems.
•
Comprehensive Visual Customization: Enhance your analytical clarity with extensive visual options. You can customize the colors of entry, stop-loss, and take-profit lines, and effectively visualize market inefficiencies by displaying and customizing Fair Value Gap (FVG) boxes directly on your chart.
How It Does It
The LuciTech Strategy Template is meticulously crafted using Pine Script, TradingView's powerful and expressive programming language. The underlying architecture is designed for clarity and modularity, allowing for straightforward integration of your unique trading signals. At its core, the template operates by taking user-defined entry and exit conditions and then applying a sophisticated layer of risk management, position sizing, and trade execution logic.
For instance, when a longCondition or shortCondition is met, the template dynamically calculates the appropriate position size. This calculation is based on your specified risk_percent of equity and the stop_distance (the distance between your entry price and the calculated stop-loss level). This ensures that each trade adheres to your predefined risk parameters, a critical component of disciplined trading.
The flexibility in stop-loss calculation is achieved through a switch statement that evaluates the sl_type input. Whether you choose an ATR-based stop, which adapts to market volatility, or a candle-based stop, which uses structural price points, the template seamlessly integrates these methods. The ATR calculation itself is further refined by allowing various smoothing methods (RMA, SMA, EMA, WMA), providing granular control over how volatility is measured.
Time-based filtering is implemented by comparing the current bar's time with user-defined start_hour, start_minute, end_hour, and end_minute inputs. This allows the strategy to activate or deactivate trading during specific market sessions or periods of the day, a valuable tool for optimizing performance and avoiding unfavorable conditions.
Furthermore, the template incorporates advanced webhook alert functionality. When a trade is executed, a customizable JSON message is formatted based on your webhook_format selection (Standard, Telegram, or Concise Telegram) and sent via alert function. This enables seamless integration with external services for real-time notifications or even automated trade execution through third-party platforms.
Visual feedback is paramount for understanding strategy behavior. The template utilizes plot and fill functions to clearly display entry prices, stop-loss levels, and take-profit targets directly on the chart. Customizable colors for these elements, along with dedicated options for Fair Value Gap (FVG) boxes, enhance the visual analysis during backtesting and live trading, making it easier to interpret the strategy's actions.
How It's Original
The LuciTech Strategy Template distinguishes itself in the crowded landscape of TradingView scripts through its unique combination of integrated, advanced risk management features, highly flexible stop-loss methodologies, and sophisticated alerting capabilities, all within a user-friendly and modular framework. While many templates offer basic entry/exit signal integration, LuciTech goes several steps further by providing a robust, ready-to-use infrastructure for managing the entire trade lifecycle once a signal is generated.
Unlike templates that might require users to piece together various risk management components or code complex stop-loss logic from scratch, LuciTech offers these critical functionalities out-of-the-box. The inclusion of dynamic position sizing based on a user-defined risk percentage, a configurable risk-to-reward ratio, and an intelligent breakeven mechanism significantly elevates its utility. This comprehensive approach to capital preservation and profit targeting is a cornerstone of professional trading and is often overlooked or simplified in generic templates.
Furthermore, the template's provision for multiple stop-loss calculation types—ATR-based for volatility adaptation, and candle-based for structural support/resistance—demonstrates a deep understanding of diverse trading strategies. The underlying code for these calculations is already implemented, saving developers considerable time and effort. The subtle yet powerful inclusion of FVG (Fair Value Gap) related inputs also hints at advanced price action concepts, offering a sophisticated layer of analysis and execution that is not commonly found in general-purpose templates.
The advanced webhook alerting system, with its support for various JSON formats tailored for platforms like Telegram, showcases an originality in catering to the needs of modern, automated trading setups. This moves beyond simple TradingView pop-up alerts, enabling seamless integration with external systems for real-time trade monitoring and execution. This level of external connectivity and customizable data output is a significant differentiator.
In essence, the LuciTech Strategy Template is original not just in its individual features, but in how these features are cohesively integrated to form a powerful, opinionated, yet highly adaptable system. It empowers traders to focus their creative energy on developing their core entry/exit signals, confident that the underlying framework will handle the complexities of risk management, trade execution, and external communication with precision and flexibility. It's a comprehensive solution designed to accelerate the development of robust and professional trading strategies.
How to Modify the Logic to Apply Your Strategy
The LuciTech Strategy Template is designed with modularity in mind, making it exceptionally straightforward to integrate your unique trading strategy logic. The template provides a clear separation between the core strategy management (risk, position sizing, exits) and the entry signal generation. This allows you to easily plug in your own buy and sell conditions without altering the robust underlying framework.
Here’s a step-by-step guide on how to adapt the template to your specific trading strategy:
1.
Locate the Strategy Logic Section:
Open the Pine Script editor in TradingView and navigate to the section clearly marked with the comment //Strategy Logic Example:. This is where the template’s placeholder entry conditions (a simple moving average crossover) are defined.
2.
Define Your Custom Entry Conditions:
Within this section, you will find variables such as longCondition and shortCondition. These are boolean variables that determine when a long or short trade should be initiated. Replace the existing example logic with your own custom buy and sell conditions. Your conditions can be based on any combination of indicators, price action patterns, candlestick formations, or other market analysis techniques. For example, if your strategy involves a combination of RSI and MACD, you would define longCondition as (rsi > 50 and macd_line > signal_line) and shortCondition as (rsi < 50 and macd_line < signal_line).
3.
Leverage the Template’s Built-in Features:
Once your longCondition and shortCondition are defined, the rest of the template automatically takes over. The integrated risk management module will calculate the appropriate position size based on your Risk % input and the chosen Stop Loss Type. The Risk:Reward ratio will determine your take-profit levels, and the Breakeven at R feature will manage your stop-loss dynamically. The time filter (Use Time Filter) will ensure your trades only occur within your specified hours, and the webhook alerts will notify you of trade executions.

Nirvana True Duel전략 이름
열반의 진검승부 (영문: Nirvana True Duel)
컨셉과 철학
“열반의 진검승부”는 시장 소음은 무시하고, 확실할 때만 진입하는 전략입니다.
EMA 리본으로 추세 방향을 확인하고, 볼린저 밴드 수축/확장으로 변동성 돌파를 포착하며, OBV로 거래량 확인을 통해 가짜 돌파를 필터링합니다.
전략 로직
매수 조건 (롱)
20EMA > 50EMA (상승 추세)
밴드폭 수축 후 확장 시작
종가가 상단 밴드 돌파
OBV 상승 흐름 유지
매도 조건 (숏)
20EMA < 50EMA (하락 추세)
밴드폭 수축 후 확장 시작
종가가 하단 밴드 이탈
OBV 하락 흐름 유지
진입·청산
손절: ATR × 1.5 배수
익절: 손절폭의 1.5~2배에서 부분 청산
시간 청산: 설정한 최대 보유 봉수 초과 시 강제 청산
장점
✅ 추세·변동성·거래량 3중 필터 → 노이즈 최소화
✅ 백테스트·알람 지원 → 기계적 매매 가능
✅ 5분/15분 차트에 적합 → 단타/스윙 트레이딩 활용 가능
주의점
⚠ 횡보장에서는 신호가 적거나 실패 가능
⚠ 수수료·슬리피지 고려 필요
📜 Nirvana True Duel — Strategy Description (English)
Name:
Nirvana True Duel (a.k.a. Nirvana Cross)
Concept & Philosophy
The “Nirvana True Duel” strategy focuses on trading only meaningful breakouts and avoiding unnecessary noise.
Nirvana: A calm, patient state — waiting for the right opportunity without emotional trading.
True Duel: When the signal appears, enter decisively and let the market reveal the outcome.
In short: “Ignore market noise, trade only high-probability breakouts.”
🧩 Strategy Components
Trend Filter (EMA Ribbon): Stay aligned with the main market trend.
Volatility Squeeze (Bollinger Band): Detect volatility contraction & expansion to catch explosive moves early.
Volume Confirmation (OBV): Filter out false breakouts by confirming with volume flow.
⚔️ Entry & Exit Conditions
Long Setup:
20 EMA > 50 EMA (uptrend)
BB width breaks out from recent squeeze
Close > Upper Bollinger Band
OBV shows positive flow
Short Setup:
20 EMA < 50 EMA (downtrend)
BB width breaks out from recent squeeze
Close < Lower Bollinger Band
OBV shows negative flow
Risk Management:
Stop Loss: ATR × 1.5 below/above entry
Take Profit: 1.5–2× stop distance, partial take-profit allowed
Time Stop: Automatically closes after max bars held (e.g. 8h on 5m chart)
✅ Strengths
Triple Filtering: Trend + Volatility + Volume → fewer false signals
Mechanical & Backtestable: Ideal for objective trading & performance validation
Adaptable: Works well on Bitcoin, Nasdaq futures, and other high-volatility markets (5m/15m)
⚠️ Things to Note
Low signal frequency or higher failure rate in sideways/range markets
Commission & slippage should be factored in, especially on lower timeframes
ATR multiplier and R:R ratio should be optimized per asset
