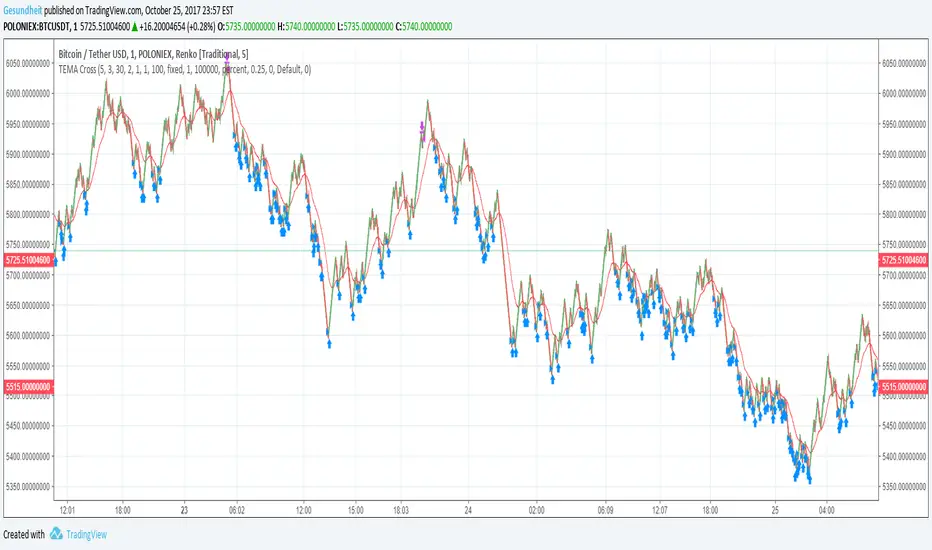
TEMA Cross on Renko CandlesRenko candles filter out noise by plotting a fixed change in price rather than a fixed time frame.
Strategies like MACD or MA cross can give a lot of false signals when the price is wavy, but not actually going anywhere. This is especially a problem with small time frames.
Since it's so easy to identify trends on a Renko plot, this strategy uses a simple moving average cross idea. Instead of an EMA, we use a TEMA ( triple exponential moving average ) because that version does not lag as much.
We also will avoid buying when the price is above a longer-term smoothed moving average. This means we will hopefully reduce bags, but we will also miss some trades.
Also included are
avg_protection -- if >0 only buy when it will bring down our average price, else buy whenever the TEMA crosses over the short-term SMA
gain_protection -- if >0 only sell when we meet out min_gain %, otherwise sell whenever TEMA crosses under the short-term SMA
I've been setting my Renko candles to a fixed range instead of ATR, and I use increments of roughly 0.1% in the example chart.
Search in scripts for "renko"
Renko EMA SystemMeant for Renko charts
Applies either an EMA and HMA to your renko charts
When prices crosses the slower, it enters you into position.
When price crosses the faster, it exits your position.
Meant to catch impulsive moves.


Renko Average Bricks This indicator calculates the average RENKO brick streaks. Streaks=consecutive bricks of the same color. EX. G= 1 streak of 1. GGG = 1 streak of 3. RR 1 streak of 2. Single bricks count. There is the option for look back period which can be changed but Defaults to 50. Calculates the last 50 completed green streaks and then averages them. Same with red streaks. Only closed bricks count.
Very Simple and can be used for targets, ect.
Cheers

Renko Entry Alerts Limit +0.08Simple renko 1 block reversal strategy Adds +0.08 to 1 block during pre a=market and after hours for more successful fills.

Renko WPR Color ChangerChanges color when williams percent R is between 0 and -20 or when between -80 and -100. Works with renko, HA and regular candles. Can change color.

Renko XZThis is a renko based indicator
I just made it no repaint type. also the signals are based on max and min trend of the high ad low
alerts are included
you can control it by ATR size or better by multiplayer similar to super trend by logic
HTF control brick size but they are not important design by non security MTF

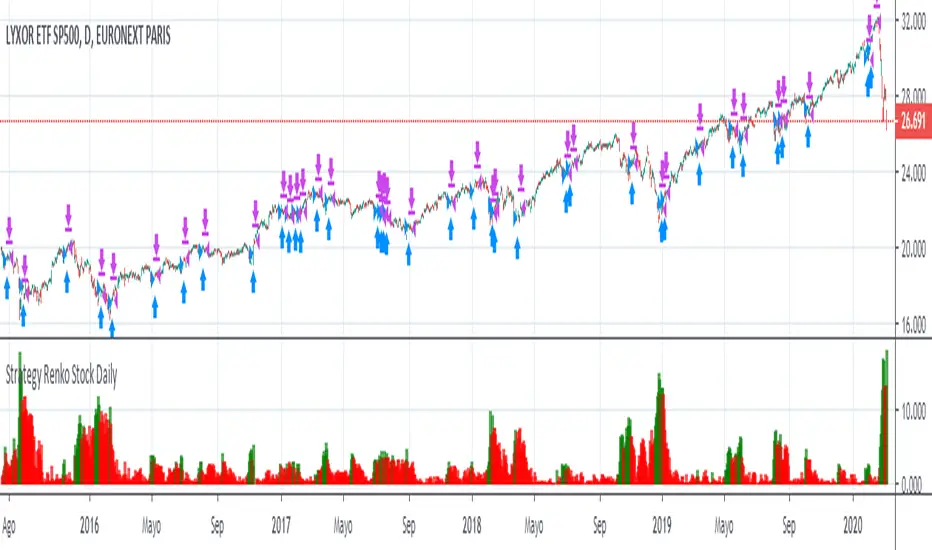
Renko Stock DailyHello,
This strategy must be use only for stocks. It doesnt work with FOREX or others..
You must use it only for renko candles
Best regards


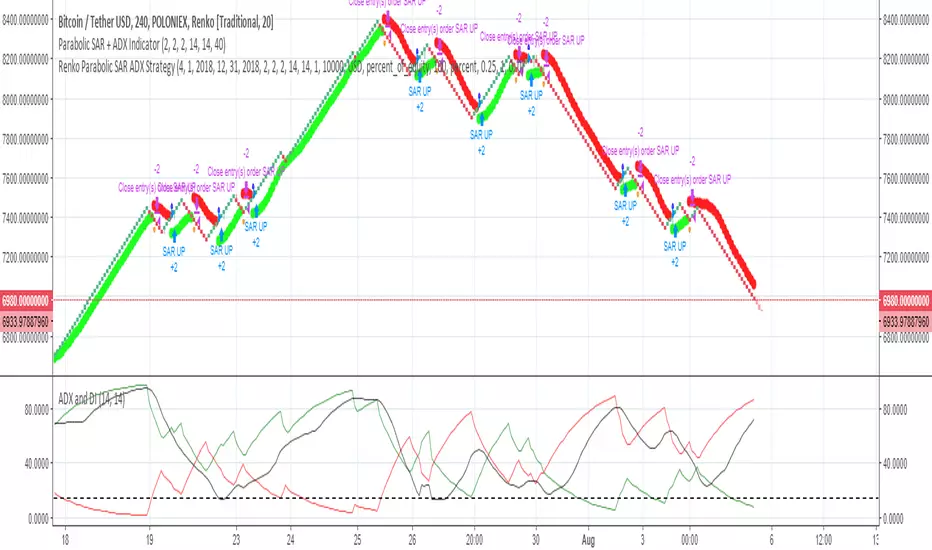
Renko Parabolic SAR + ADX Indicator (Need help on the alert)//This script is made using scripts by other authors. All credit goes to them. I am only copying snippets and making it work for me//
Problem Statement:
The script seems to work best using a fixed renko brick. The indicators do work but I have problems with the alert.
What often happens is, the signal appears (condition is met) BRIEFLY as the bar forms, it disappears a few seconds later, but the alert is still sent on the close of the bar.
I wish to receive these alerts on the close of a bar only if the condition is still met on the close of the bar
I am hoping someone can guide or fix the alertcondition such that it checks for the firmed signal before triggering the alert.
POLONIEX:BTCUSDT
Renko with custom sourceThe script allows you to set custom date source for Renko chart through Format dialog.

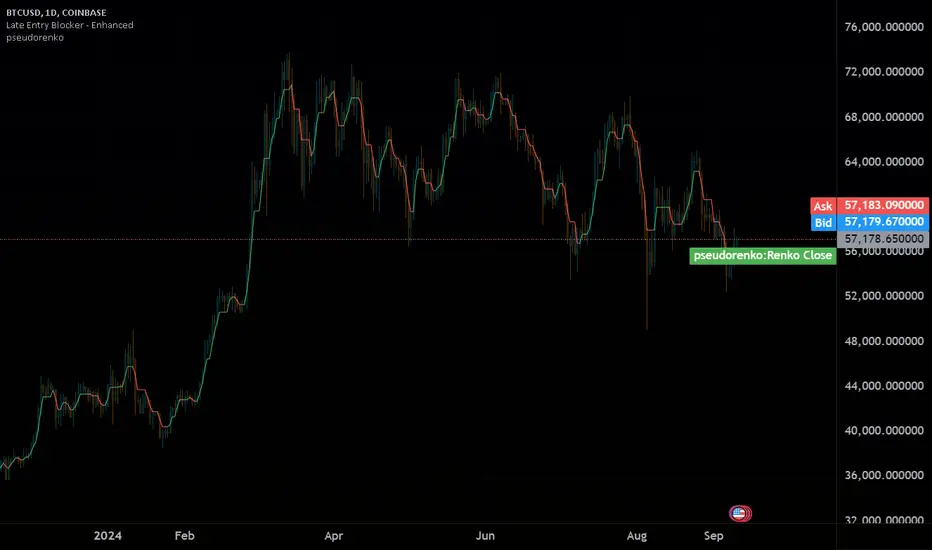
pseudorenko█ CALCULATE PSEUDO-RENKO VALUE
Calculates and returns the Pseudo-Renko Stabilized value (or close price) based on a given input value, along with the direction of the current Renko brick. This function adapts the traditional Renko brick size dynamically based on the volatility of the input value using a combination of SMA and EMA calculations. The calculated price represents the closing price of the most recent Pseudo-Renko brick, while the direction indicates the trend ( 1 for uptrend, -1 for downtrend).
Parameters:
* `val` :
* Type: ` float `
* Description: The input value upon which the Pseudo-Renko calculations are performed. You can use any price series or custom value as input.
* `sensitivity` :
* Type: ` float `
* Default Value: ` 1.0 `
* Description: Controls the sensitivity of the brick size to the volatility of the `val`. Higher values lead to larger bricks, resulting in a smoother Renko chart. Lower values produce smaller bricks, leading to a more reactive chart.
* Possible Values: Any positive float.
* `length` :
* Type: ` int `
* Default Value: ` 7 `
* Description: The length used for calculating the EMA and SMA in the dynamic brick size calculation. It influences how quickly the brick size adapts to changing volatility of the `val`.
* Possible Values: Any positive integer.
Return Values:
* `lastRenkoClose` :
* Type: ` float `
* Description: The closing price of the last completed Pseudo-Renko brick based on the `val`.
* `renkoDirection` :
* Type: ` int `
* Description: The direction of the current Pseudo-Renko brick based on the `val`:
* ` 1 `: Uptrend
* ` -1 `: Downtrend
* ` 0 `: No change (initially, or no brick change since the previous bar)
Example Usage:
//@version=5
indicator("Pseudo-Renko Stabilized (Val)", overlay=true)
// Get user inputs
sensitivityInput = input.float(0.1, "Sensitivity",0.01,step=0.01)
lengthInput = input.int(5, "Length",2)
// Example usage with the 'close' price as the input value
= pseudo_renko(math.avg(close,open), sensitivityInput, lengthInput)
// Plot the Renko close price
plot(renkoClose, "Renko Close", renkoDirection>0?color.aqua:color.orange,2)
// You can also use other values as input, such as:
// = pseudo_renko(high, sensitivityInput, lengthInput)
// = pseudo_renko(low, sensitivityInput, lengthInput)
This example demonstrates how to use the `pseudo_renko` function within an indicator. It takes user inputs for `sensitivity` and `length`, then calculates the Pseudo-Renko values using the average of the `close` and `open` prices as the `val`. The resulting `renkoClose` price is plotted on the chart, with a color change based on the `renkoDirection`. It also illustrates how you can use other values, like `high` and `low`, as input to the function.
Note: The Pseudo-Renko algorithm is based on adapting the Renko brick size dynamically based on the input `val`. This provides more flexibility compared to the normal, but is experimental. The `sensitivity` and `length` parameters, along with the choice of the `val`, offer further customization to tune the algorithm's behavior to your preference and trading style.
The Quantum Leap: Renko + ML(Note: This indicator uses the BackQuant & SuperTrend which takes a 4-5 seconds to load)
This strategy uses the following indicators (please see source code)
Synthetic Renko: Ignores time and focuses purely on price movement to detect clear trend reversals (Red-to-Green).
ATR (Average True Range): Measures volatility to calculate the Renko brick sizes and SuperTrend sensitivity.
Adaptive SuperTrend: A trend filter that uses volatility clustering to confirm if the market is currently in a "Bearish" state.
RSI (Relative Strength Index): A momentum gauge ensuring the asset is "Oversold" (exhausted) before we consider a setup.
Monthly Pivots: Horizontal support lines based on last month's data acting as price "floors" (S1, S2, S3).
SMA (Simple Moving Average): A 100-bar average ensuring we are strictly buying below the long-term mean (deep value).
BackQuant (KNN): A Machine Learning engine that compares current data to historical patterns to predict immediate momentum.
This is a sophisticated, multi-stage strategy script. It combines "Old School" price action (Renko) with "New School" Machine Learning (KNN and Clustering).
Here is the high-level summary of how we will break this down:
Topic 1: The "Bottom Hunter" Setup. How the script uses Renko bricks and aggressive filtering (SuperTrend, SMA, RSI, Pivots) to find a potential market bottom.
Topic 2: The ML Engine (BackQuant & SuperTrend). How the script uses K-Nearest Neighbors (KNN) to predict momentum and Volatility Clustering to adjust the SuperTrend.
Topic 3: The "Leap" Execution. How the script synchronizes the Setup (Topic 1) with the ML Trigger (Topic 2) using a time window.
Topic 1: The "Bottom Hunter" Setup
This script is designed as a Mean Reversion strategy (often called "catching a falling knife" or "bottom fishing"). It is trying to find the exact moment a downtrend stops and reverses.
Most strategies buy when price is above the 200 SMA or above the SuperTrend. This script does the exact opposite.
The Logic:
Renko Bricks: It simulates Renko bricks internally (without changing your chart view). It waits for a specific pattern: A Red Brick followed immediately by a Green Brick (a reversal).
The "Bearish" Filters: To generate a "WATCH" signal, the following must be true:
Price < SuperTrend: The market must officially be in a downtrend.
Price < SMA: Long-term trend is down.
Price < Monthly Pivot: Price is deeply discounted.
RSI < Threshold: The asset is oversold (exhausted).
Recommended Settings for daily signals for Stocks :
Confirmation : 10. (How many bars after Renko Buy signal the AI has to identify a bullish move).
Percentage : 2 (This is the Renko bar size. This represents 2% move.)
SMA: 100 (Signal must be found below 100 SMA)
Price must be below: PIVOT (This is the monthly Pivot levels)

Flex Renko Emulator Strategy by Zack_The_LegoThe author of the study is Zack_The_Lego but i made it into a strategy because its an awesome study by him.

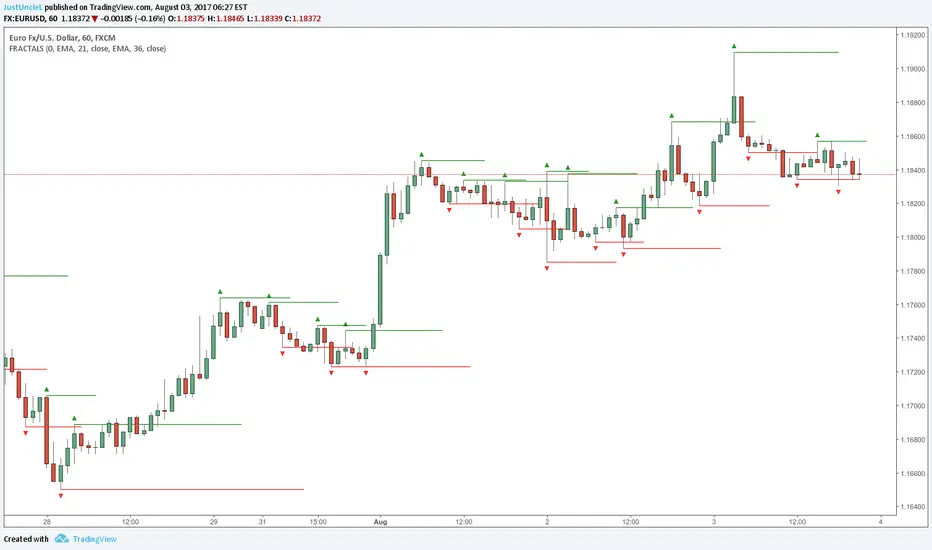
Fractals and Levels by JustUncleLEven though there are a many other Fractal and Level indicators, this indicator has some unique features. The indicator will display Fractals, fractal levels and HH/LL points, they will only be drawn after they have completed. Also the indicator has options to :
Show Ideal Fractals Only.
Use Renko Style Fractals, where open/close values are used instead of high/low to find Fractals. This is used to show the correct Fractals when Renko Wicks are enabled.
Has an optional Filter to only display Fractals that are above/below a MA Ribbon.
References:
This code is based on Fractal Levels V8 by RicardoSantos
This is a Renko Chart with "Renko Style Fractals" enabled, notice that the wicks are ignored and only the true Bricks are used for Fractals:
HL2 - 22 EMA Cross for RenkoEURUSD
This is a simple strategy to use for those who like Renko bars. I ONLY use it on Renko.
Basic idea is that when the Renko bar closes above or below the 22 EMA, you go long or short.
However, some of the frustrations I've had with any strategy shared in Tradingview is so few folks put in the ability to set a stop or a profit target or the ability to set a specific time to trade. I have added those to this strategy. (And I for the life of me can not remember where I got the code for the the time, I need to find you!).
Special note: If you have never used the Renko bars in Tradingview, make sure you click the Format option next to whatever pair you are looking at and change it from Traditional to ATR. You can set it for a static pip amount if you want. But ATR at first will help you decide which amount of pips you should throw in.
This is my first published strategy so if I screwed up on anything or didn't explain it very well, please let me know!!

Weird Renko StratThis strategy uses Renko, it generates a signal when there is a reversal in Renko. When using historical data, it provides a good entry and an okay exit. However, in a real-time environment, this strategy is subject to repaint and may produce a false signal.
As a result, the backtesting result should not be used as a metric to predict future results. It is highly recommended to forward-test the strategy before using it in real trading. I forward test it from 12/18/2022 to 12/21/2022 in paper trading, using the alert feature in Tradingview. I made 60 trades trading the BTCUSDT BINANCE 3 min with 26 as the param and under the condition that I use 20x margin, compounding my yield, and having 0 trading fee, a steady loss is generated: from $10 to $3.02.
This is quite interesting. As if I flip the signal from "Long" to "Short" and another way too, it will be a steady profit from $10 to $21.85. Hence, if I'm trying to anti-trade the real-time alert signal, the current "4 Days Result" will be good. Nevertheless, I still have to forward-test it for longer to see if it will fail eventually.
Dive into the setting of the strategy
- Margin is the leverage you use. 1 means 1x, 10 means 10x. It affects the backtest yield when you backtest
- Compound Yield button is for compound calculation, disable it to go back to normal backtesting
- Anti Strategy button is to do the opposite direction trade, when the original strat told you to "Long", you "Short" instead. Enable it to use the feature
- Param is the block size for the Renko chart
- Drawdown is just a visual tool for you in case you want to place a stop loss (represent by the semitransparent red area in the chart)
- From date Thru Date is to specify the backtest range of the strategy, This feature is turned off by default. It is controlled by the Max Backtest Timeframe which will be explain below
- Max Backtest Timeframe control the From date Thru Date function, disable it to enable the From Date Thru Date function
Param is the most important input in this strategy as it directly affects performance. It is highly recommended to backtest nearly all the possible parameters before deploying it in real trading. Some factors should be considered:
- Price of the asset (like an asset of 1 USD vs an asset of 10000 USD required different param)
- Timeframe (1-minute param is different than 1-month param)
I believe this is caused by the volatility of the selected timeframe since different timeframe has different volatility. Param should be fine-tuned before usage.
Here is the param I'm using:
BTCUSDT BINANCE 3min: 26
BTCUSDT BINANCE 5min: 28
BTCUSDT BINANCE 1day: 15
Background of the strategy:
- The strategy starts with $10 at the start of backtesting (customizable in setting)
- The trading fee is set to 0.00% which is not common for most of the popular exchanges (customizable in setting)
- The contract size is not a fixed amount, but it uses your balance to buy it at the open price. If you are using the compound mode, your balance will be your current total balance. If you are using the non-compound mode, it will just use the $10 you start with unless you change the amount you start with. If you are using a margin higher than 1, it will calculate the corresponding contract size properly based on your margin. (Only these options are allowed, you are not able to change them without changing the code)

ST15 CM inspired 4hr renko Pivots
Standard pivot points do not work with ATR Renko charts, but I really enjoy using pivot points to find strong s/r, so I started to look at scripts that could provide the same results as floor trader pivots but on a renko chart. I found a script written by CM that I was able to tweak a little and I got it work with ATR renkos. The only issue now is he only wrote the script to look for 1hr pivot points so I am now in the process off writing versions that can do the 240 1d 1w and 1m pivot points as well. Here is the 4hr :) enjoy! Thank you CM :)
Realtime RenkoI've been working on real-time renko for a while as a coding challenge. The interesting problem here is building renko bricks that form based on incoming tick data rather than waiting for bar closes. Every tick that comes through gets processed immediately, and when price moves enough to complete a brick, that brick closes and a new one opens right then. It's just neat because you can run it and it updates as you'd expect with renko, forming bricks based purely on price movement happening in real time rather than waiting for arbitrary time intervals to pass.
The three brick sizing methods give you flexibility in how you define "enough movement" to form a new brick. Traditional renko uses a fixed price range, so if you set it to 10 ticks, every brick represents exactly 10 ticks of movement. This works well for instruments with stable tick sizes and predictable volatility. ATR-based sizing calculates the average true range once at startup using a weighted average across all historical bars, then divides that by your brick value input. If you want bricks that are one full ATR in size, you'd use a brick value of 1. If you want half-ATR bricks, use 2. This inverted relationship exists because the calculation is ATR divided by your input, which lets you work with multiples and fractions intuitively. Percentage-based sizing makes each brick a fixed percentage move from the previous brick's close, which automatically scales with price level and works well for instruments that move proportionally rather than in absolute tick increments.
The best part about this implementation is how it uses varip for state management. When you first load the indicator, there's no history at all. Everything starts fresh from the moment you add it to your chart because varip variables only exist in real-time. This means you're watching actual renko bricks form from real tick data as it arrives. The indicator builds its own internal history as it runs, storing up to 250 completed bricks in memory, but that history only exists for the current session. Refresh the page or reload the indicator and it starts over from scratch.
The visual implementation uses boxes for brick bodies and lines for wicks, drawn at offset bar indices to create the appearance of a continuous renko chart in the indicator pane. Each brick occupies two bar index positions horizontally, which spaces them out and makes the chart readable. The current brick updates in real time as new ticks arrive, with its high, low, and close values adjusting continuously until it reaches the threshold to close and become finalized. Once a brick closes, it gets pushed into the history array and a new brick opens at the closing level of the previous one.
What makes this especially useful for debugging and analysis are the hover tooltips on each brick. Clicking on any brick brings up information showing when it opened with millisecond precision, how long it took to form from open to close, its internal bar index within the renko sequence, and the brick size being used. That time delta measurement is particularly valuable because it reveals the pace of price movement. A brick that forms in five seconds indicates very different market conditions than one that takes three minutes, even though both bricks represent the same amount of price movement. You can spot acceleration and deceleration in trend development by watching how quickly consecutive bricks form.
The pine logs that generate when bricks close serve as breadcrumbs back to the main chart. Every time a brick finalizes, the indicator writes a log entry with the same information shown in the tooltip. You can click that log entry and TradingView jumps your main chart to the exact timestamp when that brick closed. This lets you correlate renko brick formation with what was happening on the time-based chart, which is critical for understanding context. A brick that closed during a major news announcement or at a key support level tells a different story than one that closed during quiet drift, and the logs make it trivial to investigate those situations.
The internal bar indexing system maintains a separate count from the chart's bar_index, giving each renko brick its own sequential number starting from when the indicator begins running. This makes it easy to reference specific bricks in your analysis or when discussing patterns with others. The internal index increments only when a brick closes, so it's a pure measure of how many bricks have formed regardless of how much chart time has passed. You can match these indices between the visual bricks and the log entries, which helps when you're trying to track down the details of a specific brick that caught your attention.
Brick overshoot handling ensures that when price blows through the threshold level instead of just barely touching it, the brick closes at the threshold and the excess movement carries over to the next brick. This prevents gaps in the renko sequence and maintains the integrity of the brick sizing. If price shoots up through your bullish threshold and keeps going, the current brick closes at exactly the threshold level and the new brick opens there with the overshoot already baked into its initial high. Without this logic, you'd get renko bricks with irregular sizes whenever price moved aggressively, which would undermine the whole point of using fixed-range bricks.
The timezone setting lets you adjust timestamps to your local time or whatever reference you prefer, which matters when you're analyzing logs or comparing brick formation times across different sessions. The time delta formatter converts raw milliseconds into human-readable strings showing days, hours, minutes, and seconds with fractional precision. This makes it immediately clear whether a brick took 12.3 seconds or 2 minutes and 15 seconds to form, without having to parse millisecond values mentally.
This is the script version that will eventually be integrated into my real-time candles library. The library version had an issue with tooltips not displaying correctly, which this implementation fixes by using a different approach to label creation and positioning. Running it as a standalone indicator also gives you more control over the visual settings and makes it easier to experiment with different brick sizing methods without affecting other tools that might be using the library version.
What this really demonstrates is that real-time indicators in Pine Script require thinking about state management and tick processing differently than historical indicators. Most indicator code assumes bars are immutable once closed, so you can reference `close ` and know that value will never change. Real-time renko throws that assumption out because the current brick is constantly mutating with every tick until it closes. Using varip for state variables and carefully tracking what belongs to finalized bricks versus the developing brick makes it possible to maintain consistency while still updating smoothly in real-time. The fact that there's no historical reconstruction and everything starts fresh when you load it is actually a feature, not a limitation, because you're seeing genuine real-time brick formation rather than some approximation of what might have happened in the past.

MestreDoFOMO MACD VisualMasterDoFOMO MACD Visual
Description
MasterDoFOMO MACD Visual is a custom indicator that combines a unique approach to MACD with stochastic logic and simulated Renko-based direction signals. It is designed to help traders identify entry and exit opportunities based on market momentum and trend changes, with a clear and intuitive visualization.
How It Works
Stylized MACD with Stochastic: The indicator calculates the MACD using EMAs (exponential moving averages) normalized by stochastic logic. This is done by subtracting the lowest price (lowest low) from a defined period and dividing by the range between the highest and lowest price (highest high - lowest low). The result is a MACD that is more sensitive to market conditions, magnified by a factor of 10 for better visualization.
Signal Line: An EMA of the MACD is plotted as a signal line, allowing you to identify crossovers that indicate potential trend reversals or continuations.
Histogram: The difference between the MACD and the signal line is displayed as a histogram, with distinct colors (fuchsia for positive, purple for negative) to make momentum easier to read.
Simulated Renko Direction: Uses ATR (Average True Range) to calculate the size of Renko "bricks", generating signals of change in direction (bullish or bearish). These signals are displayed as arrows on the chart, helping to identify trend reversals.
Purpose
The indicator combines the sensitivity of the Stochastic MACD with the robustness of Renko signals to provide a versatile tool. It is ideal for traders looking to capture momentum-based market movements (using the MACD and histogram) while confirming trend changes with Renko signals. This combination reduces false signals and improves accuracy in volatile markets.
Settings
Stochastic Period (45): Sets the period for calculating the Stochastic range (highest high - lowest low).
Fast EMA Period (12): Period of the fast EMA used in the MACD.
Slow EMA Period (26): Period of the slow EMA used in the MACD.
Signal Line Period (9): Period of the EMA of the signal line.
Overbought/Oversold Levels (1.0/-1.0): Thresholds for identifying extreme conditions in the MACD.
ATR Period (14): Period for calculating the Renko brick size.
ATR Multiplier (1.0): Adjusts the Renko brick size.
Show Histogram: Enables/disables the histogram.
Show Renko Markers: Enables/disables the Renko direction arrows.
How to Use
MACD Crossovers: A MACD crossover above the signal line indicates potential bullishness, while below suggests bearishness.
Histogram: Fuchsia bars indicate bullish momentum; purple bars indicate bearish momentum.
Renko Arrows: Green arrows (upward triangle) signal a change to an uptrend; red arrows (downward triangle) signal a downtrend.
Overbought/Oversold Levels: Use the levels to identify potential reversals when the MACD reaches extreme values.
Notes
The chart should be set up with this indicator in isolation for better clarity.
Adjust the periods and ATR multiplier according to the asset and timeframe used.
Use the built-in alerts ("Renko Up Signal" and "Renko Down Signal") to set up notifications of direction changes.
This indicator is ideal for day traders and swing traders who want a visually clear and functional tool for trading based on momentum and trends.

[Autoview][BackTest]Dual MA Ribbons R0.12 by JustUncleLThis is an implementation of a strategy based on two MA Ribbons, a Fast Ribbon and a Slow Ribbon. This strategy can be used on Normal candlestick charts or Renko charts (if you are familiar with them).
The strategy revolves around a pair of scripts: One to generate alerts signals for Autoview and one for Backtesting, to tune your settings.
The risk management options are performed within the script to set SL(StopLoss), TP(TargetProfit), TSL(Trailing Stop Loss) and TTP (Trailing Target Profit). The only requirement for Autoview is to Buy and Sell as directed by this script, no complicated syntax is required.
The Dual Ribbons are designed to capture the inferred behavior of traders and investors by using two groups of averages:
> Traders MA Ribbon: Lower MA and Upper MA (Aqua=Uptrend, Blue=downtrend, Gray=Neutral), with center line Avg MA (Orange dotted line).
> Investors MAs Ribbon: Lower MA and Upper MA (Green=Uptrend, Red=downtrend, Gray=Neutral), with center line Avg MA (Fuchsia dotted line).
> Anchor time frame (0=current). This is the time frame that the MAs are calculated for. This way 60m MA Ribbons can be viewed on a 15 min chart to establish tighter Stop Loss conditions.
Trade Management options:
Option to specify Backtest start and end time.
Trailing Stop, with Activate Level (as % of price) and Trailing Stop (as % of price)
Target Profit Level, (as % of price)
Stop Loss Level, (as % of price)
BUY green triangles and SELL dark red triangles
Trade Order closed colour coded Label:
>> Dark Red = Stop Loss Hit
>> Green = Target Profit Hit
>> Purple = Trailing Stop Hit
>> Orange = Opposite (Sell) Order Close
Trade Management Indication:
Trailing Stop Activate Price = Blue dotted line
Trailing Stop Price = Fuschia solid stepping line
Target Profit Price = Lime '+' line
Stop Loss Price = Red '+' line
Dealing With Renko Charts:
If you choose to use Renko charts, make sure you have enabled the "IS This a RENKO Chart" option, (I have not so far found a way to Detect the type of chart that is running).
If you want non-repainting Renko charts you MUST use TRADITIONAL Renko Bricks. This type of brick is fixed and will not change size.
Also use Renko bricks with WICKS DISABLED. Wicks are not part of Renko, the whole idea of using Renko bricks is not to see the wick noise.
Set you chart Time Frame to the lowest possible one that will build enough bricks to give a reasonable history, start at 1min TimeFrame. Renko bricks are not dependent on time, they represent a movement in price. But the chart candlestick data is used to create the bricks, so lower TF gives more accurate Brick creation.
You want to size your bricks to 2/1000 of the pair price, so for ETHBTC the price is say 0.0805 then your Renko Brick size should be about 2*0.0805/1000 = 0.0002 (round up).
You may find there is some slippage in value, but this can be accounted for in the Backtest by setting your commission a bit higher, for Binance for example I use 0.2%
Special thanks goes to @CryptoRox for providing the initial Risk management Framework in his "How to automate this strategy for free using a chrome extension" example.
