Fibonacci + Support/Resistant + Trendline (Price action)This is opening source code version: Fibonacci + Support/Resistant + Trendline (One of Advanced Price action Analysis).
How it works:
It find entry Long/Short by combining: Fibonacci + Support/Resistant + Trendline
1. Find Impulse wave:
To findind Impulse wave, It uses Pivot High/Low to find Impulse wave. In case find entry Long, If having Pivot High higher Pivot High before, it will draw an Impulse wave.
2. Find entry at Fibonacci levels:
Draw Fibonacci fibonacci retracement from Pivot Low to Pivot High. A Fibonacci retracement forecast is created by taking two extreme points on a chart and dividing the vertical distance by important Fibonacci ratios. 0% is considered to be the start of the retracement, while 100% is a complete reversal to the original price before the move. Horizontal lines are drawn in the chart for these price levels to provide support and resistance levels. Common levels are 23.6%, 38.2%, 50%, and 61.8%
3. Find entry at Support/Resistant Zone:
Support/Resistant Zone drawed from Pivot High before, which price just breaken and return to retest.
4. Find entry at Trendline:
Trendline drawed from Pivot High/Low before, which price just breaken and return to retest.
How do use it:
+ You can customize the thickness of the lines.
+ You can set up an alert when the price touchs important areas.
Search in scripts for "retest"

RSI Scalping & Swing Signals With AlertsThis RSI indicator shows a green or red ribbon when the smoothed RSI is bullish or bearish. It also includes a long moving average for overall trend confirmation. Wait until the ribbon holds above or below the long moving average and take positions in that direction.
To get an easier to read RSI indicator, I smoothed the RSI out and paired it next to a short term RMA. These two together form the ribbon that will show you early reversals and trend direction. The long moving average is used as an overall trend detector and confirmation for longer term trends.
***HOW TO USE***
Scalping: Enter longs when the ribbon turns green and enter shorts when the ribbon turns red. Exit positions when the ribbon turns the opposite color or crosses the long moving average.
Swing Trading: When the ribbon holds above the long moving average or breaks out and retests it, look for long positions and exit when the ribbon turns red or crosses the long moving average. When the ribbon holds below the long moving average or breaks down and retests it, look for short positions and exit when the ribbon turns green or crosses the long moving average.
***DETAILS***
This indicator gives early reversal signals very well and waiting for the RSI ribbon to cross the long moving average helps to get you into positions when the market is ready to really move while filtering out some of the noise.
The ribbon and background will change to green or red depending on whether it is currently bullish or bearish.
There is also a label that changes colors and tells you if RSI is bullish or bearish and also whether the RSI ribbon is above or below the long moving average.
Green or red circles will appear on the indicator when there is a bullish or bearish cross of the RSI ribbon and the long moving average.
It also has alerts that trigger when RSI is turning bullish/bearish or when the RSI ribbon is crossing the long moving average.
***CUSTOMIZATION***
Each piece of this indicator can be customized to suit your preferences including the RSI source, length, smoothing length, short moving average length and long moving average length. You can also turn off the labels, signals and long moving average. All of these settings can be managed within the indicator settings input tab.
***MARKETS***
This indicator can be used as a signal on all markets, including stocks, crypto, futures and forex.
***TIMEFRAMES***
This RSI Scalping & Swing Signals indicator can be used on all timeframes.
***TIPS***
Try using numerous indicators of ours on your chart so you can instantly see the bullish or bearish trend of multiple indicators in real time without having to analyze the data. Some of our favorites are Trend Friend Scalp & Swing Trade Signals, Volume Spike Scanner, Buy & Sell Pressure Volume Profile, and Momentum Scalper in combination with this RSI indicator. They all have real time Bullish and Bearish labels as well so you can immediately understand each indicator's trend.

Momentum Scalping & Swing Signals With AlertsThis Momentum indicator shows a green or red ribbon when smoothed momentum is bullish or bearish. It also includes a long moving average for overall trend confirmation. Wait until the ribbon holds above or below the long moving average and take positions in that direction.
To get an easier to read momentum indicator, I smoothed the momentum out and paired it next to a short term RMA. These two together form the ribbon that will show you early reversals and trend direction. The long moving average is used as an overall trend detector and confirmation for longer term trends.
***HOW TO USE***
Scalping: Enter longs when the ribbon turns green and enter shorts when the ribbon turns red. Exit positions when the ribbon turns the opposite color or crosses the long moving average.
Swing Trading: When the ribbon holds above the long moving average or breaks out and retests it, look for long positions and exit when the ribbon turns red or crosses the long moving average. When the ribbon holds below the long moving average or breaks down and retests it, look for short positions and exit when the ribbon turns green or crosses the long moving average.
***DETAILS***
This indicator gives early reversal signals very well and waiting for the momentum ribbon to cross the long moving average helps to get you into positions when the market is ready to really move while filtering out some of the noise.
The ribbon and background will change to green or red depending on whether it is currently bullish or bearish.
There is also a label that changes colors and tells you if momentum is bullish or bearish and also whether the momentum ribbon is above or below the long moving average.
Green or red circles will appear on the indicator when there is a bullish or bearish cross of the momentum ribbon and the long moving average.
It includes alerts that trigger when momentum is turning bullish/bearish or when the momentum ribbon is crossing the long moving average.
***CUSTOMIZATION***
Each piece of this indicator can be customized to suit your preferences including the momentum source, length, smoothing length, short moving average length and long moving average length. You can also turn off the labels, signals and long moving average. All of these settings can be managed within the indicator settings input tab.
***MARKETS***
This indicator can be used as a signal on all markets, including stocks, crypto, futures and forex.
***TIMEFRAMES***
This Momentum Scalping & Swing Signals indicator can be used on all timeframes.
***TIPS***
Try using numerous indicators of ours on your chart so you can instantly see the bullish or bearish trend of multiple indicators in real time without having to analyze the data. Some of our favorites are Trend Friend Scalp & Swing Trade Signals, Volume Spike Scanner, Buy & Sell Pressure Volume Profile, and RSI Scalper in combination with this momentum indicator. They all have real time Bullish and Bearish labels as well so you can immediately understand each indicator's trend.

IsPullbackPivotRetested experimentThe indicator counts how often a pullback that starts outside the Keltner Channel resolves or fails.
Resolves: the pullback high or low is retested.
Fails: price goes outside the oppositie side of the Keltner Channel.

Multi Day vWAP (Customizable) with AverageIntroducing the Multi-Day vWAP indicator that is fully customizable with average indicator option.
High level overview (default settings):
Default is 10 plots with each setting 1 day apart (1-10 day look back)
Labels for each plot are turned on by default (labels will default to your value, more below)
Use Style tab in options to change colors, plot style, and turn on/off individual plots
Average is turned off by default (style panel will show it's on-- go to Inputs panel and select "Show vWAP Average" to turn on)
Best use case is go to Visibility Panel in options and turn off for Days, Weeks, and Months
To turn off all labels at once go to Style tab and unselect "Labels" checkbox
If you want plots to be as small as possible in Inputs panel set the Plot Width to 0 (zero)
Detail Overview
This indicator will plot your custom daily vWAP values.
You can change the lookback period. If you change the lookback period the label will match your custom value.
For instance, if you change vWAP 1 value to "5", the label for this plot will be 5.
Average Notes:
The average will average all the vWAP values by the divisor. The default is to average all values by 10.
The average will always start to plot from the shortest lookback period. It is not possible to have the average plot before that point.
Trading Tips (default settings)
The simple way to use the vWAP is to treat them as magnets.
For intance,
Generally if price is trading below all the vWAP plots the chart is in a momentum short enviroment. All vWAP areas can be used for upside resistance/reaction areas.
If price is trading above the chart is in a momentum long enviroment and pullbacks can to vWAP levels can be looked as areas of support/reaction.
For instance:
Price is above the current day vWAP and looking to test the previous day vWAP value.
As it approaches the 2 value you are expecting this area to be a reaction area (good trade entry area) for a continuation short trade. Possibly to check back into the current day vWAP value.
I should share that this is a simple way to trade with the vWAP (true success with vWAP is understanding that price trades in vWAP channels).
Stacking and Strong Momentum
The other pattern you should look for is stacking.
For instance on this CL chart:
This chart is strong momentum long.
All 10 day vWAP plots are stacked on top of each other.
Previous action tested below all vWAPs. Price traded thru and came back and retested. Finally closing above all and above the vWAP avearge (red).
When the day vWAP was broke the next target you look for is the 2 vWAP. This reaction area held up and momentum long continued and continuing to trade above current day vWAP.
7 Day Rolling Example (Larger Timeframe)
Another great way to use this indicator is to customize the values for rolling 7 days (5 days for cash markets).
To do this set values to: 7, 14, 21, 28, 35, 42, 49, 56, 63, 70
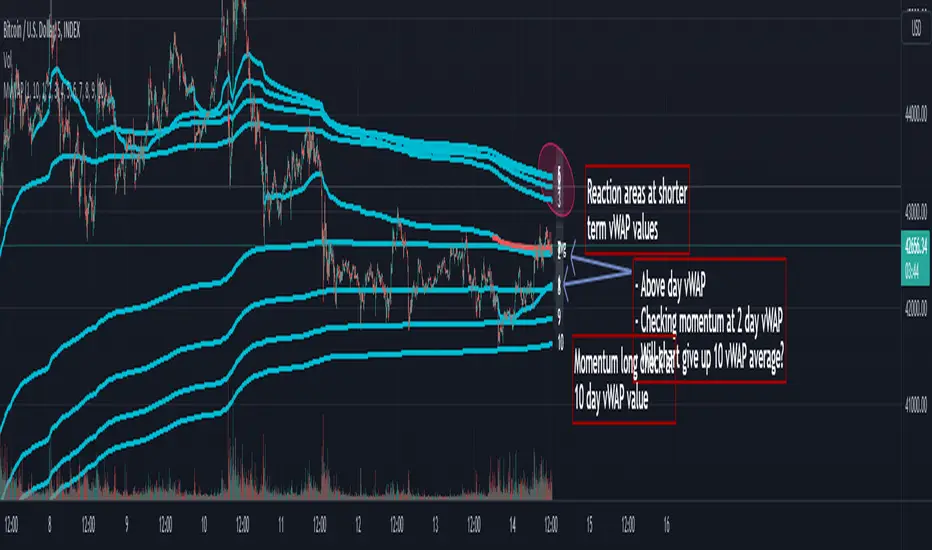
For instance, this BTC chart:
This chart provides a good example of what you'll find when a chart is at a pivot point.
Price is checking in at the average to remain momentum long.
Upside longer term vWAP plots have been tested and had expected reaction.
Price is trading above the shorter term values.
Simple TA here will note if chart continues to trade above and takes out upper vWAPs long momentum is gaining ground.
On the downside if price trades thru the lower vWAP plots you would expect further downside. In this scenario you would be mindful to expect upside tests before (which could be good entry/reaction areas).
NQ example with 7 day values:
Overall chart is momentum short.
7 is above 14, 21
Maybe early sign of bottom.
If price takes out these values and holds above the buyers have quite a few challenges above.
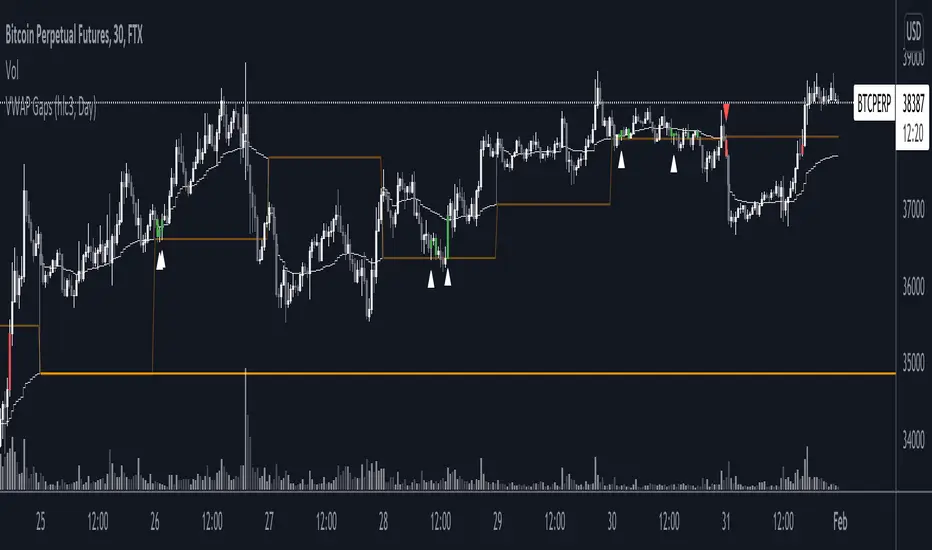
VWAP GapsTheory of untested previous VWAPs acting in similar way to nPOC, where agreed previous 'value' based on volume acts as a liquidity area to be retested.
Indicator shows
- User selected VWAP
- Untested previous VWAPs. The line will disappear once price crosses it's value
- Sweeps of previous VWAPs. Show by both bar colours and plotted arrows under different conditions.
Sweep Filters
1. Bull or Bear Bar (required for an arrow plot)
2. Sweep Conditions i.e. open below line, high above line, and close below line
3. If current VWAP is below/above the previous VWAP value.
Padder Scalp - Manipulation Triangle + First 15m Session BoxThis indicator combines intraday manipulation detection with session‑based structure and key candlestick pattern labeling to support precision scalp trading.
1. Manipulation Candle Detection (Daily ATR‑Based)
The script calculates the Daily ATR(14) and compares each intraday candle’s range to it.
If a candle’s range is ≥ 20% of the daily ATR, it is flagged as a potential manipulation candle.
A purple triangle is plotted beneath any candle that meets this threshold, helping traders quickly spot abnormal volatility spikes that often precede liquidity grabs or engineered moves.
2. First 15‑Minute RTH Session Box (9:30–9:45 AM)
Designed for use on a 15‑minute chart, the script automatically identifies the first bar of the regular trading session (RTH).
When the 9:30–9:45 candle prints:
- Its high and low are captured
- A session box is created using those levels
- The box extends across the entire trading day
This provides a consistent structural reference point for opening‑range dynamics, liquidity sweeps, and intraday bias.
3. Automatic Box Extension
Once the first RTH candle is detected, the script draws a blue box from that candle’s high/low and continuously extends it to the right for the remainder of the session.
This creates a persistent visual anchor for:
- Breakouts
- Retests
- Rejections
- Mean‑reversion scalps
4. Candlestick Pattern Detection + Labels
The script identifies and labels four high‑value reversal/continuation patterns:
- Bullish Engulfing → green label above the candle
- Bearish Engulfing → red label below the candle
- Hammer → yellow label below the candle
- Inverted Hammer → orange label above the candle
These labels help traders quickly spot actionable price‑action signals without manually scanning every bar.
Overall Purpose
This tool blends volatility‑based manipulation detection, opening‑range structure, and real‑time candlestick pattern recognition into a single, clean visual system.
It’s built for scalpers and intraday traders who rely on:
- Opening‑range levels
- Liquidity cues
- Manipulation signals
- Price‑action confirmation
to time entries with precision.

BK AK-King Quazi🦁👑 BK AK–KING QUAZI — MEASURED HAND, CLEAN BLADE. 👑🦁
This is Quasimodo turned into a permissioned process: PROTO → BOS proof → RETEST → CONFIRM → resolve or invalidate — with mapped levels so you execute clean or you stand down.
All glory to the Almighty — the true source of wisdom, restraint, and endurance.
AK is honor — my mentor’s standard: clarity, patience, no shortcuts, no gambling.
🧠 What It Does
King Quazi detects and manages Quasimodo (QM) structures and outputs an execution-ready battlefield:
PROTO detection: identifies developing QM structure early (awareness, not a trade)
BOS validation: requires a displacement break (ATR-based) so you don’t trade fake breaks
RETEST logic: watches the key QM level for the “return to the scene”
CONFIRM stage: only triggers when structure + proof + timing align
INVALIDATION + cleanup: marks failure clearly and manages drawings to keep charts readable
Projections + targets: maps QM / BOS / INV, plus optional T1/T2 so planning is standardized
MTF War Room: reads multiple timeframes and shows who’s in PROTO / CONFIRM / NOW so you stop trading against the higher court
This is not a pattern sticker. It’s a workflow.
What You See On Chart (so it’s usable)
QM level + BOS level + invalidation line
Optional forward projections / extension
Optional target mapping (T1/T2)
Stage-aware labels (PROTO / CONFIRM / invalidation handling)
MTF table showing which timeframe is active and which stage is “live”
🔍 How It Works (So You Know It’s Not Random)
1) Swing Structure → QM Candidate
The script builds swing structure and recognizes valid QM geometry — no guesswork labels without structure.
2) BOS Displacement Filter (Proof of Intent)
Most QM tools fire when the shape appears. King Quazi demands body displacement vs ATR so a “break” has force behind it — not wick theater.
3) Retest + Confirm (Permissioned Entry)
After BOS, it expects retest behavior and confirms only when the market acts right at the level — not in the middle of nowhere.
4) Object Lifecycle (Clean Chart, Honest Outcome)
The script manages lines/labels so your chart stays readable and outcomes are tracked — not hidden.
🧩 Why This Script Is Original (Not Another QM Clone)
The Quasimodo concept is public. The edge here is the integration:
staged event sequencing (PROTO → BOS → RETEST → CONFIRM)
ATR displacement proof to cut false positives
standardized execution mapping (QM/BOS/INV + optional targets)
multi-timeframe stage awareness (so you stop fighting higher structure)
alert routing by event stage (signal control, not spam)
It’s not “more signals.” It’s better permission.
🧭 How To Use It (Execution Rules)
1) Campaign Mode (Trend-Aligned)
Trade only when the MTF posture supports it. PROTO is awareness — BOS/RETEST is proof.
2) Verdict Mode (Turns)
A reversal is not a feeling. It’s testimony failing at the boundary and pressure flipping. Confirm at the level or don’t touch it.
3) Stand-Down Mode (The Feature Tourists Hate)
When the tool goes quiet, it’s telling you the truth:
no permission = no trade.
That’s how capital survives.
⚙️ What You Actually Tune
Zigzag sensitivity (tight vs clean structure)
BOS displacement strictness (how hard price must prove intent)
Retest window + expiration (how strict confirmation is)
Projection visibility (QM/BOS/INV, forward extension)
Targets & entry zone behavior (T1/T2 + buffers)
MTF table + alerts (what you want surfaced)
🧑🏫 BK / AK / Faith
BK is the mark I’m building.
AK is honor — discipline, patience, clean execution.
All glory to the Almighty — the true source of wisdom and endurance.
🗡️ King David Lens (Deep — Discipline Under Fire)
David’s power wasn’t impulse. It was governed force — strength that answers to law.
He learned early that the most dangerous trap is moving before you’re sent.
That’s why his life is full of the same pattern traders ignore:
He was anointed long before he was crowned.
Meaning: truth can be real before it’s allowed to manifest.
He fought Goliath with a weapon people mocked — not because it was flashy, but because it was mastered.
Meaning: edge isn’t what looks impressive — it’s what’s trained and repeatable.
He had Saul in his hands and still refused the shortcut.
Meaning: opportunity is not permission; proximity is not assignment.
He waited through wilderness seasons where nothing “looked like progress.”
Meaning: silence isn’t rejection — sometimes it’s preparation.
That is the trader’s war.
Price will always offer motion.
But motion without permission is bait.
David didn’t survive by chasing what was available.
He survived by waiting until the moment was proved, the ground was chosen, and the strike was clean.
That’s what King Quazi enforces:
PROTO is the rumor.
BOS displacement is the proof.
Retest is the test of legitimacy.
Confirm is permission to strike.
Invalidation is humility — stand down immediately.
A lion doesn’t chase every shadow.
A lion waits until the prey is committed — then ends it.
🦁👑 BK AK–KING QUAZI — execute with proof. 👑🦁
Gd bless. 🙏

Smart Money Zones (FVG + OB) + MTF Trend Panel## Overview
Professional-grade institutional trading zones indicator that identifies **Fair Value Gaps (FVG)** and **Order Blocks (OB)** - key price inefficiencies where smart money operates. Includes a comprehensive **Multi-Timeframe Trend Panel** for complete market context at a glance.
## Core Features
### 🎯 Fair Value Gaps (FVG)
Fair Value Gaps occur when price moves so aggressively that it leaves an "imbalance" or "gap" in the market structure. These zones often act as magnets where price returns to find liquidity.
**Detection Logic:**
- **Bullish FVG**: When current candle's low is above the high of the candle 2 bars ago
- **Bearish FVG**: When current candle's high is below the low of the candle 2 bars ago
- Requires strong impulse candle (configurable body percentage threshold)
- Color-coded zones: Green for bullish, Red for bearish
### 📦 Order Blocks (OB)
Order Blocks represent the last opposite candle before a significant price move - the zone where institutional orders were placed before the breakout.
**Detection Logic:**
- Identifies the last bearish candle before a strong bullish breakout (Bullish OB)
- Identifies the last bullish candle before a strong bearish breakout (Bearish OB)
- Validates breakout strength using ATR multiplier (1.2x default)
- Color-coded zones: Blue for bullish, Orange for bearish
### 📊 Multi-Timeframe Trend Panel
Real-time trend analysis across **7 timeframes** displayed in an elegant dashboard:
- **1 Minute** - Ultra short-term scalping
- **5 Minutes** - Short-term momentum
- **15 Minutes** - Intraday swings
- **30 Minutes** - Session trends
- **1 Hour** - Multi-session trends
- **4 Hours** - Daily structure
- **Daily** - Long-term direction
**Visual Indicators:**
- 🟢 Green circle = Bullish trend
- 🔴 Red circle = Bearish trend
- Clean, professional table design with customizable position and size
## Intelligence Features
### 🧠 Zone Strength Rating
Every zone is automatically classified by strength based on size relative to ATR:
- **VERY STRONG** - 2.0x ATR or more (major institutional zones)
- **STRONG** - 1.5x to 2.0x ATR (significant zones)
- **MEDIUM** - 1.0x to 1.5x ATR (moderate zones)
- **WEAK** - Below 1.0x ATR (minor zones)
Strength rating helps you prioritize which zones to trade from!
### 📉 Smart Mitigation Tracking
Zones automatically track how much they've been "filled" or mitigated:
- Calculates penetration percentage as price enters the zone
- Zones turn **gray** when 50%+ mitigated or fully filled
- Option to **auto-delete** mitigated zones to keep chart clean
- Live zones extend dynamically with price action
### 🎨 Trend Filter (Optional)
When enabled, only shows zones aligned with the current trend:
- Uses customizable MA period (default 50)
- Bullish zones only appear in uptrend
- Bearish zones only appear in downtrend
- Reduces noise and false signals significantly
## Customization Options
### Display Settings
- Toggle FVGs and OBs independently
- Adjust max zones per type (5-200)
- Choose to remove or gray out mitigated zones
- Color customization for all zone types
### Detection Parameters
- **Min Impulse Body %**: Controls how strong the impulse candle must be (0.3-1.0)
- **Order Block Lookback**: How many bars to look back for OB validation (5-50)
- **ATR Length**: Period for ATR calculation (5-50)
### Trend Filter
- Enable/disable trend filtering
- Adjustable MA period for trend determination
### MTF Panel
- Show/hide the trend panel
- 4 position options: Top Right, Top Left, Bottom Right, Bottom Left
- 3 size options: Small, Normal, Large
- Customizable MA period for trend calculation across all timeframes
## Trading Applications
### 1. **Liquidity Grab Entries**
Wait for price to sweep a zone (50%+ mitigation) then enter on reversal. Smart money often "hunts" these zones before the real move begins.
### 2. **Confluence Trading**
Look for zones that align with:
- Multiple timeframe trends showing same direction
- Multiple FVGs/OBs stacking in same area
- Key support/resistance levels
### 3. **Breakout Confirmation**
Use Order Blocks to confirm the strength of breakouts. Strong OBs indicate institutional participation.
### 4. **Retracement Entries**
Enter when price returns to a fresh, unmitigated zone in the direction of the higher timeframe trend.
### 5. **Range Trading**
Identify FVG zones at range extremes - price often reverses at these inefficiencies.
## How It Works
**Fair Value Gaps** form when the middle candle creates such aggressive movement that it leaves a price gap between the high/low of surrounding candles. Institutional traders know these gaps get filled.
**Order Blocks** mark the origin of major moves. The last opposite-colored candle before a breakout is where large orders were placed. Price often returns to these zones for "retests" before continuing.
**Mitigation** happens when price returns to fill these zones. The indicator tracks this automatically, showing you which zones are still "fresh" and which have been used up.
## Best Practices
✅ **Use higher timeframe trends** - Always check the MTF panel before taking trades
✅ **Trade fresh zones** - Unmitigated zones (not gray) have the highest probability
✅ **Combine with price action** - Look for rejection wicks and engulfing candles at zones
✅ **Respect zone strength** - VERY STRONG and STRONG zones are most reliable
✅ **Use trend filter** - Especially on lower timeframes to reduce false signals
❌ **Don't overtrade** - Not every zone will react, wait for confirmation
❌ **Don't ignore context** - Check the MTF panel for conflicting trends
❌ **Don't chase** - Wait for price to come to the zone, don't enter mid-zone
## Technical Details
- **Non-repainting**: All zones are drawn on confirmed candles only
- **Performance optimized**: Uses efficient array management with per-type caps
- **Real-time updates**: Zones extend and track mitigation as price moves
- **Universal compatibility**: Works on all markets and timeframes
## Recommended Settings by Style
**Scalping (1m-5m charts):**
- Max zones: 10-15
- Use trend filter: ON
- MTF Panel: Focus on 1m-15m trends
- Remove mitigated: ON (keep chart clean)
**Day Trading (5m-1H charts):**
- Max zones: 15-20
- Use trend filter: ON
- MTF Panel: Focus on 15m-4H trends
- Remove mitigated: OFF (track zone history)
**Swing Trading (1H-D charts):**
- Max zones: 20+
- Use trend filter: Optional
- MTF Panel: Focus on 1H-1D trends
- Remove mitigated: OFF (important zones persist)
---
## Perfect For
- Smart Money Concept (SMC) traders
- ICT methodology followers
- Institutional order flow traders
- Price action traders seeking key zones
- Multi-timeframe analysis enthusiasts
**Compatible with all markets:** Forex, Crypto, Stocks, Indices, Commodities, Futures
*Trade where the institutions trade. Follow the smart money.*

Interest Zones ScannerThis indicator automatically scans a user-defined price range (on current or higher timeframe) to detect and plot the strongest horizontal support/resistance zones based on validated price reactions. It intelligently identifies levels where price has repeatedly bounced without breaking for a specified number of bars, prioritizing high-probability reaction areas.
How It Works (Technical Methodology)
Range Calculation
The script determines the high/low range using a configurable method:
"Lookback Bars": User-defined number of bars (default 400) on the target timeframe.
"Fixed Start Date": Bars since a specified date (default dynamic).
Data is fetched via request.security() from a selectable timeframe (default current chart TF) for multi-timeframe alignment.
Auto Mode Scanning
When enabled:
Scans the entire range in small percentage steps (default 1.0%, adjustable down to 0.5%).
For each potential level, creates a thin volatility-adjusted zone (height % of price, default 0.07%).
Counts "valid hits": Instances where price touches the zone and holds (no break) for user-defined bars (default 10).
Break detection: Configurable "Close" (strict) or "Wick" (sensitive).
Assumes support/resistance direction based on close relative to zone center.
Level Selection and Filtering
Ranks candidates by hit count (highest first).
Applies minimum distance filter (% apart, default 8%) to avoid clustering.
Limits to user-defined max zones (default 9) for clean display.
Sorts final zones from low to high price.
Manual Mode Alternative
When auto disabled: Directly uses user-input percentages (e.g., classic Fibo levels like 23.6, 50, 61.8) applied to the range – no validation/scoring.
Zone Construction
Horizontal boxes centered on validated levels, with dynamic height (% of price).
Colored by position: Supply (above close, default light gray), Demand (below close, default cyan).
Optional full extension (both sides) or right-only.
Labeled with percentage from range low.
Dashboard and Visuals
Table (positionable) shows:
% Level, Exact Price, Hit Count (green if >3).
Header with validation details and lookback info.
Vertical line marks range start for reference.
How to Use
This scanner excels at finding statistically validated horizontal zones where price has shown respect – ideal for support/resistance, mean reversion, or breakout setups.
Auto Mode: Best for discovering hidden/non-obvious levels. Higher hit counts = stronger zones (expect reactions/retests).
Validation Bars: Increase (e.g., 20+) for stricter, higher-quality zones in trending markets; lower for more sensitive detection.
Min Distance: Higher % for fewer, separated zones; lower for denser grids.
Multi-Timeframe: Set target TF higher (e.g., Daily) for major structural levels on lower charts.
Supply Zones (Above Price): Potential resistance – shorts or take-profits.
Demand Zones (Below Price): Potential support – longs or stops below.
Confluence: Combine with volume, order blocks, or fibo for entries. Watch for multiple hits + confluence.
Manual Mode: Quick plotting of custom % (e.g., fibo retracements/extensions).
Fine-tune scan step smaller for precision (slower on large lookbacks) or larger for speed.
Disclaimer
This indicator is a technical analysis tool and should be used in conjunction with other forms of analysis. Past performance does not guarantee future results. Always use proper risk management.

Order Blocks & ImbalanceThis indicator automatically identifies and plots Order Blocks (also known as Fair Value Gaps or Imbalances) based on Smart Money Concepts (SMC) and ICT methodology. It detects significant price inefficiencies (gaps between candles) that often act as institutional supply or demand zones.
How It Works (Technical Methodology)
1. Fair Value Gap (FVG) Detection
The indicator identifies classic 3-candle imbalances:
- Bullish Order Block (Demand): When the low of the current candle is significantly below the high of the candle two bars ago (low - high ).
- Bearish Order Block (Supply): When the high of the current candle is significantly above the low of the candle two bars ago (low - high ).
A minimum size threshold is enforced using ATR(14) × user-defined multiplier (default 0.5) to filter out minor gaps and focus on meaningful inefficiencies.
2. Zone Creation
- Bullish zones are created at the candle two bars ago (the "origin" candle where inefficiency occurred).
- Bearish zones use the same origin candle.
- Zone boundaries:
Top = high of origin candle
Bottom = low of origin candle
This captures the full range where price moved aggressively, leaving an imbalance that institutions may later revisit.
3. Mitigation Detection
Zones can be mitigated in two ways (user-selectable):
- "Close": Zone is considered touched only if the close price enters the zone.
- "Wick": Zone is touched if any wick (high/low) enters the zone (more sensitive).
When mitigated:
- Background becomes more transparent
- Border turns dotted
- Label changes to "Mitigated"
Broken zones (price fully closes beyond the opposite side) are automatically deleted.
4. Zone Lifecycle Management
- Active Zone: Strong color fill (green for demand, red for supply) with solid border.
- Mitigated Zone: Faded color, dotted border – indicates partial fill or reduced strength.
- Broken Zone: Automatically removed from chart to reduce clutter.
Old zones are also pruned when exceeding 450 total to maintain performance.
5. Smart Visibility Engine (Optional)
When enabled:
- All zones are initially hidden.
- Only the closest relevant zones are shown:
- Up to user-defined limit (default 10) highest bullish zones (closest below price)
- Up to user-defined limit (default 10) lowest bearish zones (closest above price)
- Visible zones are automatically extended to the right and styled appropriately.
This keeps the chart clean while highlighting the most actionable zones near current price.
6. Visual Elements
- Demand Zones: Green fill, labeled "OB Demand"
- Supply Zones: Red fill, labeled "OB Supply"
- Tiny text size to minimize chart clutter
- Zones drawn as boxes using bar_index positioning
How to Use
Order Blocks represent areas of price inefficiency where smart money likely entered/exited positions aggressively.
- Demand Zones (Green): Potential long entry areas when price returns. Expect buying pressure to defend these levels. Best setups when price retests an active (non-mitigated) zone.
- Supply Zones (Red): Potential short entry areas when price returns. Expect selling pressure to emerge.
- Mitigated Zones: Lower probability – may act as weaker support/resistance.
- Smart Visibility: Highly recommended for cleaner charts. Focuses attention on zones most likely to be tested soon.
- Combine with:
- Break of Structure (BOS)/Change of Character (CHOCH)
- Liquidity grabs
- Higher timeframe confluence
- Volume or momentum confirmation
Use higher FVG threshold (e.g., 0.8–1.0) for fewer, higher-quality zones. Lower threshold for more aggressive detection.
Disclaimer
This indicator is a technical analysis tool and should be used in conjunction with other forms of analysis. Past performance does not guarantee future results. Always use proper risk management.

Session Candle Hunter 🎯🎯 Session Candle Hunter — Precision Session Mapping for Smart Traders
Session Candle Hunter 🎯 is a powerful tool designed to help traders identify and track the most important session candle of the trading day—commonly used for liquidity grabs, range mapping, volatility zones, and breakout anticipation.
Whether you trade NY session, London session, or custom time windows, this indicator automatically detects the candle at your chosen New York Time, extracts its high and low, and visually projects these levels into the current session.
🔍 What This Indicator Does
1️⃣ Detects the Key Session Candle
You select:
Hour of the candle (NY Time)
Candle timeframe (1H, 4H, 15m, etc.)
The script automatically:
Identifies the candle when it forms
Stores its High/Low
Prepares levels for visual projection
🎨 2️⃣ Highlights the Candle Zone
Optionally displays a colored zone (box) between the candle’s high and low:
Helps visualize the liquidity pocket
Useful for session traps, expansion moves, and fair value interpretation
You can choose:
Zone color
Whether to show it or not
Whether it should update only for the latest candle
📈 3️⃣ Draws High/Low Lines With Extensions
High and Low of the detected candle can be plotted as:
Standard lines
Or infinitely extended to the right
Great for identifying:
Breakouts
Retests
Range boundaries
Session expansion models
Optional labels display exact price levels.
🕐 4️⃣ Delayed Display Logic
The indicator only shows levels after a user-defined NY time.
For example:
Show lines only after 8:30 NY — perfect for traders who want pre-session levels hidden until relevant.
🔄 5️⃣ “Show Only Last” Mode
A clean, uncluttered mode that removes all historical drawings and only displays:
The latest zone
The latest high/low lines
Latest labels
Perfect for minimal-chart traders.
⚠️ 6️⃣ Alert System
Receive alerts the moment the targeted session candle forms:
“New Candle Detected”
🧾 7️⃣ Info Panel (Top-Left Corner)
Displays:
Target session hour
Display start time
Candle timeframe
Stored High/Low
Indicator name
Always visible and automatically updates.
⭐ Why Traders Love This Tool
✔ Helps visualize major liquidity zones
✔ Works on all markets & timeframes
✔ Perfect for ICT-style session concepts
✔ Helps anticipate session expansion
✔ Automates manual level drawing
✔ Clean visuals with optional minimal mode

Fabio-Style Order Flow SystemFabio-Style Order Flow System — LVN • Delta • Big Trades • FVG • Order Blocks • Liquidity • Volume Profile
This indicator brings together all major components of Fabio Valentino’s order-flow strategy in one unified tool. It visualizes where smart money is active, where inefficiencies form, and where price is likely to react next.
🔍 FEATURES
1. Order Flow & Delta
Smoothed delta to show true market imbalance
Background color shifts to bullish/bearish delta dominance
Alerts for delta spikes & order-flow flips
2. Big Trade Detection
Highlights Big Buy and Big Sell prints (relative to average volume)
Helps identify institutional aggression on both sides
3. Low Volume Nodes (LVNs)
Automatically detects low-volume zones
Flags retests of LVNs for high-probability reactions
Uses dynamic volume thresholds for accuracy
4. Volume Profile (Lightweight)
Bucket-based intrabar profile across user-defined lookback
Highlights volume distribution without heavy TradingView CPU load
Auto-scales bucket density & transparency
5. Fair Value Gaps (FVGs)
Detects both bullish & bearish three-bar imbalances
Marks gaps visually using colored boxes
Updates dynamically with a user-set lookback
6. Order Blocks (OBs)
Identifies valid displacement bars and their origin OB
Plots clean, minimalist rectangles around key OB zones
Uses ATR-based impulse filtering
7. Liquidity Grabs
Detects wick-based liquidity sweeps
Highlights both equal high/low and stop-run type wicks
Useful for spotting reversals & trap setups
8. Strategy Dashboard
Shows real-time order flow state
Displays delta strength, big trades, LVNs, and last directional impulse
Auto-positions in all corners
🎯 PERFECT FOR
Traders who use:
Order Flow
Smart Money Concepts (SMC)
ICT / FVG / Liquidity models
Market Structure + Volume
Fabio Valentino-style analysis
⚙️ PERFORMANCE
All elements optimized
Uses automatic box-clearing to avoid array overload
Works on all timeframes & markets (crypto, FX, indices, stocks)

Prime-Time × Vortex (3/6/9) — Ace (clean v3)1️⃣ Prime-Time Index (PT)
A bar becomes Prime-Time when the count satisfies the formula:
4·n − 3 is a perfect square
This generates the sequence:
1, 3, 7, 13, 21, 31, 43, 57, 73, 91, …
These are time windows where price is more likely to form:
Shifts in market structure
Impulses
Reversals
Liquidity expansions
These PT bars are drawn as small circles above the candle.
If labels are enabled, the counter value (n) is also shown.
2️⃣ Vortex 3/6/9 Digital-Root Timing
Every bar also has a digital root, calculated from the counter:
If n → digitalRoot(n) = 3, 6, or 9,
the bar is considered a Vortex bar.
These moments often align with:
Swing highs / swing lows
Micro shifts
Mini-reversals
Minor liquidity grabs
When a Prime-Time bar is also a 3/6/9 bar → high-probability timing.
These bars are highlighted in green by default.
3️⃣ Filters & Display
You can customize:
Anchor time → when counting begins
Reset daily → restart counter each new trading day
Show only 3/6/9 → hides normal PT hits
Label offset → distance above the candle
Color themes
This makes the indicator usable on:
1Min
5Min
15Min
1H
Any timeframe you want
4️⃣ How To Apply It in Trading
Use it as a time confluence tool, not a signal generator.
✔ Best ways to use:
Look for MSS, sweeps, OB retests, FVG reactions when
they occur on or near a Prime-Time or 3/6/9 bar
Expect volatility increases after PT bars
Use 3/6/9 hits to anticipate internal turning points
Combine with:
Session High/Low
Killzones (London, NYO, PM)
Purge Protocol
MMXM Execution
✔ Example:
If price sweeps a level and prints a 3/6/9 vortex bar inside a PT window →
you have a very strong timing alignment for reversal.
5️⃣ Simple Summary
Feature Meaning
Prime-Time Hit (PT) Major time window where price often shifts
3/6/9 Vortex Bar Micro-timing for internal swings
PT + 3/6/9 together High-probability timing for entries
Reset Daily Perfect for intraday models like NYO & London
Anchor Time Defines the entire cycle structure

Extended SOPR Indicator - SSOPR Tops (A/B toggle)Extended SOPR Indicator — SSOPR Tops and Lows (A/B toggle)
Observation-only. Data: Glassnode SOPR.
Overview
This indicator extends the classical SOPR (Spent Output Profit Ratio) to improve readability and reduce noise on charts. SOPR measures whether coins moved on-chain were spent at a profit or at a loss. In brief: SOPR > 1 → spending at profit; SOPR < 1 → spending at loss. SSOPR (from "Smoothed SOPR") applies optional log transform (centers baseline at 0), smoothing (standard or adaptive), and adds structured signals: Z‑score lows (capitulation), buy zones , and top detection after prolonged elevation.
Why extend SOPR? (SSOPR vs classical SOPR)
• Noise reduction: Raw daily SOPR can whipsaw around its baseline. SSOPR uses smoothing and (optionally) adaptive smoothing so regimes are visible without overfitting.
• Better readability: The log transform shifts the break-even line to 0, making “profit territory” (above 0) and “loss territory” (below 0) visually intuitive on oscillators.
• Actionable context: Z‑score highlights extreme lows (capitulation risk), a simple buy-zone threshold marks potential accumulation, and a structured top pattern (with a time factor) helps frame distribution phases after sustained elevation.
What the script plots
• Smoothed SOPR (SSOPR): An orange line representing the smoothed SOPR (with optional log transform and optional adaptive smoothing).
• Top markers: A red triangle appears once at the onset of a confirmed top pattern.
• Background shading:
– Soft green: Buy zone when SSOPR falls below the “Buy Threshold.” (+ Z‑score capitulation zones (extreme lows)).
– Soft red: Top‑zone shading when the top criteria are met but before the single triangle fires.
Inputs & parameters
• Smoothing Length (default 14): Base window for smoothing SSOPR. Higher values = smoother, slower response.
• Apply Log Transform (default ON): Uses log(SOPR) so the baseline is 0 (log(1)=0). Above 0 → net profit regime; below 0 → net loss regime.
• Adaptive Smoothing (default OFF): Expands smoothing length as volatility rises using a standard deviation proxy; reduces whipsaws while preserving structure.
• Z‑score Threshold for Lows (default −2.5): Highlights capitulation zones when SSOPR deviates far below its rolling mean.
• SSOPR Buy Threshold (default −0.02): Simple rule-of-thumb level for potential accumulation context when below (log scale).
• SSOPR Top Threshold (default +0.005): Minimum elevation required for “profit territory” when assessing tops (log scale).
• Min Bars Above Threshold Before Top (default 50): Ensures prolonged elevation before calling a top.
• Lookback for Peak Detection (default 50): Window used to locate the recent high.
• Drop % from Peak to Confirm Top (default 5%): Confirms the start of distribution from a local high.
• Highlight Background : Toggles shaded zones.
Top detection (indicator-only)
A top fires when ALL of the following are true:
SSOPR spent at least Min Bars Above Threshold above the Top Threshold (sustained elevation).
The rising phase test passes (Option A or B; see below).
A drop from the local peak exceeds Drop % within the Lookback window.
The peak occurred in profit territory (SSOPR > Top Threshold).
To avoid repeated signals during the decline, the script emits the triangle once, at onset.
Rising‑phase switch: Option A vs Option B
• Option A — Up‑step ratio : Over the last A: Bars for Rising Check (default 50), it requires that at least A: Required Up‑Step Ratio (default 60%) of bars were rising (each bar compared to the previous). This favors gradual, persistent advances and filters out “choppy” lifts.
• Option B — Net slope : Compares current SSOPR to its value B: Bars Back for Net Slope ago (default 50). If higher, the series is considered rising. This is simpler and reacts faster in volatile phases but can admit brief pseudo‑trends.
Guidance : Prefer A for conservative confirmation in slow, persistent cycles; use B when trend moves are strong and you need timely detection.
Interpretation guide
• Regimes (log view): Above 0 → spending at profit; below 0 → spending at loss.
• Capitulation lows: When Z‑score < threshold, conditions often reflect forced/liquidity‑driven spending. Treat as context, not signals.
• Buy zone: SSOPR < Buy Threshold flags potential accumulation conditions (combine with price structure).
• Tops: After prolonged elevation, a confirmed top often coincides with profit‑taking/distribution phases.
Recommended timeframes
• Daily : Code optimized for daily timeframe.
Method summary
• SSOPR source: GLASSNODE:BTC_SOPR (via request.security ).
• Optional log transform: sopr → log(sopr) to normalize around 0.
• Smoothing: SMA over Smoothing Length , optionally adaptive using local volatility (std dev).
• Z‑score: (SSOPR − mean) / std dev, highlighting extreme lows.
• Top: Requires long elevation above Top Threshold , rising‑phase (A/B), and a subsequent drop > Drop % from recent high.
Limitations & notes
• SOPR reflects on‑chain movements; some activity occurs off‑chain (exchanges, internal transfers). Not all moves imply sale; aggregation makes it a usable proxy for profit/loss realization.
• Higher smoothing reduces noise but delays signals; adaptive smoothing can help but is still a trade‑off.
• Treat thresholds as context markers. They are not entry/exit signals by themselves.
• Use with price structure, volume, and other on‑chain indicators (e.g., realized price bands, dormancy/CDD) for confluence.
How to use (examples)
• Advance holding above 0 (log view): Retests of 0 from above that hold—while SSOPR remains elevated—often mark absorption; look for Top conditions only after sustained elevation and a confirmed drop from peak.
• Downtrend below 0: Rejections near 0 can align with continued loss realization; extreme Z‑score lows suggest capitulation risk—context for accumulation, not a blind buy.
Recommended settings
• Weekly: Log ON, Smoothing Length 14–30, Adaptive ON, Buy Threshold −0.02, Top Threshold +0.005, Rising Method A, Min Bars 50.
• Daily: Log ON, Smoothing Length 14–20, Adaptive OFF or ON (depending on noise), Rising Method B for timely slope checks.
Credits & references
• SOPR metric: Renato Shirakashi; documentation: Glassnode , CryptoQuant , overview: Bitbo .
Disclaimer
This script is for research/education on market behavior. It is not financial advice. Indicators provide context; decisions remain your responsibility.
Tags
bitcoin, btc, on‑chain, sopr, ssopr, glassnode, oscillator, regime, distribution, capitulation

SNP420/INDI/support_resist_future_levelFunctionality – short description
The indicator automatically detects the latest pivot highs/lows and builds the current resistance and support levels from them. New levels start as candidate levels (dotted lines).
Using an ATR-based tolerance, it counts how many times price precisely tests and rejects the level (touch + reversal).
Once the minimum number of touches is reached, the level is marked as validated (solid line). The indicator also detects breakouts of S/R, colors breakout candles, projects a target level after the breakout, and highlights retests of the broken levels with boxes.
autor: SNP_420
project: FNXS
ps: Piece a love

Session ATP (Trend Colored)📌 Average Traded Price (ATP) – What It Means
ATP (Average Traded Price) is the weighted average price at which a stock has traded during the session, considering both price and volume.
It tells you where the majority of money has actually traded — not just the candle close.
If price stays above ATP → Buyers are in control
If price stays below ATP → Sellers dominate
ATP is like the intraday fair value of the stock.
📌 How ATP Helps in Trading
ATP gives three major insights:
1️⃣ Strength of Trend (Real Strength)
ATP rises only if strong volume enters at higher prices.
So, a rising ATP confirms genuine bullish strength, not fake moves.
ATP falling confirms real selling pressure, not random dips.
2️⃣ High-Probability Retests
Price often pulls back to ATP before taking the next direction.
Price above ATP → ATP becomes support
Price below ATP → ATP becomes resistance
This makes ATP extremely useful for intraday entries.
3️⃣ Identifying Where Big Players Are Positioned
Since ATP is volume-weighted, it reflects where institutions and big orders traded most.
If price stays above the level where institutions bought → trend is strong
If price stays below their cost → trend is weak
📌 How ATP Indicates Price Direction
In your improved version, ATP is trend-colored:
✔ Green → ATP rising → buyers dominating
✔ Red → ATP falling → sellers dominating
✔ Gray → sideways
Direction rule:
Bullish bias when price > ATP and ATP rising
Bearish bias when price < ATP and ATP falling
No-trade zone when price and ATP are flat / tangled
ATP often acts as:
Magnet in consolidation
Springboard in uptrend
Ceiling in downtrend
This helps you judge whether the move is:
A breakout with strength, or
A fake move without volume support.
🔥 Final Line
ATP is one of the few indicators that shows where the real money is trading, making it an excellent guide for intraday trend confirmation, support/resistance, and entry timing.

Gann Levels (Auto) by RRR📌 Gann Levels (Auto) — Intraday, Swing & Elliott Wave Precision Tool
Gann Levels (Auto) is a high-accuracy price-reaction indicator designed for intraday scalpers, swing traders, and Elliott Wave traders who want clean, auto-updating support and resistance levels without manually drawing anything.
The indicator automatically detects the latest swing high & swing low and plots the 8 Gann Octave Levels between them. These levels act as a complete price map—showing equilibrium, structure, trend continuation zones, and reversal points with extreme precision.
🔥 Why This Indicator Stands Out
✔ Fully automatic swing detection
Levels update as structure evolves — no manual adjustments.
✔ All Gann Octave levels
Plots 1/8 through 8/8 including the critical 4/8 midpoint.
✔ Intraday-optimized
Exceptional on 1m, 3m, 5m, and 15m charts.
✔ Ultra-clean support & resistance
Levels act as reliable barriers and breakout zones.
⭐ MOST IMPORTANT LEVELS FOR INTRADAY
4/8 – Midpoint (Major Decision Pivot)
Strongest Gann level.
Controls trend or reversal for the session.
Breakout → Trend Day
Rejection → Reversal Day
8/8 & 0/8 – Extreme Structure Edges
Most likely zones for intraday reversals.
Perfect for scalp entries when combined with volume exhaustion.
🎯 How to Trade ELLIOTT WAVE Using Gann Levels
This indicator is exceptionally powerful when combined with Elliott Wave Theory.
Here is how to use it wave-by-wave:
🔵 Wave 2 → Identify Bottom Using 0/8 or 1/8 Levels
Wave 2 typically retraces deep but remains above key structure.
Gann confirmation:
Price stops at 0/8 or 1/8 zone
Rejection wick + low volume breakdown attempt
Bullish intent starts forming
This gives a perfect Wave 3 entry zone.
🔴 Wave 3 → Breakout Above 4/8 Midpoint
Wave 3 is the strongest impulsive wave.
The 4/8 level works like a force-field.
Wave 3 confirmation:
Price breaks and retests 4/8
Strong volume
No deep pullbacks after break
This is one of the most reliable Elliott + Gann trades.
🟡 Wave 4 → Uses 3/8 or 5/8 as Support/Resistance
Wave 4 is corrective and shallow compared to Wave 2.
Gann alignment:
Wave 4 often consolidates between 3/8 and 5/8
Levels act like range boundaries
Avoid trading inside chop; wait for breakout
This gives perfect continuation entries for Wave 5.
🟣 Wave 5 → Ends Near 7/8 or 8/8 Extreme Zone
Wave 5 usually ends in overbought territory.
Gann confirmation:
Price hits 7/8 or 8/8
Momentum weakens
Divergence builds (RSI/MACD optional)
Last push = exhaustion
This is where reversals or major pullbacks begin.
💥 BONUS: Corrective Waves (A-B-C)
Wave A:
Often rejects from 4/8 or 5/8.
Wave B:
Typically trapped between 3/8–5/8.
Wave C:
Usually ends around 0/8 (for bullish trend)
or 8/8 (for bearish trend).
These zones give ultra-high confidence entries.
⚙️ Who This Indicator Is Perfect For
Elliott Wave traders
Intraday scalpers
Swing traders
Price action & structure traders
Traders who want automatic support-resistance levels
Traders who want clean, non-cluttered levels
⚠️ Disclaimer
This indicator is for educational purposes only.
Trading involves risk. Always use proper risk management.

Volume-Confirmed FTR Zones [AlgoPoint]FTR Zone Indicator — Fail To Return Zones (With Volume Confirmation)
Advanced Smart Money Zone Detection for Institutional Orderflow
The FTR Zone Indicator is a professional-grade tool designed for traders who follow Smart Money Concepts (SMC), ICT methodologies, or institutional orderflow. It automatically detects Fail To Return Zones (FTR) — high-probability supply and demand areas formed after strong displacement moves.
By combining impulse detection, base identification, and volume confirmation, this indicator highlights zones where price is most likely to react, reverse, or mitigate shortly after structure breaks.
⸻
⭐ What Are FTR Zones?
FTR zones (Fail To Return zones) are price areas where:
1. A strong displacement / impulse candle is formed
2. That impulse originates from a small consolidation (base)
3. Price moves away aggressively
4. AND fails to return immediately to the origin area
These zones often indicate:
• Institutional orders
• Imbalance
• Hidden liquidity
• Origin of a trend leg
• High-probability mitigation points
This indicator fully automates the detection and visualization of such areas.
🔍 How the Indicator Works
1. Impulse Detection
The indicator identifies a valid impulse candle using:
• ATR-based bar range filter
• Trend-aligned candle body direction
• Optional volume confirmation
Only large, meaningful institutional candles qualify — filtering out noise.
2. Base Zone Identification
Before every impulse, the tool finds the micro-consolidation base using:
• Highest high of the last X bars
• Lowest low of the last X bars
This base becomes the potential FTR zone.
3. FTR Zone Creation
When a valid impulse is detected:
• Bullish impulse → Demand FTR zone
• Bearish impulse → Supply FTR zone
The zone is immediately drawn on the chart using box.new().
4. Zone Extension
Every zone continuously extends to the right as price evolves, allowing you to track:
• Mitigation
• Retests
• Reaction points
• Liquidity sweeps
5. Invalidation Logic
Zones automatically delete when violated:
• Demand zone invalid if close < zone low
• Supply zone invalid if close > zone high
This keeps the chart clean and helps focus only on active, high-value areas.
🎛️ Key Features
✔ Automatic FTR Zone Detection
Instantly identifies institutional origin zones based on real impulse and displacement.
✔ Volume-Based Filtering
Ensures only high-volume impulses (true institutional orders) create zones.
✔ Supply & Demand Coloring
• Bullish FTR → Demand Zone (Teal tone)
• Bearish FTR → Supply Zone (Red tone)
✔ Safe Zone Storage
Fault-tolerant logic ensures no array errors, invalid zones, or broken visuals.
✔ Auto-Extending Boxes
Real-time zone updates with precise historical mapping.
✔ Smart Invalidation
Zone is removed only when fully broken, preventing false signals.
✔ Clean, Non-Repainting Logic
Impulse detection and zone placement are confirmed only on bar close.
📈 How to Use It (Example Schenarios)
For Reversals or Continuations
• Look for price reacting or mitigating inside a zone
• Use as entry confirmation in trend continuations
• Combine with FVG, BOS/CHOCH, liquidity sweeps, or premium/discount zones
For Scalping or Intraday Trading
• High-probability countertrend entries
• Reaction-based setups at institutional footprints
For Swing Traders
• Identify weekly/daily origin zones
• Plan entries around large displacement points

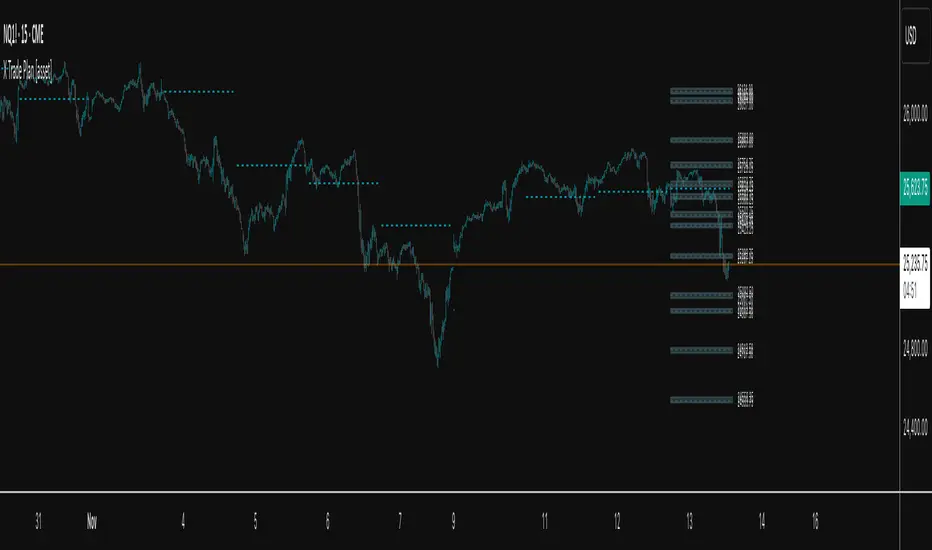
X Trade Plan [asset]A precision-structured execution framework designed to identify, map, and visualize targeted areas of interest derived from prior end-of-day AVWAP levels. These areas represent historically important zones where order flow has previously rotated, absorbed, or redistributed—making them highly relevant for future intraday decision-making.
This tool is intended to work in direct combination with the X Tail that Wags indicator, which calculates and projects the previous session’s ending AVWAP forward into the next trading day. The projected end-of-day AVWAP levels serve as a backbone for this Trade Plan: each level is wrapped, extended, and visually organized into a standardized zone structure that the trader can interpret quickly and consistently.
Purpose and Core Concept
Markets consistently respond to prior session value. The end-of-day AVWAP reflects the final consensus price where volume and time-weighted participation reached equilibrium before the session closed. When carried forward, these levels often act as real-world:
Reversion points
Liquidity pockets
Control centers
Continuation or rejection pivots
Absorption shelves and distribution tops
By framing these AVWAP-derived levels into controlled ranges—each with a slight configurable margin—the indicator transforms abstract numbers into objective, visually actionable trading zones.
How This Indicator Works
The user inputs up to fifteen prior AVWAP levels that came from X Tail that Wags’ “Previous End-of-Day AVWAP” readouts. For each active level, X Trade Plan automatically:
Builds a structured zone around the AVWAP using a user-defined ± margin
Draws a filled box from the anchor bar forward a customizable distance
Adds optional top/bottom price labels for precision
Optionally draws a mid-line representing the core of the zone
Displays custom text labels for classification, notes, or tiering
Refreshes anchor points at user-selected higher-timeframe boundaries (e.g., Daily) so zones “reset cleanly” at each new session
Everything is designed to ensure consistent, non-overlapping, visually efficient zones that maintain chart clarity even when multiple levels are active.
Intended Use in a Trade Plan
This indicator is not a signal generator.
It is a structural mapping tool designed for traders who build a daily plan around:
1. Prior Value → Future Reaction
Price commonly retests, respects, or rejects previous session AVWAP levels. These zones act as tactical reference points to evaluate:
Whether price is accepting value
Rejecting value
Targeting inefficiencies
Passing through low-resistance channels
2. Defining Areas of Interest (AOIs)
Each zone identifies where:
Positioning from previous sessions may still exist
Liquidity may sit
Algorithmic systems often pivot
High-volume traders previously accumulated or distributed
3. Enhancing Bias and Scenario Planning
When used with X Tail that Wags, traders can combine:
Current session AVWAP direction
Prior session ending AVWAP levels
The constructed Trade Plan zones
to produce:
Meaningful upside/downside targets
Control-center ranges
Lean / location for entries
Expected reaction points
This synergy turns raw historical AVWAP data into actionable structure.
Why These Levels Matter
End-of-day AVWAP levels are powerful because they encapsulate:
The final “fair value” of the prior session
Where the most volume-weighted agreement occurred
Where institutional inventory was likely set or hedged
The price many algos and funds benchmark against
When the next session opens, these prior value levels serve as magnets and decision boundaries, helping traders anticipate:
High-probability pullback zones
Reversals off previous value
Break-and-go continuation levels
Failure points where trapped participants are forced to exit
Summary
X Trade Plan
𝑎
𝑠
𝑠
𝑒
𝑡
asset transforms prior AVWAP levels—sourced from X Tail that Wags—into a structured visual map of the market’s most relevant historical value areas. These zones are used to shape a deliberate, rules-based Trade Plan that identifies where the market is likely to react, pause, rotate, or accelerate during the current session.
When paired with X Tail that Wags, this indicator provides a powerful, integrated workflow for traders who rely on value-based context, precise levels, and scenario-driven preparation.
High Volume Zones with Signals – HVZ█ OVERVIEW
"High Volume Zones with Signals – HVZ" is a technical analysis indicator that identifies High Volume Zones (HVZ) on the chart and draws them as fully customizable boxes. Perfect for traders using price action, ICT, and Smart Money Concepts. The indicator highlights key volume-based support/resistance levels, detects potential consolidation zones (very large candles), and generates precise breakout and exit signals. Flexible volume filters, ATR filter, and visual styling options ensure a clean and highly effective chart.
█ CONCEPTS
The indicator detects candles with volume significantly above the average (default ≥ 2× SMA of volume over 20 periods). Such candles often signal institutional activity and create strong supply/demand zones.
The ATR filter additionally identifies very large candles – frequently a sign of market capitulation (panic buying/selling). Within the range of such a candle, prolonged consolidation often occurs, especially on higher timeframes (e.g., 4H and above).
Why are HVZ important? High-volume zones are areas where the market has left a large number of orders – institutions return there to “refresh” liquidity before the next move. A breakout against the zone’s character triggers a Break signal:
- Bullish HVZ broken downward (close below the lower boundary) → Break Down (sell),
- Bearish HVZ broken upward (close above the upper boundary) → Break Up (buy).
Note: The indicator requires real exchange volume – it will not work correctly on instruments without reported volume (e.g., certain CFDs or forex).
█ FEATURES
- HVZ Detection: Automatic identification of high-volume zones with Volume SMA Length and Volume Multiplier filters; historical initialization up to 500 candles back.
- ATR Filter: Optional detection of very large candles (potential consolidation/capitulation) using - ATR Length and ATR Multiplier; three action modes:
Skip Zone – large candle creates no zone,
Separate Color – zone is drawn in a distinct style (gray by default),
Normal Zone – treated like a regular HVZ.
- Gray zones (large candles, Separate Color): generate exactly the same Break signals as regular zones – based solely on the original candle direction (bullish → Break Down on lower break, bearish → Break Up on upper break). Gray color is only a visual marker for potential consolidation/capitulation zones.
- Customizable Boxes: Separate styles for bullish and bearish zones (border color, background gradient, line thickness and style); adjustable background and 50 % midline transparency.
- Break & Exit Signals:
Break Up/Down – green/red triangle after a candle closes outside the zone (zone disappears, triangle remains as a trace).
Exit Up/Down – green/red circle when price leaves the zone without a full breakout.
Signal Type option: Break, Exit, or Both.
- Midline: Automatic dashed line at the 50 % zone level with independent transparency control.
- Chart Cleanup: Automatic removal of inactive zones older than 500 candles (max_boxes_count=500).
- Alerts: Built-in alerts for Break Up and Break Down with clear messages.
█ HOW TO USE
Add to Chart: Paste the script in Pine Editor or find it in TradingView’s indicator library.
Configure Settings:
- Volume Filter: Volume SMA Length (default 20) and Volume Multiplier (default 2.0) – higher multiplier = fewer but stronger zones.
- ATR Filter: Enable/disable, set ATR Length (14) and ATR Multiplier (3.5); choose action for very large candles (Skip Zone / Separate Color / Normal Zone).
- Box Style: Background transparency (90) and midline transparency (70).
- Bull/Bear Box Style: Border and gradient colors, line thickness (1-5).
- ATR Style: Separate colors for large-candle zones (gray by default).
- Signal Settings: Choose Signal Type (Break/Exit/Both) and signal colors.
Signal Interpretation:
- Break Up (green triangle below bar): Bearish HVZ broken upward → buy signal, continuation of uptrend.
- Break Down (red triangle above bar): Bullish HVZ broken downward → sell signal, continuation of downtrend.
- Exit Up/Down (circles): Price leaves zone without breakout – may signal end of correction or reversal setup.
- HVZ Zones: Price often returns to high-volume zones to clear orders. An unfilled zone remains a price magnet.
- 50 % Level (midline): Ideal target for partial take-profit or reaction point inside the zone.
Combine signals with other tools (e.g., RSI, MACD, higher timeframes) for higher confidence.
█ APPLICATIONS
- Price Action & ICT: HVZ act as dynamic S/R; in an uptrend look for buys after breaking a bearish HVZ, in a downtrend look for sells after breaking a bullish HVZ. If you trade retests instead of breakouts, increase Volume Multiplier to 2.5-3.0 – fewer zones but much stronger. Note that after breaking a very strong zone, price often pulls back deeply before continuing.
- Breakout Strategies: For maximum Break signals, lower Volume Multiplier to 1.5-1.8 – gives many high-quality entries in trending markets. Always trade in the direction of the prevailing trend (e.g., only longs in uptrends). Enter after a Break signal with confirmation from volume or momentum (MACD above zero, RSI >50 for longs, <50 for shorts).
█ NOTES
- The indicator requires real exchange volume – it will not function properly on instruments without reported volume (e.g., certain CFDs, forex).
- Always confirm signals with additional context (market structure, higher timeframe).

TMB Invest - Smart Money Concept StrategyEnglish:
**Quick Overview**
The "TMB_SMC_Strategy_v1.1.3" combines a classic trend filter using two EMAs with contrarian RSI entries and simple SMC elements (Fair Value Gaps & Order Blocks). Stop-loss and take-profit orders are volatility-adaptive and controlled via the ATR. An integrated dashboard displays the setup status, stop-loss/take-profit levels, entry reference, and trend, RSI, and ATR values.
---
## Operating Principle
1. **Trend Filter:** A fast EMA (default 50) is compared to a slow EMA (default 200). Trading occurs only in the direction of the trend: long in uptrends, short in downtrends.
2. **Timing via RSI:** Contrarian entries within the trend. Go long when the RSI is below a buy level (default 40); Short when the RSI is above a sell level (standard 60).
3. **Structure Check (SMC Proxy):** An "FVG Touch" serves as additional confirmation that an inefficient price zone has been tested. Order blocks are visualized for guidance but are not a direct entry trigger.
4. **Risk Management via ATR:** Stop-loss and take-profit levels are set as multipliers of the current ATR (e.g., SL = 1×ATR, TP = 2×ATR). This allows target and risk distances to adjust to market volatility.
5. **Simple Position Logic:** Only one position is held at a time (no pyramiding). After entry, stop and limit orders (bracket exit) are automatically placed.
---
## Input Values
* **EMA Fast / EMA Slow:** Lengths of the moving averages for the trend filter.
* **RSI Length / Levels:** Length of the RSI as well as buy and sell thresholds (contra signals within the trend direction).
* **Take Profit (RR) / Stop Loss (RR):** ATR multipliers for TP and SL.
* **Show FVGs & Order Blocks:** Toggles the visual SMC elements (zones/boxes) on or off.
--
## Signals & Execution
* **Long Setup:** Uptrend (fast EMA above slow EMA) **and** RSI below the buy level **and** a current FVG signal in a bullish direction.
* **Short Setup:** Downtrend (fast EMA below slow EMA) **and** RSI above the sell level **and** a current FVG touch in a bearish direction.
* **Entry & Exit:** If the setup is met, the market is entered; stop-loss/take-profit orders are placed immediately according to ATR multiples.
--
## Visualization
* **EMAs:** The fast and slow EMAs are plotted to illustrate the trend.
* **FVGs:** Fair Value Gaps are drawn as semi-transparent boxes in the trend color and projected slightly into the future.
* **Order Blocks:** Potential order block zones from the previous candle are visually highlighted (for informational purposes only).
---
## Integrated Dashboard
A compact table dashboard (bottom left) displays:
* Current **Setup Status** (Long/Short active, Long/Short ready, No Setup),
* **Stop-Loss**, **Take-Profit**, and **Entry Reference**,
* **Trend Status** (Bull/Bear/Sideways),
* **RSI Value**, and **ATR Value**.
Active long/short positions are highlighted in color (green/red).
--
## Practical Guide
1. **Place on Chart** and select the desired timeframe.
2. **Calibrate Parameters** (EMA lengths, RSI levels, ATR multipliers) to match the market and timeframe.
3. **Backtest** across different market phases; prioritize robustness over maximum curve fit.
4. **Fine-Tuning:**
* Shorter EMAs are often useful intraday (e.g., 20/100 or 34/144).
* Adjust RSI levels to market characteristics (45/55 for aggressive trading, 30/70 for conservative trading).
* Increase or decrease ATR multipliers depending on volatility/trading style.
--
## Notes, Limitations & Extensions
* **FVG Definition:** The FVG detection used here is intentionally simplified. Those who prefer a more rigorous approach can switch to a 3-candle definition and fill levels.
* **Order Blocks:** These primarily serve as a guide. Integration into entry/exit logic (e.g., retests) is possible as an extension.
* **Backtest Realism:** Fills may differ from the displayed closing price. For greater accuracy, intrabar backtests or an entry indicator based on the average position price are conceivable.
* **Alerts:** Currently, no alert conditions are defined; these can be added for long/short setups and status messages.
* **Position Management:** By default, no scaling is performed. Partial sales, trailing stops, or multiple entries can be added.
---
## Purpose & Benefits
The strategy offers a clear, modular framework: trend filter (direction), RSI contra timing (entry), SMC proxy via FVG Touch (structure), and ATR-based exits (risk adaptation). This makes it robust, easy to understand, and highly extensible—both for discretionary traders who appreciate visual SMC elements and for systematic testers who prefer a clean, parameterizable foundation.
