Session Breakout, Retest, Reversal + Large Move Alert## **Session Breakout, Retest, Reversal + Large Move Alert**
### Overview
A powerful multi-functional indicator designed for day traders and futures traders to identify session-based breakout opportunities, retest confirmations, and significant price movements across all futures contracts (Gold, E-mini S&P 500, Nasdaq, Crude Oil, and more).
### Key Features
**📊 Pre-Market Session Tracking**
- Automatically calculates pre-market/overnight session highs and lows
- Displays session ranges with customizable colors and styling
- Extends lines through the entire trading session for easy reference
- Supports overnight sessions (e.g., 4 PM – 7:30 AM for Gold futures)
**🚀 Breakout Detection**
- Identifies breakouts above/below pre-market highs and lows
- Uses close-price confirmation to filter false signals from wicks
- Displays "BO ↑" and "BO ↓" labels at breakout points
- Generates instant alerts when breakouts occur
**♻️ Retest Failed Tracking**
- Monitors price retests after breakouts
- Detects when retests fail to reach previous support/resistance
- Labels "RF" (Retest Failed) for high-probability trade setups
- Helps identify reversal opportunities
**📈 First 5-Minute Analysis**
- Captures first 5 minutes of market open (customizable timeframe)
- Tracks first 5-minute highs and lows separately
- Essential for mean-reversion and breakout confirmation strategies
- Blue lines extend through the trading session for easy tracking
**⚡ Large Move Alerts**
- Detects significant price movements based on point thresholds
- Individual thresholds for 5+ different symbols:
- GC (Gold): 15 points
- ES (E-mini S&P 500): 15 points
- NQ (E-mini Nasdaq): 50 points
- CL (Crude Oil): 1.5 points
- Custom: Fully adjustable
- Auto-detects symbol from chart ticker
- Labels show exact point movement and candle direction
### Customization Options
**Symbol Configuration**
- **Auto-Mode**: Automatically detects trading symbol from chart ticker
- **Manual-Mode**: Select specific symbol (GC, ES, NQ, CL, or Custom)
**Session Settings**
- Fully customizable pre-market session time (24-hour format)
- Adjustable market open time for first 5-minute window
- Market close hour and minute configuration
- Support for any timezone
**Point Move Thresholds by Symbol**
- Set independent thresholds for each of your trading symbols
- Quickly adjust settings when switching between different futures
- Includes helpful tooltips for recommended values
**Display & Styling**
- Toggle all visual elements on/off individually
- Customizable colors for all lines and labels:
- Pre-market high/low colors
- Breakout labels (up/down)
- Retest failed labels
- First 5-minute session lines
- Large move indicators
- Text size options: tiny, small, normal, large, huge
### How It Works
1. **Session Tracking**: The indicator identifies your pre-market session and marks the high and low with labeled lines (PH/PL)
2. **Breakout Signal**: Once the market opens, it monitors for close prices above/below the pre-market levels and alerts you with "BO ↑" or "BO ↓"
3. **Retest Confirmation**: After a breakout, it tracks retests and labels "RF" when the retest fails to reach the opposite extreme, confirming trade direction
4. **Large Move Detection**: Simultaneously monitors for significant point moves that exceed your symbol-specific thresholds
5. **Alert Triggers**: Get real-time alerts for:
- Breakout Up/Down
- Any Breakout
- Large Move events
### Alert Conditions
The indicator includes four alert conditions:
- **Breakout Up Alert**: Price closes above pre-market high
- **Breakout Down Alert**: Price closes below pre-market low
- **Any Breakout Alert**: Either breakout condition triggers
- **Large Move Alert**: Point movement exceeds threshold for current symbol
### Ideal For
- ✅ Day traders (breakout/retest strategies)
- ✅ Futures traders (Gold, Oil, Stock Index Contracts)
- ✅ Intraday scalpers (first 5-minute analysis)
- ✅ Swing traders (session-based levels)
- ✅ Multi-symbol traders (independent thresholds per symbol)
### Disclaimer
This indicator is designed for educational and informational purposes. Past performance does not guarantee future results. Always use proper risk management and position sizing. Test thoroughly on historical data before trading live.
Search in scripts for "retest"

ORB Breakout & RetestORB Breakout & Breakdown Indicator - Complete Opening Range Strategy
Description :
The ORB (Opening Range Breakout) Breakout & Retest Indicator is a simple tool designed to identify opening range breakouts and breakdowns with retest confirmation. This indicator works on ANY timeframe while automatically analyzing 1-minute price action to detect precise entry signals.
What makes this indicator unique:
- ✅ Multi-Timeframe ORB Analysis - Simultaneously tracks 5-min, 15-min, and 30-min opening ranges
- ✅ Smart Retest Logic - Filters false breakouts by requiring price to retest and confirm the level
- ✅ Works on Any Chart Timeframe - View on 5-min, 15-min, 1-hour, or daily charts while getting 1-minute precision
- ✅ Both Long & Short Signals - Detects bullish breakouts AND bearish breakdowns
- ✅ Customizable Alerts - Get notified when confirmed setups occur
- ✅ Clean Visual Display - Compact table showing all ORB levels and signal status
How it Works:
Opening Range Detection :
- 5-Min ORB: Captures high/low from 9:30-9:35 AM
- 15-Min ORB: Captures high/low from 9:30-9:45 AM
- 30-Min ORB: Captures high/low from 9:30-10:00 AM
Breakout Confirmation (3-Step Process) :
1. Initial Break - Price closes above ORB High (or below ORB Low for shorts)
2. Retest - Price pulls back to retest the broken level
3. Confirmation - Price breaks through again, confirming the trend
This retest requirement dramatically reduces false signals and helps you enter trades with better risk/reward.
Perfect For :
- Day traders looking for opening range strategies
- Scalpers who need precise entry signals
- Swing traders identifying strong intraday momentum
- Anyone trading stocks, futures, forex, or crypto during market hours
---
⚙️ Settings & Customization :
Display Options :
- ☑️ Show ORB High (Default: OFF) - Display the high of each opening range in the table
- ☑️ Show ORB Low (Default: OFF) - Display the low of each opening range in the table
- ☑️ Show Breakout+Retest (Default: ON) - Show bullish breakout confirmation status
- ☑️ Show Breakdown+Retest (Default: ON) - Show bearish breakdown confirmation status
Alert Options :
- ☑️ Enable 5-Min Alerts (Default: OFF) - Get alerts for 5-minute ORB confirmations
- ☑️ Enable 15-Min Alerts (Default: OFF) - Get alerts for 15-minute ORB confirmations
- ☑️ Enable 30-Min Alerts (Default: OFF) - Get alerts for 30-minute ORB confirmations
Visual Indicators :
- Green triangles (▲) below bars = Breakout confirmed (bullish)
- Red triangles (▼) above bars = Breakdown confirmed (bearish)
- Triangle sizes: Tiny (5-min), Small (15-min), Normal (30-min)
---
Table Legend:
Timeframe Row: Shows the three ORB periods being tracked
ORB High Row: (Optional) The highest price during each opening range period
ORB Low Row: (Optional) The lowest price during each opening range period
Breakout+Retest Row:
- 🟢 YES = Bullish setup confirmed (price broke high, retested, and confirmed)
- 🔴 NO = No confirmed bullish setup yet
- ⚪ N/A = Opening range not yet established
Breakdown+Retest Row:
- 🟢 YES = Bearish setup confirmed (price broke low, retested, and confirmed)
- 🔴 NO = No confirmed bearish setup yet
- ⚪ N/A = Opening range not yet established
How to Use :
1. Add to Chart - Works best on stocks, futures, and indices with regular market hours (9:30 AM EST open)
2. Choose Your Timeframe - View on any timeframe; indicator automatically analyzes 1-minute data
3. Monitor the Table - Watch for "YES" signals in Breakout or Breakdown rows
4. Set Alerts - Enable alerts for your preferred ORB timeframes
5. Plan Your Trade - Use ORB levels as entry points and initial stop-loss levels
Tips :
- Combine multiple timeframe confirmations for higher probability setups
- Use ORB High/Low levels as natural support/resistance zones
- The 5-min ORB gives faster signals; 30-min ORB gives stronger trends
- Best results typically occur in the first 1-2 hours after market open
- Works on all markets but optimized for regular trading hours (9:30 AM EST)
Key Features Summary :
✓ Multi-timeframe opening range tracking (5, 15, 30-minute)
✓ Retest confirmation logic to filter false breakouts
✓ Works on any chart timeframe with 1-minute precision
✓ Bullish and bearish signal detection
✓ Customizable visual display with toggle options
✓ Individual alerts for each timeframe and direction
✓ Clean, professional table interface
✓ No repainting - signals are final once confirmed
✓ Suitable for all experience levels

Chop + MSS/FVG Retest (Ace v1.6) – IndicatorWhat this indicator does
Name: Chop + MSS/FVG Retest (Ace v1.6) – Indicator
This is an entry model helper, not just a BOS/MSS marker.
It looks for clean trend-side setups by combining:
MSS (Market Structure Shift) using swing highs/lows
3-bar ICT Fair Value Gaps (FVG)
First retest back into the FVG
A built-in chop / trend filter based on ATR and a moving average
When everything lines up, it plots:
L below the candle = Long candidate
S above the candle = Short candidate
You pair this with a higher-timeframe filter (like the Chop Meter 1H/30M/15M) to avoid pressing the button in garbage environments.
How it works (simple explanation)
Chop / Trend filter
Computes ATR and compares each bar’s range to ATR.
If the bar is small vs ATR → more likely CHOP.
If the bar is big vs ATR → more likely TREND.
Uses a moving average:
Above MA + TREND → trendLong zone
Below MA + TREND → trendShort zone
MSS (Market Structure Shift)
Uses swing highs/lows (left/right bars) to track the last significant high/low.
Bullish MSS: close breaks above last swing high with displacement.
Bearish MSS: close breaks below last swing low with displacement.
Those events are marked as tiny triangles (MSS up/down).
A MSS only stays “valid” for a certain number of bars (Bars after MSS allowed).
3-bar ICT FVG
Bullish FVG: low > high
→ gap between bar 3 high and bar 2 low.
Bearish FVG: high < low
→ gap between bar 3 low and bar 2 high.
The indicator stores the FVG boundaries (top/bottom).
Retest of FVG
Watches for price to trade back into that gap (first touch).
That retest is the “entry zone” after the MSS.
Final Long / Short condition
Long (L) prints when:
Recent bullish MSS
Bullish FVG has formed
Price retests the bullish FVG
Environment = trendLong (ATR + above MA)
Not CHOP
Short (S) prints when:
Recent bearish MSS
Bearish FVG has formed
Price retests the bearish FVG
Environment = trendShort (ATR + below MA)
Not CHOP
So the L/S markers are “model-approved entry candles”, not just any random BOS.
Inputs / Settings
Key inputs you’ll see:
ATR length (chop filter)
How many bars to use for ATR in the chop / trend filter.
Lower = more sensitive, twitchy
Higher = smoother, slower to change
Max chop ratio
If barRange / ATR is below this → treat as CHOP.
Min trend ratio
If barRange / ATR is above this → treat as TREND.
Hide MSS/BOS marks in CHOP?
ON = MSS triangles disappear when the bar is classified as CHOP
Keeps your chart cleaner in consolidation
Swing left / right bars
Controls how tight or wide the swing highs/lows are for MSS:
Smaller = more sensitive, more MSS points
Larger = fewer, more significant swings
Bars after MSS allowed
How many bars after a MSS the indicator will still allow FVG entries.
Small value (e.g. 10) = MSS must deliver quickly or it’s ignored.
Larger (e.g. 20) = MSS idea stays “in play” longer.
Visual RR (for info only)
Just for plotting relative risk-reward in your head.
This is not a strategy tester; it doesn’t manage positions.
What you see on the chart
Small green triangle up = Bullish MSS
Small red triangle down = Bearish MSS
“L” triangle below a bar = Long idea (MSS + FVG retest + trendLong + not chop)
“S” triangle above a bar = Short idea (MSS + FVG retest + trendShort + not chop)
Faint circle plots on price:
When the filter sees CHOP
When it sees Trend Long zone
When it sees Trend Short zone
You do not have to trade every L or S.
They’re there to show “this is where the model would have considered an entry.”
How to use it in your trading
1. Use it with a higher-timeframe filter
Best practice:
Use this with the Chop Meter 1H/30M/15M or some other HTF filter.
Only consider L/S when:
Chop Meter = TRADE / NORMAL, and
This indicator prints L or S in the right location (premium/discount, near OB/FVG, etc.)
If higher-timeframe says NO TRADE, you ignore all L/S.
2. Location > Signal
Treat L/S as confirmation, not the whole story.
For shorts (S):
Look for premium zones (previous highs, OBs, fair value ranges above mid).
Want purge / raid of liquidity + MSS down + bearish FVG retest → then S.
For longs (L):
Look for discount zones (previous lows, OBs/FVGs below mid).
Want stop raid / purge low + MSS up + bullish FVG retest → then L.
If you see L/S firing in the middle of a bigger range, that’s where you skip and let it go.
3. Instrument presets (example)
You can tune the ATR/chop settings per instrument:
MNQ (noisy, 1m chart):
ATR length: 21
Max chop ratio: 0.90
Min trend ratio: 1.40
Bars after MSS allowed: 10
GOLD (cleaner, 3m chart):
ATR length: 14
Max chop ratio: 0.80
Min trend ratio: 1.30
Bars after MSS allowed: 20
You can save those as presets in the TV settings for quick switching.
4. How to practice with it
Open replay on a couple of days.
Check Chop Meter → if NO TRADE, just observe.
When Chop Meter says TRADE:
Mark where L/S printed.
Ask:
Was this in premium/discount?
Was there SMT / purge on HTF?
Did the move actually deliver, or did it die?
Screenshot the A+ L/S and the ugly ones; refine:
ATR length
Chop / trend thresholds
MSS lookback
Your goal is to get it to where:
The L/S marks show up mostly in the same places your eye already likes,
and you ignore the rest.

Tristan's Box: Pre-Market Range Breakout + RetestMarket Context:
This is designed for U.S. stocks, focusing on pre-market price action (4:00–9:30 AM ET) to identify key support/resistance levels before the regular session opens.
Built for 1 min and 5 min timelines, and is intended for day trading / scalping.
Core Idea:
Pre-market range (high/low) often acts as a magnet for price during regular hours.
The first breakout outside this range signals potential strong momentum in that direction.
Retest of the breakout level confirms whether the breakout is valid, avoiding false moves.
Step-by-Step Logic:
Pre-Market Range Identification:
Track high and low from 4:00–9:30 AM ET.
Draw a box spanning this range for visual reference and calculation.
Breakout Detection:
When the first candle closes above the pre-market high → long breakout.
When the first candle closes below the pre-market low → short breakout.
The first breakout candle is highlighted with a “YOLO” label for visual confirmation.
Retest Confirmation:
Identify the first candle whose wick touches the pre-market box (high touches top for short, low touches bottom for long).
Wait for the next candle: if it closes outside the box, it confirms the breakout.
Entry Execution:
Long entry: on the confirming candle after a wick-touch above the pre-market high.
Short entry: on the confirming candle after a wick-touch below the pre-market low.
Only the first valid entry per direction per day is taken.
Visuals & Alerts:
Box represents pre-market high/low.
Top/bottom box border lines show the pre-market high / low levels cleanly.
BUY/SELL markers are pinned to the confirming candle.
Added a "YOLO" marker on breakout candle.
Alert conditions trigger when a breakout is confirmed by the retest.
Strategy Type:
Momentum breakout strategy with confirmation retest.
Combines pre-market structure and risk-managed entries.
Designed to filter false breakouts by requiring confirmation on the candle after the wick-touch.
In short, it’s a pre-market breakout momentum strategy: it uses the pre-market high/low as reference, waits for a breakout, and then enters only after a confirmation retest, reducing the chance of entering on a false spike.
Always use good risk management.

QuantCrawler ORB Break & Retest 15m - Opening Range StrategyThis indicator automates the 15-minute Opening Range Breakout and Retest strategy. It captures the high, low, and midpoint of the first 15-minute candle, then monitors for confirmed breakouts followed by midpoint retests to generate entry signals.
HOW IT WORKS
1. Captures the high, low, and midpoint of the first 15-minute candle (default 8:00-8:15 premarket)
2. Waits for price to close beyond the OR high or low by your specified breakout distance
3. After breakout confirmation, monitors for price to pull back and touch the midpoint
4. Signals LONG after bullish breakout + midpoint retest
5. Signals SHORT after bearish breakout + midpoint retest
6. Resets after each signal allowing multiple setups per session
WHY 15-MINUTE ORB
The 15-minute Opening Range captures more price action than a 5-minute OR, often providing stronger support/resistance levels. The 8:00 AM default captures premarket activity before the 9:30 open, giving you levels established before the crowd arrives.
WHY BREAKOUT + RETEST
Entering on the initial breakout often results in chop and false signals. This indicator requires confirmation - price must first prove direction by closing beyond the breakout distance, then offer a pullback entry at the midpoint. This filters out many failed breakouts.
SETTINGS
- Breakout Distance - Points beyond OR zone required to confirm breakout
- Timezone - Select your market timezone
- Opening Range Time - Customizable (default 8:00-8:15)
- Session End Time - When to stop monitoring (default 4:00 PM)
VISUAL OUTPUT
- Green line - OR High
- Red line - OR Low
- Orange dotted line - OR Midpoint
- Status box displays current state (Watching, Active, Closed)
ALERTS
Built-in alerts for Long Entry, Short Entry, or Any Entry.
Works on any timeframe chart. The indicator pulls 15-minute data automatically using request.security().

Liquidity Sweep + BOS Retest System — Prop Firm Edition🟦 Liquidity Sweep + BOS Retest System — Prop Firm Edition
A High-Probability Smart Money Strategy Built for NQ, ES, and Funding Accounts
🚀 Overview
The Liquidity Sweep + BOS Retest System (Prop Firm Edition) is a precision-engineered SMC strategy built specifically for prop firm traders. It mirrors institutional liquidity behavior and combines it with strict account-safe entry rules to help traders pass and maintain funding accounts with consistency.
Unlike typical indicators, this system waits for three confirmations — liquidity sweep, displacement, and a clean retest — before executing any trade. Every component is optimized for low drawdown, high R:R, and prop-firm-approved risk management.
Whether you’re trading Apex, TakeProfitTrader, FFF, or OneUp Trader, this system gives you a powerful mechanical framework that keeps you within rules while identifying the market’s highest-probability reversal zones.
🔥 Key Features
1. Liquidity Sweep Detection (Stop Hunt Logic)
Automatically identifies when price clears a previous swing high/low with a sweep confirmation candle.
✔ Filters noise
✔ Eliminates early entries
✔ Locks onto true liquidity grabs
2. Automatic Break of Structure (BOS) Confirmation
Price must show true displacement by breaking structure opposite the sweep direction.
✔ Confirms momentum shift
✔ Removes fake reversals
✔ Ensures institutional intent
3. Precision Retest Entry Model
The strategy enters only when price retests the BOS level at premium/discount pricing.
✔ Zero chasing
✔ Extremely tight stop loss placement
✔ Prop-firm-friendly controlled risk
4. Built-In Risk & Trade Management
SL set at swept liquidity
TP set by user-defined R:R multiplier
Optional session filter (NY Open by default)
One trade at a time (no pyramiding)
Automatically resets logic after each trade
This prevents overtrading — the #1 cause of evaluation and account breaches.
5. Designed for Prop Firm Futures Trading
This script is optimized for:
Trailing/static drawdown accounts
Micro contract precision
Funding evaluations
Low-risk, high-probability setups
Structured, rule-based execution
It reduces randomness and emotional trading by automating the highest-quality SMC sequence.
🎯 The Trading Model Behind the System
Step 1 — Liquidity Sweep
Price must take out a recent high/low and close back inside structure.
This confirms stop-hunting behavior and marks the beginning of a potential reversal.
Step 2 — BOS (Break of Structure)
Price must break the opposite side swing with a displacement candle. This validates a directional shift.
Step 3 — Retest Entry
The system waits for price to retrace into the BOS level and signal continuation.
This creates optimal R:R entry with minimal drawdown.
📈 Best Markets
NQ (NASDAQ Futures) – Highly recommended
ES, YM, RTY
Gold (XAUUSD)
FX majors
Crypto (with high volatility)
Works best on 1m, 2m, 5m, or 15m depending on your trading style.
🧠 Why Traders Love This System
✔ No signals until all confirmations align
✔ Reduces overtrading and emotional decisions
✔ Follows market structure instead of random indicators
✔ Perfect for maintaining long-term funded accounts
✔ Built around institutional-grade concepts
✔ Makes your trading consistent, calm, and rules-based
⚙️ Recommended Settings
Session: 06:30–08:00 MST (NY Open)
R:R: 1.5R – 3R
Contracts: Start with 1–2 micros
Markets: NQ for best structure & volume
📦 What’s Included
Complete strategy logic
All plots, labels, sweep markers & BOS alerts
BOS retest entry automation
Session filtering
Stop loss & take profit system
Full SMC logic pipeline
🏁 Summary
The Liquidity Sweep + BOS Retest System is a complete, prop-firm-ready, structure-based strategy that automates one of the cleanest and most reliable SMC entry models. It is designed to keep you safe, consistent, and rule-compliant while capturing premium institutional setups.
If you want to trade with confidence, discipline, and prop-firm precision — this system is for you.
Good Luck -BG

Multi-Timeframe HTS Retest Strategy v6Multi-Timeframe HTS Retest Strategy v6 is a trend-following tool designed to detect high-probability retest entries aligned with higher timeframe direction. The indicator applies HTS bands (short & long) on both the current and higher timeframe (4x–8x multiplier) to confirm market bias.
A strong trend is validated when HTS bands separate on the higher timeframe. On the lower timeframe, the strategy tracks price behavior relative to the bands: after breaking outside, price must retest either the fast (blue) or slow (red) band, confirmed by a rejection candle. This generates precise BUY or SELL retest signals.
Features include flexible average methods (RMA, EMA, SMA, etc.), customizable cross detection (final cross, 4 crosses, or both), volume-based retest conditions, and clear visual signals (dots for trend start, triangles for retests). Alerts are integrated for automation.
This strategy is suitable for forex, crypto, indices, and stocks, supporting both scalping and swing trading.

Market Energy – Trend vs Retest (with Saturation %)Market Energy – Trend vs Retest Indicator
This indicator measures the bullish and bearish energy in the market based on volume-weighted price changes.
It calculates two smoothed energy waves — bullish energy and bearish energy — using exponential moving averages of volume-adjusted price movements.
The indicator detects trend changes and retests by comparing the relative strength of these waves.
A saturation percentage quantifies the intensity of the current dominant side (bulls or bears) relative to recent highs.
- High saturation (>70%) indicates strong momentum and dominance by bulls or bears.
- Low saturation (<30%) suggests weak momentum and possible market indecision or consolidation.
The background color highlights the current control: green for bulls, red for bears, with transparency indicating the saturation level.
A label shows which side is currently in control along with the saturation percentage for quick interpretation.
Use this tool to identify strong trends, possible retests, and momentum strength to support your trading decisions.

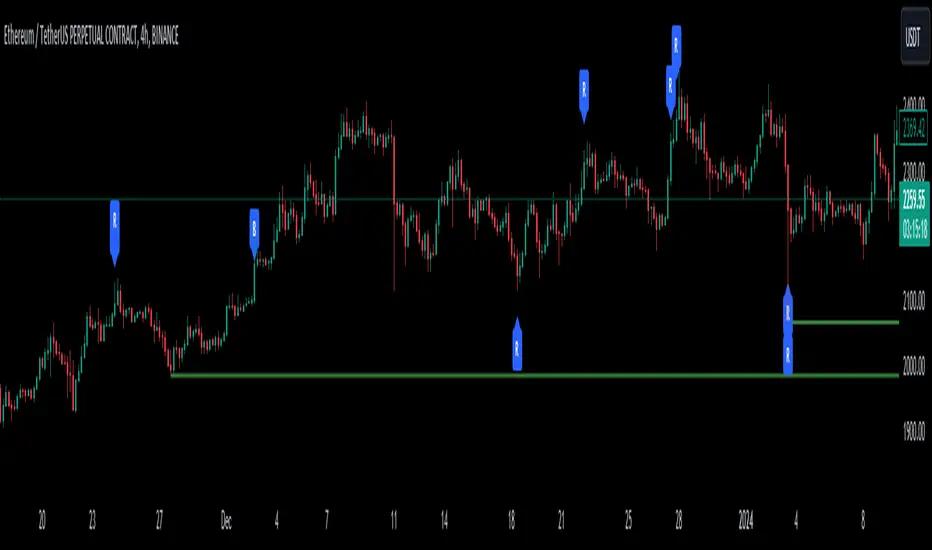
Support and Resistance with Signals [UAlgo]🔶 Description:
"Support and Resistance with Signals ", is designed to identify key support and resistance levels on a trading chart while also signaling potential retests (denoted as "R") and breakouts (denoted as "B"). The indicator dynamically plots support and resistance lines based on pivot points and adjusts them according to price action and sensitivity settings. It aims to assist traders in identifying significant price levels and potential reversal or breakout opportunities.
🔶 Key Features:
Pivot Points: The indicator calculates pivot highs and pivot lows based on a specified period length (Checks Left and Right bars). Adjust the length of the pivot period to control the sensitivity of support and resistance levels according to the your preferences.
Support and Resistance Lines: It plots support and resistance lines at the pivot high and pivot low points, respectively.
Retest and Breakout Signals: Signals are generated based on the sensitivity setting, which adds/subtracts a portion (half) of the Average True Range (ATR) to the pivot points. A retest signal ("R") is generated when the price approaches the support or resistance level within the sensitivity range. A breakout signal ("B") is generated when the price surpasses the support or resistance level.
Sensitivity (ATR Length): Modify the retest-breakout sensitivity length to fine-tune the generation of signals based on price volatility.
Maximum Lines : Limit the number of support and resistance lines displayed on the chart for clarity.
Line Colors and Width: Customize the colors and width of support and resistance lines for better visualization.
More Examples:
Before Retest Signal:
When the price enters the retest range at the specified sensitivity:
Disclaimer:
This indicator is provided for informational purposes only and should not be considered as financial advice. Trading involves risk, and users should conduct their own research and analysis before making any investment decisions. The retest and breakout signals generated by this indicator are based on historical price data and may not guarantee future results. Users should exercise caution and use additional confirmation methods before entering any trades based on the signals provided by this indicator.
Happy Trading !
Liquidity Retest Strategy (Apicode) - TP/SL Lines FixedTechnical Documentation:
1. Purpose and underlying concept
This strategy targets a common behavior in liquid markets: liquidity sweeps around meaningful support/resistance levels, followed by a retest and rejection (reversal) with confirmation.
The core thesis is that many initial “breaks” are not continuation moves, but rather stop-runs and order harvesting. After the sweep, price reclaims the level and closes back on the opposite side, offering a structured entry with defined risk.
The strategy includes:
Support/Resistance detection via pivots
Dynamic selection of the “working” level using an ATR-based proximity window
Rejection validation via candle structure (wick + close)
Optional filters: volume, VWAP-like bias, and EMA trend
Risk management with static TP/SL (ATR-based or %), plus trailing stop (ATR-based or %), with per-trade lines plotted
2. Main components
2.1. Volatility metric: ATR
atr = ta.atr(atrLength) is used in two essential places:
Level selection (proximity to S/R): prevents trading levels that are too far from current price.
Sweep validation (minimum wick size): requires the wick to extend beyond the level by a volatility-relative amount.
Optionally, ATR can also be used for:
Static TP/SL (when usePercent = false)
Trailing stop (when useTrailPercent = false)
2.2. Building S/R levels with pivots
Pivots are detected using:
pivotHigh = ta.pivothigh(pivotLookback, rightBars)
pivotLow = ta.pivotlow(pivotLookback, rightBars)
Each confirmed pivot is stored in arrays:
resistanceLevels for resistance
supportLevels for support
The array size is capped by maxLevels, which reduces noise and manages chart resource usage (lines).
2.3. Selecting the “best” level each bar
On each bar, a single support S and/or resistance R candidate is chosen:
Support: nearest level below price (L < price)
Resistance: nearest level above price (L > price)
Only levels within atr * maxDistATR are considered
This produces dynamic “working levels” that adapt to price location and volatility.
2.4. Rejection pattern (retest + sweep)
After selecting the working level:
Support rejection (long setup)
Conditions:
Low touches/crosses support: low <= S
Close reclaims above: close > S
Bullish candle: close > open
Sufficient wick below the level (liquidity sweep): (S - low) >= atr * minWickATR
This aims to capture a stop sweep below support followed by immediate recovery.
Resistance rejection (short setup)
Symmetric conditions:
High touches/crosses resistance: high >= R
Close rejects back below: close < R
Bearish candle: close < open
Sufficient wick above the level: (high - R) >= atr * minWickATR
2.5. Optional filters
Final signals are the rejection pattern AND enabled filters:
1.- Volume filter
High volume is defined as: volume > SMA(volume, 20) * volMult
When useVolFilter = true, setups require relatively elevated participation
2.- VWAP-like bias filter
A VWAP-like series is computed over vwapLength (typical price weighted by volume)
When useVWAPFilter = true:
- Longs only if close > vwap
- Shorts only if close < vwap
3.- EMA trend filter
Uptrend if EMA(fast) > EMA(slow)
When useTrendFilter = true:
- Longs only in uptrend
- Shorts only in downtrend
2.6. Backtest time window (time filter)
To keep testing focused and reduce long-history noise:
useMaxLookbackDays enables the filter
maxLookbackDays defines how many days back from timenow entries are allowed
Entries are permitted only when time >= startTime.
3. Entry rules and position control
3.1. Entries
strategy.entry('Long', strategy.long) when longSetup and no long position is open
strategy.entry('Short', strategy.short) when shortSetup and no short position is open
No pyramiding is allowed (pyramiding = 0). Position gating is handled by:
Long allowed if strategy.position_size <= 0
Short allowed if strategy.position_size >= 0
4. Risk management: TP/SL and trailing (with plotted lines)
4.1. Detecting entry/exit events
Events are identified via changes in strategy.position_size:
LongEntry: transition into a long
shortEntry: transition into a short
flatExit: transition back to flat
This drives per-trade line creation, updates, and cleanup of state variables.
4.2. Static TP/SL
On entry, entryPrice := strategy.position_avg_price is stored.
Percent mode (usePercent = true)
Long:
staticSL = entryPrice*(1 - slPerc/100)
staticTP = entryPrice*(1 + tpPerc/100)
Short:
staticSL = entryPrice*(1 + slPerc/100)
staticTP = entryPrice*(1 - tpPerc/100)
ATR mode (usePercent = false)
Long:
staticSL = entryPrice - atrAtEntry*slATR
staticTP = entryPrice + atrAtEntry*tpATR
Short:
staticSL = entryPrice + atrAtEntry*slATR
staticTP = entryPrice - atrAtEntry*tpATR
4.3. Trailing stop (custom)
While a position is open, the script tracks the most favorable excursion:
Long: hhSinceEntry = highest high since entry
Short: llSinceEntry = lowest low since entry
A trailing candidate is computed:
Percent trailing (useTrailPercent = true)
Long: trailCandidate = hhSinceEntry*(1 - trailPerc/100)
Short: trailCandidate = llSinceEntry*(1 + trailPerc/100)
ATR trailing (useTrailPercent = false)
Long: trailCandidate = hhSinceEntry - atr*trailATR
Short: trailCandidate = llSinceEntry + atr*trailATR
Then the effective stop is selected:
Long: slUsed = max(staticSL, trailCandidate) when useTrail is enabled
Short: slUsed = min(staticSL, trailCandidate) when useTrail is enabled
If useTrail is disabled, slUsed remains the static stop.
Take profit remains static:
tpUsed = staticTP
Exit orders are issued via:
strategy.exit(..., stop=slUsed, limit=tpUsed)
4.4. Per-trade TP/SL lines
On each entry, two lines are created (SL and TP) via f_createLines().
During the trade, the SL line updates when trailing moves the stop; TP remains fixed.
On exit (flatExit), both lines are finalized on the exit bar and left on the chart as historical references.
This makes it straightforward to visually audit each trade: entry context, intended TP, and trailing evolution until exit.
5. Visualization and debugging
BUY/SELL labels with configurable size (xsize)
Debug mode (showDebug) plots the chosen working support/resistance level each bar
Stored pivot levels are drawn using reusable line slots, projected a fixed 20 bars to the right to keep the chart readable and efficient
6. Parameter guidance and practical notes
pivotLookback / rightBars: controls pivot significance vs responsiveness. Lower rightBars confirms pivots earlier but can increase noise.
maxDistATR: too low may reject valid levels; too high may select distant, less relevant levels.
minWickATR: key quality gate for “real” sweeps. Higher values reduce frequency but often improve signal quality.
Filters:
Volume filter tends to help in ranges and active sessions.
VWAP bias is useful intraday to align trades with session positioning.
EMA trend filter is helpful in directional markets but may remove good mean-reversion setups.
Percent TP/SL: provides consistent behavior across assets with variable volatility, but is less adaptive to sudden regime shifts.
Percent trailing: can capture extensions well; calibrate trailPerc per asset/timeframe (too tight = premature exits).
7. Known limitations
Pivot-derived levels are a heuristic; in strong trends, valid retests may be limited.
The time filter uses timenow; behavior may vary depending on historical context and how the platform evaluates “current time.”
TP/SL and trailing are computed from bar OHLC; in live trading, intrabar sequencing and fills may differ from bar-close simulation.

ORB 5 Min Break & Retest + Alerts By Khan 0.1 verORB 5-Minute Break & Retest Indicator
This indicator plots the high and low of the first 5-minute candle of the trading session (Opening Range). It then monitors price for a breakout above or below the ORB levels and triggers an alert when price retests the broken level and holds.
Designed to help identify high-probability ORB continuation setups with clear visual levels and TradingView alerts.

ORB 5 Min Break & Retest + Alerts By KhanORB 5-Minute Break & Retest Indicator
This indicator plots the high and low of the first 5-minute candle of the trading session (Opening Range). It then monitors price for a breakout above or below the ORB levels and triggers an alert when price retests the broken level and holds.
Designed to help identify high-probability ORB continuation setups with clear visual levels and TradingView alerts.
If you want, I can also:
Make it even shorter (1–2 lines)
Write a more detailed TradingView public script description
Add a usage guide (rules + best timeframe)
Disclaimer:
This is general information only and not financial advice. For personal guidance, please talk to a licensed professional.

EMA Break & Retest + Trend TableThis script is designed to identify potential buy and sell trading opportunities based on 21 EMA (Exponential Moving Average) break and retest patterns, with confirmation from multi-timeframe trend analysis. It combines actionable signal generation with a clean, real-time trend overview table.
✅ 1. EMA Break & Retest Logic
Detects when the price crosses above or below the 21 EMA and then closes in the direction of the breakout.
Generates buy signals on upward break/retest, and sell signals on downward break/retest.
✅ 2. Multi-Timeframe Confirmation
Filters signals using higher timeframe trends to avoid false entries.
Buy signals are shown only if the 1H or 4H trend is bullish.
Sell signals are shown only if the 1H or 4H trend is bearish.
✅ 3. Visual Signal Plotting
Displays green "BUY" labels below bars and red "SELL" labels above bars.
Users can toggle buy/sell signals on or off with checkboxes.
✅ 4. Alerts
Built-in alertcondition() functions allow traders to set real-time alerts when buy or sell signals are triggered.
✅ 5. Multi-Timeframe Trend Table
A dynamic table appears in the top-right corner showing trend status across:
Daily (D)
4 Hour (4H)
1 Hour (1H)
15 Minute (15M)
5 Minute (5M)
Each timeframe is marked as Bullish (green) or Bearish (red) depending on the current price vs. 21 EMA.
The latest signal (“BUY” / “SELL” / “—”) is displayed at the bottom of the table.
Inversion Fair Value Gaps (IFVG) [LuxAlgo]The Inversion Fair Value Gaps (IFVG) indicator is based on the inversion FVG concept by ICT and provides support and resistance zones based on mitigated Fair Value Gaps (FVGs).
🔶 USAGE
Once mitigation of an FVG occurs, we detect the zone as an "Inverted FVG". This would now be looked upon for potential support or resistance.
Mitigation occurs when the price closes above or below the FVG area in the opposite direction of its bias.
Inverted Bullish FVGs Turn into Potential Zones of Resistance.
Inverted Bearish FVGs Turn into Potential Zones of Support.
After the FVG has been mitigated, returning an inversion FVG, a signal is displayed each time the price retests an IFVG zone and breaks below or above (depending on the direction of the FVG).
Keep in mind how IFVGs are calculated and displayed. Once price mitigates an IFVG, all associated graphical elements such as areas, lines, and signals will be deleted.
This indicator is not meant to be just a 'signal indicator'. Backtesting historical signals is incorrect as it does not consider the mitigation of IFVGs, which is a standard method for trading IFVGs & various concepts by ICT.
The signals displayed are meant for real-time analysis of current bars for discretionary analysis. Current confirmed retests of unmitigated IFVGs are still displayed to show which IFVGS have had significant reactions.
🔶 SETTINGS
Show Last: Specifies the number of most recent FVG Inversions to display in Bullish/Bearish pairs, starting at the current and looking back. Max 100 Pairs.
Signal Preference: Allows the user to choose to send signals based on the (Wicks) or (Close) Prices. This can be changed based on user preference.
ATR Multiplier: Filters FVGs based on ATR Width, The script will only detect Inversions that are greater than the ATR * ATR Width.
🔶 ALERTS
This script includes alert options for all signals.
🔹 Bearish Signal
A bearish signal occurs when the price returns to a bearish inversion zone and rejects to the downside.
🔹 Bullish Signal
A bullish signal occurs when the price returns to a bullish inversion zone and bounces out of the top.

TouchedLibrary "Touched"
Breakout(zone, lookback)
Tells if the zone has been broken on the current bar.
Parameters:
zone (Zone) : The definitiin of the zone.
lookback (int) : How many bars to look back.
Returns: a Touch object that tells if the zone has been broken up or down.
FalseBreakout(zone, lookback)
Tells if the zone has a false breakout on the current bar.
Parameters:
zone (Zone) : The definitiin of the zone.
lookback (int) : How many bars to look back.
Returns: a Touch object that tells if the zone has had a false breakout up or down.
Retest(zone, lookback)
Tells if the zone has been retested on the current bar.
Parameters:
zone (Zone) : The definitiin of the zone.
lookback (int) : How many bars to look back.
Returns: a Touch object that tells if the zone has been retested up or down.
Zone
Fields:
High (series__float)
Low (series__float)
BaseTime (series__integer)
Touch
Fields:
Up (series__bool)
Down (series__bool)

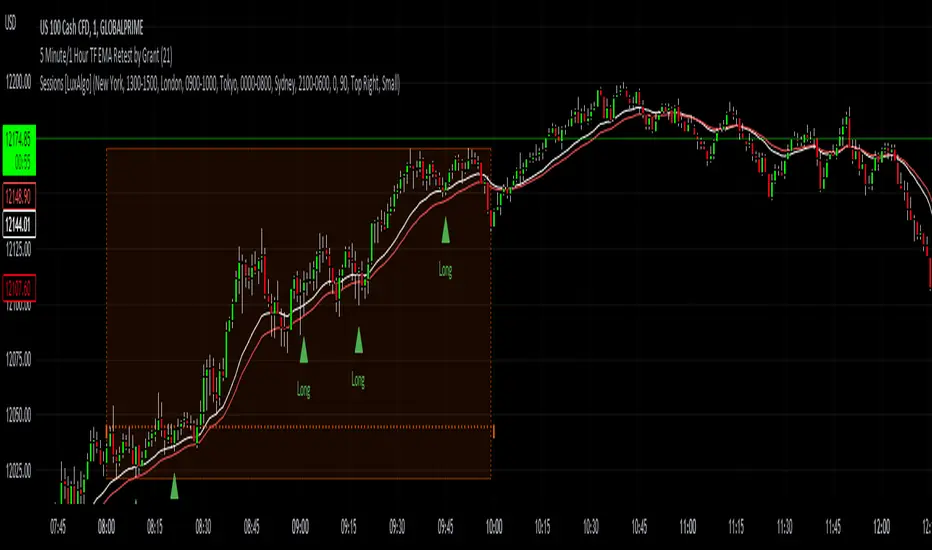
5 Minute TF 200 EMA Retest by Grantwww.tradingview.com
This indicator is a simple script meant to find retests on the 200 period moving average. It's current state is optimized for the 5 minute timeframe.
This works in all markets and all timeframes as long as you adjust certain rules for higher timeframes.
It's strengths and weaknesses
- Good at trend continuation in strong markets
- Bad in ranging markets (not surprising)
How does it work?
- It first identifies an overall trend by using the 200 ema.
- For long positions, it waits for price to close below the 200 ema, and then shortly closing back above the ema. For short positions its the opposite.
- For lower timeframes there are some other factors that help filter out bad signals that include:
- Makes sure that volume is increasing.
- Makes sure that volume is higher than average volume.
- For higher timeframes, the more specific factors aren't required.
How to use this indicator:
- Green triangles mean long positions
- Red triangles mean short positions
- Always trade with stoplosses and never risk too much of your account, please practice proper risk managment.
DISCLAIMER: Trading is inherently dangerous and carries lot's of risk. What you decide to do with my script has nothing to do with me. I am not responsible for any financial gains or losses made using this script. It is important to recognize other factors in the market to make better decisions.
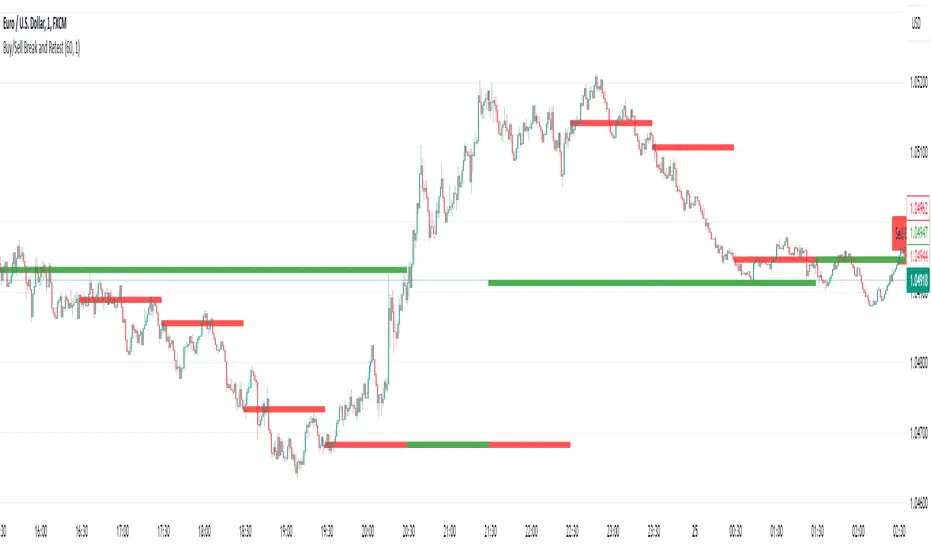
Buy/Sell Break and RetestThis script is a Pine Script indicator for TradingView titled **"Buy/Sell Break and Retest"**. Here's a description of its functionality:
### Purpose:
The script identifies potential **buy** and **sell entry levels** based on break-and-retest patterns in the market. It works by analyzing higher timeframe data (e.g., 1-hour) and marking entries on a lower timeframe (e.g., 1-minute).
### Key Features:
1. **Configurable Timeframes**:
- `Analysis Timeframe`: Used for identifying break-and-retest signals (default: 1-hour).
- `Entry Timeframe`: Used for marking and plotting entries (default: 1-minute).
2. **Buy and Sell Signals**:
- A **sell entry** is triggered when a bearish candle (close < open) is identified in the analysis timeframe.
- A **buy entry** is triggered when a bullish candle (close > open) is identified in the analysis timeframe.
3. **Retest Logic**:
- For sell signals: The retest is validated when the price breaks below the identified sell level.
- For buy signals: The retest is validated when the price breaks above the identified buy level.
4. **Visual Indicators**:
- Entry levels are marked with labels:
- **Buy Entry**: Green labels are placed at bullish candle opens.
- **Sell Entry**: Red labels are placed at bearish candle closes.
- Plots the levels for easy reference:
- **Sell Level**: Displayed as red circles on the chart.
- **Buy Level**: Displayed as green circles on the chart.
5. **Dynamic Updates**:
- Levels are cleared when invalidated by the price action.
### Use Case:
This indicator helps traders spot break-and-retest opportunities by:
- Allowing higher timeframe analysis to determine trend direction and key levels.
- Providing actionable buy and sell entry points on lower timeframes for precision.
Let me know if you'd like further clarification or improvements!
Prince Break and RetestHow to use the new visuals (super simple)
When the script prints RETEST BUY or RETEST SELL, you will instantly see:
ENTRY line (lime)
SL line (orange)
TP1 line (teal)
TP2 line (purple)
Entry Mode options
Close = enter at the close of the retest signal candle (simplest)
Box Edge = enter at the box edge (more “limit-order-ish”)
For your style (break + retest), start with Close.

4H Confirmation + 1H SFP BOS Retest4H Confirmation + 1H Entry (SFP + BOS + Retest)Run it on 1H
Uses 4H EMAs for higher-timeframe direction (confirmation)
Uses 1H SFP + BOS + retest + RSI for entries
This gives you more trades, still guided by the 4H trend

Break & Retest + Liquidity Sweep EntryIdentify a BOS (vertical line appears).
Wait for price to retest the broken level (circle shows up).
Optionally confirm with liquidity sweep.
Enter long/short trades based on bullish/bearish retest signals.
Use ATR or personal risk management for stop-loss placement.

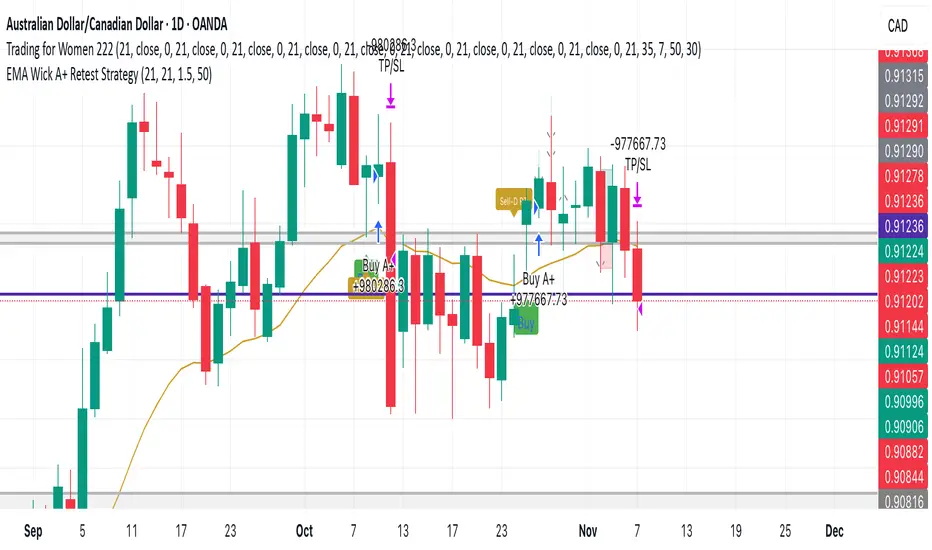
EMA Wick A+ Retest StrategyThe EMA Wick A+ Retest Strategy is a precision pullback system built for high-probability trend entries. It uses a combination of:
EMA 21 dynamic trend filtering
ATR-based stop-loss and reward targeting (1:1.5 RR)
Wick retest logic, where the lower wick must touch the EMA and represent at least 50% of the candle's range
Optional filter: RSI > 50 for bullish momentum confirmation
This strategy is designed to capture institutional-style entries after a clean pullback in an uptrend.
✅ Clean signals
✅ High risk-to-reward setups
✅ Built for swing trading or intraday with strong trend bias
Ideal for Forex, Crypto, and Indices.
Use responsibly. Backtest before live trading.
Enhanced OB Retest Strategy v7.0The OB Retest Strategy is a full Order Block retest trading system that detects, plots, and trades OB zones across multiple timeframes. It uses structure breaks, retrace depth, and ATR filters to identify strong reversal or continuation setups.
⸻
⚙️ Core Features
• Multi-timeframe OB detection using break-of-structure (BOS) logic
• Automatic zone creation for bullish and bearish order blocks
• Smart merging of overlapping OB zones
• Dynamic flip-zone logic that turns invalidated OBs into new zones
• Wick zone detection for high-precision entries
• ATR-based trailing stop and optional breakeven
• Adjustable retrace depth, breakout %, and ATR filters
• Built-in performance table showing PnL, win rate, and total trades
• Fully backtestable with date range and commission control
⸻
🧠 Logic Summary
1. Detects a BOS on the higher timeframe.
2. Identifies the last opposing candle as the valid OB.
3. Validates the OB based on ATR size and breakout strength.
4. Waits for price to retest the zone to a set depth.
5. Executes trades and manages exits using trailing stop or breakeven.
6. Flips invalidated zones automatically.
⸻
💡 Usage Tips
• Best used on 1H to 4H charts for swing setups.
• Tune ATR and breakout thresholds for your market’s volatility.
• Combine with higher-timeframe bias or liquidity levels for better accuracy.
⸻
⚠️ Notes
• For educational and testing purposes only.
• Backtested results do not predict future performance.
• Always test before live use.

Trishul Tap Signals (v6) — Liquidity Sweep + Imbalanced RetestTrishul Tap Signals — Liquidity Sweep + Imbalanced Retest
Type: Signal-only indicator (non-repainting)
Style: Price-action + Liquidity + Trend-following
Best for: Intraday & Swing Trading — any liquid market (stocks, futures, crypto, FX)
Timeframes: Any (5m–1D recommended)
Concept
The Trishul Tap setup is a liquidity-driven retest play inspired by order-flow and Smart Money Concepts.
It identifies one-sided impulse candles that also sweep liquidity (grab stops above/below a recent swing), then waits for price to retest the origin of that candle to enter in the trend direction.
Think of it as the three points of a trident:
Trend filter — Only signals with the prevailing trend.
Liquidity sweep — Candle takes out a recent swing high/low (stop-hunt).
Imbalanced retest — Price taps the candle’s open/low (bull) or open/high (bear).
Bullish Setup
Trend Filter: Price above EMA(200).
Impulse Candle:
Green close.
Upper wick ≥ (wickRatio × lower wick).
Lower wick ≤ (oppWickMaxFrac × full range).
Liquidity Sweep: Candle’s high exceeds the highest high of the last sweepLookback bars (excluding current).
Tap Entry: Buy signal triggers when price later taps the candle’s low or open (user choice) within expireBars.
Bearish Setup
Trend Filter: Price below EMA(200).
Impulse Candle:
Red close.
Lower wick ≥ (wickRatio × upper wick).
Upper wick ≤ (oppWickMaxFrac × full range).
Liquidity Sweep: Candle’s low breaks the lowest low of the last sweepLookback bars (excluding current).
Tap Entry: Sell signal triggers when price later taps the candle’s high or open (user choice) within expireBars.
Inputs
Trend EMA Length: Default 200.
Sweep Lookback: Number of bars for liquidity sweep check (default 20).
Wick Ratio: Required size ratio of dominant wick to opposite wick (default 2.0).
Opposite Wick Max %: Opposite wick must be ≤ this fraction of the candle’s range (default 25%).
Tap Tolerance (ticks): How close price must come to the level to count as a tap.
Expire Bars: Max bars after setup to allow a valid tap.
One Signal per Level: If ON, a base is “consumed” after first signal.
Plot Tap Levels: Show horizontal lines for active bases.
Show Setup Labels: Mark the origin sweep candle.
Plots & Visuals
EMA Trend Line — trend filter reference.
Tap Levels —
Green = bullish base (origin candle’s low/open).
Red = bearish base (origin candle’s high/open).
Labels — Show where the setup candle formed.
Signals —
BUY: triangle-up below bar at bullish tap.
SELL: triangle-down above bar at bearish tap.
Alerts
Two built-in conditions:
BUY Signal (Trishul Tap) — triggers on bullish tap.
SELL Signal (Trishul Tap) — triggers on bearish tap.
Set via Alerts panel → Condition = this indicator → Choose signal type.
How to Trade It
Use in liquid markets with clean price structure.
Confirm with HTF structure, volume spikes, or other confluence if desired.
Place stop just beyond the tap level (or ATR-based).
Target 1–2R or trail behind structure.
Why It Works
Liquidity sweep traps traders entering late (breakout buyers or panic sellers) and forces them to exit in the opposite direction, fueling your entry.
Wick imbalance confirms directional aggression by one side.
Trend filter keeps you aligned with the market’s dominant flow.
Retest entry lets you enter at a better price with reduced risk.
Non-Repainting
Setups form only on confirmed bar closes.
Signals trigger only on later bars that tap the stored level.
No lookahead functions are used.
Disclaimer
This script is for educational purposes only and does not constitute financial advice. Test thoroughly in a simulator or demo before using in live markets. Trading involves risk.
