Pivot Points 17 - StandardDisclaimer!
-This indicator doesn't tell you the market condition (BUY or SELL)
Cons!
- Totally dependent on your knowledge
Pros!
- Projects the Key Levels of a single time frame on the chart
Usage!
- Watch out for rejections at these levels
- Identify breakouts at these levels with strong confirmation like RETEST (as Level Role Reversal)
Search in scripts for "retest"

Milan OscillatorBill Williams Breakout Setup
I have referred to the man multiple times whether tweeting about him or writing a blog post. Now I want to relearn how breakout trading works, again. A while ago, my friend invited a bunch of us into a Zoom conference sharing us how his setup works for him. He reintroduced me to Bill Williams' indicators which looked like below.
The rules are simple:
Prices are moving away from Alligator, open and closed above the first time.
AC is twice consecutively at par with the direction.
AO is twice consecutively at par with the direction.
Entry on the third candle to be sure, or the second if you're willing to risk it.
The chart above is an example from the 4 hourly time-frame. Before going into any entry, to get a macro perspective, should check on these time-frames first:
Weekly
3 Days
Daily
Bonus points if monthly time-frame is also at par with the bias. Here are the charts for the larger time-frame.
It's been profitable trading with the above setup but then I have an itch to scratch. I wanted to have just a single oscillator instead of two to look at. It will enable me to make decisions faster and can use my brain juice to think about something else.
So I combined the two to create a new oscillator. I call it the `Milan Oscillator` in honor of my friend Patris who reintroduced me to Bill Williams yet again. Patris' favorite team is AC Milan, here's to you bro 🍺
Here are the same charts above with Milan Oscillator.
The rules are a bit different than the rules above:
No entry when the oscillator is gray, this means AC and AO are disagreeing.
Prices are moving away from Alligator, open and closed above the first time.
Oscillator is twice consecutively at par with the direction.
Entry on the third candle to be sure, or the second if you're willing to risk it.
On lower volume moves, prices will retest alligator, can be an entry if the retest fails.
Feedbacks are appreciated.

Pivot Points with Monthly and Weekly optionsA pivot point indicator that has possibility to see even the monthly or the weekly pivot points .
Pivot points are very powerful if used in correct way.
most of the time the price can be rejected from the pivot point or if the price break it it will be a nice entry if retest the pivot
R2/S2 are a very strong pivots to break but of course you need a certain distance between the pivot

Montly Pivot Points indicatorA pivot point indicator that has possibility to see even the monthly or the weekly pivot points.
Pivot points are very powerful if used in correct way.
most of the time the price can be rejected from the pivot point or if the price break it it will be a nice entry if retest the pivot
R2/S2 are a very strong pivots to break but of course you need a certain distance between the pivot.

Simple EMA trend indicatorSimple EMA trend indicator , pretty straightforward green equates to bullish and usually a retest/wick is often seen , same for the flipside viceversa

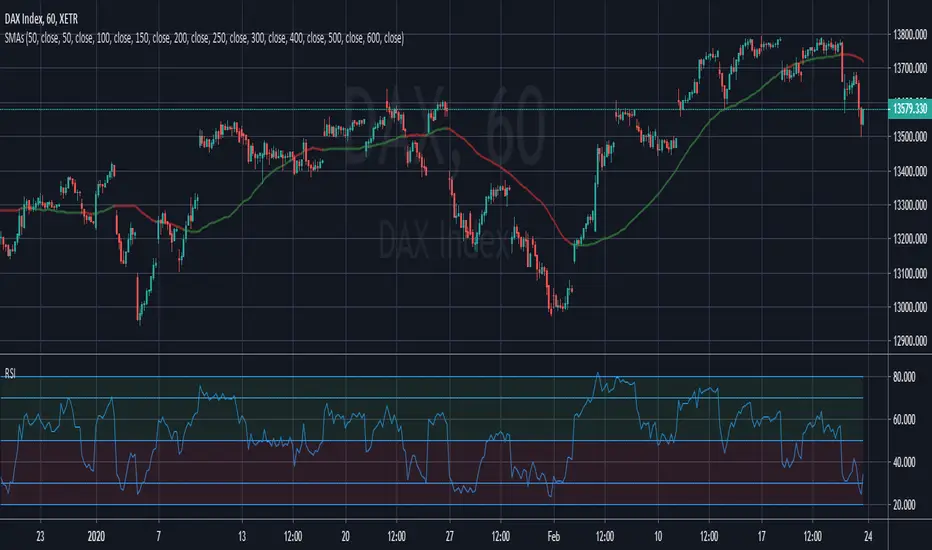
RSI with plot linesThis is my first script it's pretty simple, the plots are as follows:
80 = Sell
70 = Pending sell
50 = Pullback / Retest
30 = Pending buy
20 = Buy
I would add the text to the plot lines but not sure how, if anyone has away. Please comment and I'll update.
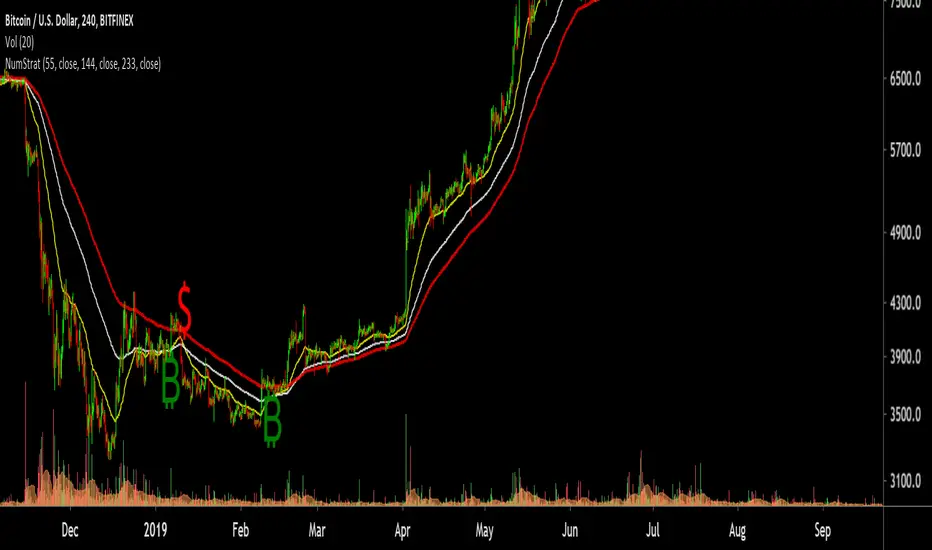
Number StrategyA simple strategy based on fib ratios and numbers
Best time frames for highest accuracy ( Requires Tradingview Pro )
34 mins for quick scalps
89 mins for weekly Swings
254 mins for monthly swings
-Ability to set alerts for btc and $ singals
-Modify Ema values, Set colour
-Trend following strategy, Needs an active trend for best results
-sideways/choppy action results in bad signals
How to trade:
-----------------
Long if Btc signal appears , preferred if price is trading above the 233 EMA .
You can use the 233 EMA for activating trades during price retest
Short if $ signal appears , preferred if price is trading Below the 233 EMA .
You can use the 233 EMA for activating trades during price retest
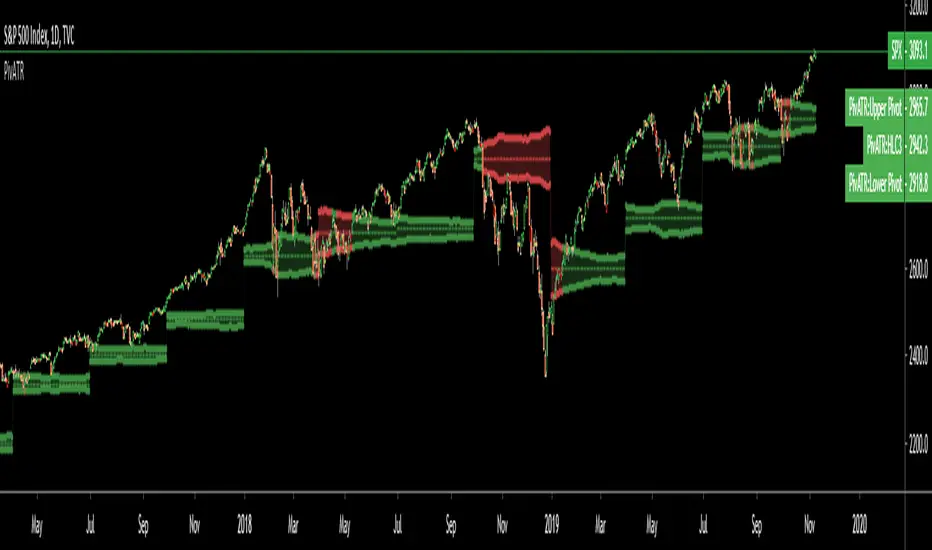
Adaptive Pivot (HLC3)SUMMARY:
Standard Pivot (HLC3) with ATR leeway added to make it adaptive to market volatility.
DESCRIPTION:
Adaptive Pivot is an indicator utilizing the simplicity of HLC3 Pivots as a turning point (and sometimes a trend indicator) while addressing it's fixed and inflexible nature.
Because the indicator is just a single line in the chart, the price may go near it but never touch it. Or it can go pass through it and never retest it again. In an attempt to lessen these from occurring, we can combine pivots with average true range (ATR). This is the specific formula I applied in this indicator:
>Upper Pivot = HLC3 + ATR
>Lower Pivot = HLC3 - ATR
This creates a kind of a range or cloud around the Pivot, making it possibly a more accurate indicator for market turning points.
ADJUSTABLE PARAMETERS:
The usual ATR parameters are included in this indicator:
>ATR_Length = input(14, title="ATR Length", minval=1)
>ATR_Smoothing = input(title="ATR Smoothing", defval="RMA", options="RMA", "SMA", "EMA", "WMA")
Added to the usual ones is this:
>ATR_Multiplier = input(1, title="ATR Multiplier", minval=0.1)
which modifies the extent of the ATR (similar to Chandelier Exit) as it is added/subtracted from the pivot values.
Pivot’s timeframe is also adjustable:
>Pivot_Timeframe = input("3M", title='Pivot Resolution')
Note: I did not lock the type to input.resolution to allow for more possible timeframes.
OTHER PARAMETERS
Indicator color will change to green when the open is above the HLC3 Pivot and change to red when the reverse is true.
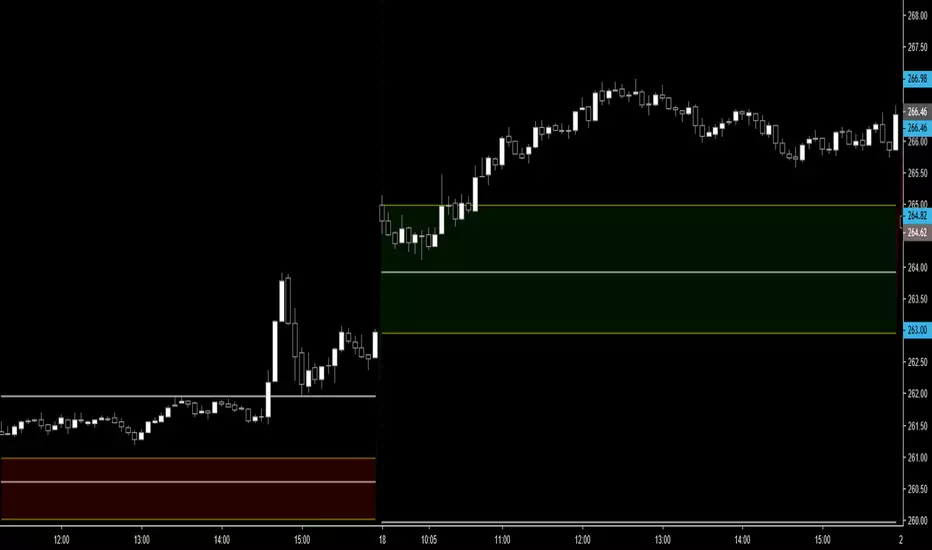
Current Open/Previous High Low Close. Gap HighlightedThis script plots the current open previous high low close. Also the area between the current open and previous close are highlighted to easily see the overnight gap. The idea is that after a significant gap the price will retest previous days levels before continuing in the direction of the gap.
RSI|The Wave PrincipleThe Wave Principle | Modified RSI
30 green | 70 red = Strong Movement (Possible Impulse)
20 cyan | 80 Yellow = Strongest Movement
Support and Resistance Level (Trend Continuation)
Uptrend= 40
Downtrend = 60
Break+Retest = BR
Div = Divergence (Change in trend)
--------------------------------------------
This indicator has been modified from original RSI to fit Wave Principle characteristics:
Uptrend Impulsive Wave over 70 RSI it changes color to red, and > 80 yellow stronger impulse | Usually means continuation, at least once more.
Downtrend Impulsive Wave under 30 RSI it changes color to green, and < 20 cyan stronger impulse | Usually means continuation, at least once more.
Once RSI reached these levels, it doesn't mean trend reversal but a correction is expected. If it shows divergence along with an Ending Diagonal, it's a confirmation for trend reversal.
In a corrective wave, levels 40-60 represents support and resistance levels where price won't go further. Indicating Corrective Waves, not as strong as Impulsives.
Prices can breakout RSI trend lines and retest from the other side before continue the new trend as also described in the Wave Principle.
--------------------------------------------

RSI with Visual Buy/Sell Setup | Corrective/Impulsive IndicatorRSI with Visual Buy/Sell Setup | 40-60 Support/Resistance | Corrective/Impulsive Indicator v2.15
|| RSI - The Complete Guide PDF ||
Modified Zones with Colors for easy recognition of Price Action.
Resistance @ downtrend = 60
Support @ uptrend = 40
Over 70 = Strong Bullish Impulse
Under 30 = Strong Bearish Impulse
Uptrend : 40-80
Downtrend: 60-20
--------------------
Higher Highs in price, Lower Highs in RSI = Bearish Divergence
Lower Lows in price, Higher Lows in RSI = Bullish Divergence
--------------------
Trendlines from Higher/Lower Peaks, breakout + retest for buy/sell setups.
###################
There are multiple ways for using RSI, not only divergences, but it confirms the trend, possible bounce for continuation and signals for possible trend reversal.
There's more advanced use of RSI inside the book RSI: The Complete Guide
Go with the force, and follow the trend.
"The Force is more your friend than the trend"
