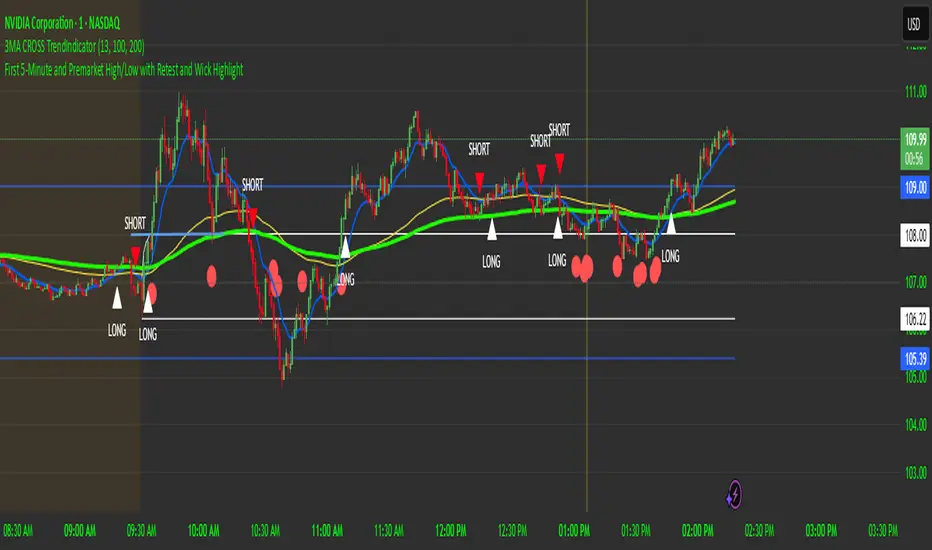
First 5-Minute Premarket High/Low Break RetestDay trading method that uses the 5 minute candle high and low but trade on the 1 minute chart.
This is a break and retest trading strategy based on the market open 5 minute high and low candle.
Additional levels would be the premarket high and low plotted in blue on the chart. It's not uncommon for the 5 minute to be near the premarket high and low zone.
The break and restest of the 5 minute white lines either to the downside or upside. Once a hammer or long wick candle forms near or touching the retest of the 5 minute line that indicates an entry point.
It's best to have another confirmation for entry such as the 13 and 100 ema cross to confirm good position and risk.
This is a repetable and solid trading strategy. The indicator was created to plot on the 1 and 5 minute charts.
Search in scripts for "retest"
Roboquant RP Profits NY Open Retest StrategyRoboquant RP Profits NY Open Retest Strategy A good strategy for CL

BTC LL->HH Liquidity Sweep / BOS / Retest / 4H Bias v6_8BTC LL->HH Liquidity Sweep / BOS / Retest / 4H Bias v6_8

Breakout Retest ScannerStill working on it, but break the previous day high or low, retest and get an alert of some sort.

NY First Candle Break and RetestStrategy Overview
Session and Time Parameters:
The strategy focuses on the New York trading session, starting at 9:30 AM and lasting for a predefined session length, typically 3 to 4 hours. This timing captures the most active market hours, providing ample trading opportunities.
Strategy Parameters:
Utilizes the Average True Range (ATR) to set dynamic stop-loss levels, ensuring risk is managed according to market volatility.
Employs a reward-to-risk ratio to determine take profit levels, aiming for a balanced approach between potential gains and losses.
Strategy Settings:
Incorporates simple moving averages (EMA) and the Volume Weighted Average Price (VWAP) to identify trend direction and price levels.
Volume confirmation is used to validate breakouts, ensuring trades are based on significant market activity.
Trade Management:
Features a trailing stop mechanism to lock in profits as the trade moves in favor, with multiple take profit levels to secure gains incrementally.
The strategy is designed to handle both long and short positions, adapting to market conditions.
Alert Settings:
Provides alerts for key events such as session start, breakout, retest, and entry signals, helping traders stay informed and act promptly.
Visual cues on the chart highlight entry and exit points, making it easier for beginners to follow the strategy.
This strategy is particularly suited for the current volatile market environment, where simplicity and clear guidelines can help beginner traders navigate the complexities of trading. It emphasizes risk management and uses straightforward indicators to make informed trading decisions.
I put together this Trading View scalping strategy for futures markets with some help from Claude AI. Shoutout to everyone who gave me advice along the way—I really appreciate it! I’m sure there’s room for improvement, so feel free to share your thoughts… just go easy on me. :)

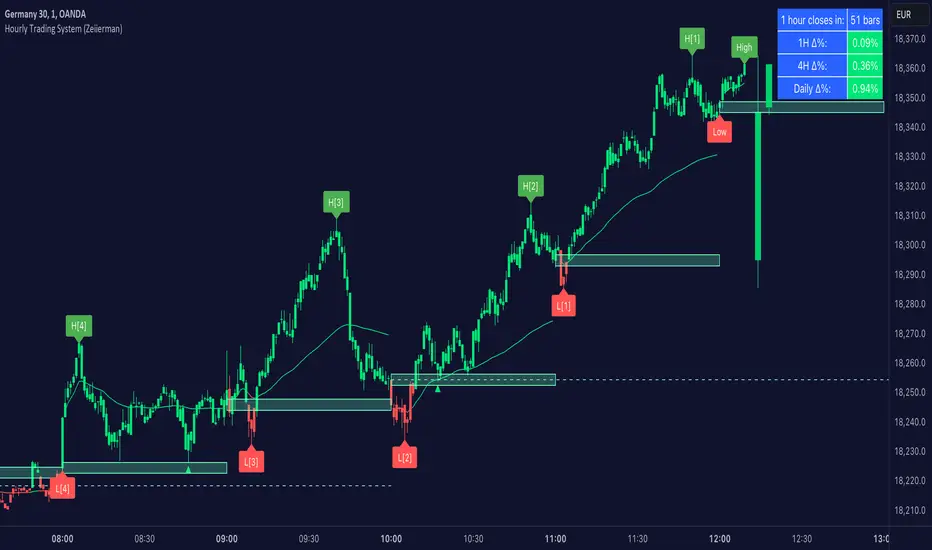
Hourly Trading System (Zeiierman)█ Overview
The Hourly Trading System (Zeiierman) is designed to enhance your trading by highlighting critical price levels and trends on an hourly basis. This indicator plots the open prices of hourly and 4-hour candles, visualizes retests, displays average price lines, and overlays higher timeframe candlesticks. It is particularly beneficial for intraday traders seeking to capitalize on short-term price movements and volume patterns.
█ How It Works
This indicator works by plotting significant price levels and zones based on hourly and 4-hour candle opens. It also includes functionalities for identifying retests of these levels, calculating and displaying average prices, and showing high and low labels for each hour.
█ Timeframe
The Hourly Trading System is designed to be used on the 1-minute or 5-minute timeframe. This system is tailored for intraday trading, allowing traders to find optimal entries around hourly opening levels and providing an easy method to identify the hourly trend. It works effectively on any market.
█ How to Use
Trend Analysis
Quickly gauge where the current price stands relative to key hourly and 4-hour levels. The plotted lines and zones serve as potential support and resistance areas, helping traders identify crucial points for entry or exit.
Utilize the 1-hour average and higher timeframe candles to understand the overall market trend. Aligning intraday strategies with larger trends can enhance trading decisions.
Use the bar coloring to quickly gauge the 1-hour trend on a lower timeframe. The bar colors indicate whether the hourly trend is bullish (green) or bearish (red), helping traders make quicker decisions in alignment with the overall trend.
Retest Identification
Enable retest signals to see where the price retested the hourly open levels. These retest points often signal strong price reactions, offering opportunities for trades based on support/resistance flips.
One effective strategy to incorporate is looking for price flips when a new hour starts. This approach involves monitoring price action at the beginning of each hour. If the price breaks and retests the hourly open level with strong momentum, it could indicate a potential trend reversal or continuation. This strategy is effective in volatile markets where price movements are significant at the start of each new hour.
Liquidity Sweep Strategy
Another common and effective strategy is the liquidity sweep. This involves identifying key levels where liquidity is likely to accumulate, such as previous hour highs and lows, and observing how the price interacts with these price levels. When the price sweeps through these levels, triggering stop-loss orders or pending orders, it often results in a sharp price movement followed by a reversal. Traders can capitalize on these movements by entering trades in the direction of the reversal once the liquidity sweep has occurred.
Equal Highs and Lows Strategy
The Equal Highs and Lows strategy leverages the concept of identifying levels where the price forms multiple highs or lows at the same level over different hourly periods. These equal highs and lows often indicate strong support or resistance levels where liquidity is accumulated. When the price approaches these levels, it is likely to trigger stop-loss orders and lead to significant price movements. Traders can look for breakouts or reversals around these levels to enter trades with higher probability setups.
█ Settings
Zone Width: Specifies the width of the zone around the 1-Hour Open as a percentage. Adjust this to widen or narrow the zone.
Show Retests: Enables or disables the display of retest markers. Retest markers show where the price has retested the 1-Hour Open line.
Number of Retests: Sets the number of retests to display. Adjust this to see more or fewer retest markers.
Volume Filter: Enables or disables the volume filter for retests. Use this to highlight retests with significant volume.
Volume Filter Length: Sets the length of the volume filter, smoothing the volume data to reduce noise.
1-Hour Average Line: Enables or disables the 1-hour average price line. This line shows the average price over the past hour.
Hourly High & Low Labels: Enables or disables the display of hourly high and low labels, marking the highest and lowest prices within each hour.
Candlesticks: Enables or disables the display of candlesticks on the chart, providing a detailed view of price action.
Bar Color: Enables or disables bar coloring based on price direction, with up bars in green and down bars in red.
Timeframe: Sets the timeframe for higher timeframe candles. Adjust this to match the period you want to analyze.
Number of Candles: Sets the number of higher timeframe candles to display. Increase this to see more candles on the chart.
Location: Sets the location for higher timeframe candles, allowing you to position them left or right on the chart.
-----------------
Disclaimer
The information contained in my Scripts/Indicators/Ideas/Algos/Systems does not constitute financial advice or a solicitation to buy or sell any securities of any type. I will not accept liability for any loss or damage, including without limitation any loss of profit, which may arise directly or indirectly from the use of or reliance on such information.
All investments involve risk, and the past performance of a security, industry, sector, market, financial product, trading strategy, backtest, or individual's trading does not guarantee future results or returns. Investors are fully responsible for any investment decisions they make. Such decisions should be based solely on an evaluation of their financial circumstances, investment objectives, risk tolerance, and liquidity needs.
My Scripts/Indicators/Ideas/Algos/Systems are only for educational purposes!
EBL - Enigma BOS Logic Select Higher Time FrameThe "EBL – Enigma BOS Logic" is a unique multi-timeframe trading indicator designed for traders who rely on structured price action and key level retests to find high-probability trade opportunities. This indicator automates the identification of significant price levels on a higher timeframe, plots them across all lower timeframes, and provides actionable signals (buy/sell) when price retests those levels. It is ideal for traders who focus on lower timeframes for precise entries while using higher timeframe structure for trend confirmation.
How the Indicator Works
Key Level Detection:
The indicator allows the user to select a key level timeframe (e.g., 1H, 4H, Daily, Weekly). It then identifies Break of Structure (BOS) levels on the selected timeframe.
When a bullish-to-bearish or bearish-to-bullish reversal is detected on the selected timeframe, the corresponding high or low of the reversal candle is stored as a key level.
These key levels are plotted as horizontal lines on all lower timeframes, helping the trader visualize critical support and resistance zones across multiple timeframes.
Retest Confirmation:
Once a key level is established, the indicator continuously monitors the price action on lower timeframes.
If the price touches or crosses a key level, it is considered a retest, and an alert is generated.
The indicator plots a retest marker (customizable as a circle or diamond) at the exact price level where the retest occurred, providing a clear visual cue for the trader.
Trading Signals:
When a retest is detected, a table is displayed on the chart with the following information:
The trading pair.
The signal direction (Buy/Sell).
The price at which the retest occurred.
This table gives traders instant insight into actionable opportunities, making it easier to focus on live market conditions without missing critical retests.
Key Features
Multi-Timeframe Analysis: The indicator focuses on a higher timeframe selected by the user, ensuring that only the most relevant key levels are plotted for lower timeframe trading.
Dynamic Retest Signals: It dynamically identifies when price retests a key level and provides both visual markers and real-time alerts.
Customizable Retest Markers: Users can customize the retest marker's shape (circle/diamond) and color to suit their preferences.
Signal Table: A built-in table displays clear buy or sell signals when retests occur, ensuring that traders have all the necessary information at a glance.
Alerts: The indicator supports real-time alerts for retests, helping traders stay informed even when they are not actively monitoring the chart.
How to Use the Indicator
Select a Key Level Timeframe:
In the input settings, choose a higher timeframe (e.g., 4H or Daily) to define key levels.
The indicator will calculate Break of Structure (BOS) levels on the selected timeframe and plot them as horizontal lines across all lower timeframes.
Monitor Lower Timeframes for Retests:
Switch to a lower timeframe (e.g., 15m, 5m) to wait for price to approach the key levels plotted by the indicator.
When a retest occurs, observe the signal table and retest marker for actionable trade signals.
Act on Buy/Sell Signals:
Use the information provided by the signal table to make trading decisions.
For a buy signal, wait for bullish confirmation (e.g., price holding above the retested level).
For a sell signal, wait for bearish confirmation (e.g., price holding below the retested level).
Trading Concepts and Underlying Logic
The indicator is based on the Break of Structure (BOS) concept, a core principle in price action trading. BOS levels represent points where the market shifts its trend direction, making them critical zones for potential reversals or continuations.
By focusing on higher timeframe BOS levels, the indicator helps traders align their lower timeframe entries with the overall market trend.
The concept of retests is used to confirm the validity of a key level. A retest occurs when the price returns to a previously identified BOS level, offering a high-probability entry point.
Use Cases
Scalping: Traders who prefer lower timeframe scalping can use the indicator to align their trades with higher timeframe key levels, increasing the likelihood of successful trades.
Swing Trading: Swing traders can use the indicator to identify key reversal zones on higher timeframes and plan their trades accordingly.
Intraday Trading: Intraday traders can benefit from the real-time alerts and signals generated by the indicator, ensuring they never miss critical retests during active trading hours.
Conclusion
The "EBL – Enigma BOS Logic" is a powerful tool for traders who want to enhance their price action trading by focusing on key levels and retests across multiple timeframes. By automating the identification of BOS levels and providing clear retest signals, it helps traders make more informed and confident trading decisions. Whether you are a scalper, intraday trader, or swing trader, this indicator offers valuable insights to improve your trading performance.

FVG Zones with Signals█ OVERVIEW
"FVG Zones with Signals" is a technical analysis tool that identifies Fair Value Gaps (FVG) on the chart and draws customizable zones in the form of boxes. It is ideal for traders using price action and market structure strategies, helping to identify potential imbalance zones and trading opportunities based on breakout and exit signals. With flexible size filter settings, box styles, and signal options, the indicator ensures clarity and precision on the chart.
█ CONCEPTS
The indicator is designed to identify potential entry points for trades based on FVG breakouts or retests. For chart clarity, a size filter for FVGs is included, based on a multiplier of the average candle size over a specified period.
Why are FVGs important? FVG zones represent areas of market imbalance, often attracting price back to "fill" the gap. Larger gaps (with a higher size multiplier) have a greater chance of being retested, as they indicate deeper imbalances—leaving more unexecuted orders in those zones, which attracts liquidity. Market makers and institutions often return to these levels to "refresh" liquidity before further moves. However, not every large FVG is retested quickly—in strong trends, smaller imbalances may be ignored, and the location (e.g., near swing highs/lows) is critical for retest probability.
█ FEATURES
- FVG Detection: Identifies bullish and bearish FVGs based on size filters (Candle Size Period and FVG Size Multiplier), with automatic initialization of historical gaps up to 500 candles back.
- Customizable Boxes: Draws FVG boxes with adjustable border colors, background gradients, border styles (solid, dashed, dotted), border widths, and transparency for both the background and the 50% FVG midline.
- Breakout and Exit Signals: Generates "Break" signals (green upward triangle for breakouts above bearish FVG, red downward triangle for breakouts below bullish FVG) and "Exit" signals (circles for exiting the zone), with options to select signal types (Break, Exit, or Both). A break signal causes the box to disappear, leaving a triangle as a trace of the breakout, which may serve as a signal to open a position. Exit signals (circles) may also indicate entry opportunities but require additional confirmation, such as alignment with the main trend.
- Midline: Automatically draws a dashed line at the 50% FVG level with adjustable transparency, aiding in assessing price reactions within the zone.
- Box Limitation: Automatically removes old or inactive FVGs after 500 candles to avoid chart clutter.
- Alerts: Built-in alerts for all signal types, including price and FVG type descriptions.
█ HOW TO USE
Add to Chart: Apply the indicator to your TradingView chart via the Pine Editor or Indicators menu.
Configure Settings:
- FVG Settings: Adjust Candle Size Period (default 20) and FVG Size Multiplier (default 1) to filter out small gaps—higher values generate fewer but more significant FVGs.
- Box Settings: Configure colors and styles for bullish (green) and bearish (red) boxes, including background transparency (default 80) and midline transparency.
- Signal Settings: Select signal types (Break, Exit, or Both) in Signal Type. Breakout signals appear after a candle closes outside the zone, while exit signals appear when exiting an FVG without a full breakout.
- Styling: Customize signal colors (green for buy/up, red for sell/down) and shape sizes.
Interpreting Signals:
- Break Up Signal: A green triangle below the bar indicates a breakout above a bearish FVG, suggesting potential continuation of an uptrend.
- Break Down Signal: A red triangle above the bar indicates a breakout below a bullish FVG, suggesting potential continuation of a downtrend.
- Exit Up/Down Signal: A green/red circle indicates an exit from an FVG without a full breakout, which may signal the end of a correction or preparation for a reversal.
- FVG Zones: If the price returns to an FVG and fills the gap, it may indicate equilibrium; an unfilled gap often leads to a retest.
- Use signals in conjunction with other technical analysis tools for confirmation, such as RSI (to identify overbought/oversold conditions) or MACD (to confirm momentum). Analyze FVGs from higher timeframes—these zones act as stronger imbalance levels and carry greater structural significance.
Exit signals (retests without breakouts) tend to be most effective when traded in line with the current trend.
█ APPLICATIONS
- Price Action Trading: Use FVG zones as dynamic support and resistance levels. In an uptrend, look for buying opportunities in bullish FVGs, where price often tests the gap before continuing. Combining with RSI, MACD, or Fibonacci levels enhances the significance of zones.
- Breakout Strategies: Trade based on breakout signals from FVGs. A buy signal after breaking a bearish FVG may indicate a strong upward impulse, especially when supported by a rising MACD or RSI exiting oversold conditions.
Larger FVG gaps (higher multiplier) have a greater chance of retest, as they indicate deeper imbalances.
█ NOTES
- Test the indicator across different timeframes and markets (stocks, forex, crypto) to optimize size filters for your trading style.
- The indicator initializes historical FVGs up to 500 candles back, which may slow loading on longer charts.
- For best results, use on high-liquidity markets where FVGs are more frequently retested.
- In consolidation zones, the indicator may generate more false signals, so additional confirmation is recommended.

VWAP Trend Strategy (Intraday) [KedarArc Quant]Description:
An intraday strategy that anchors to VWAP and only trades when a local EMA trend gate and a volume participation gate are both open. It offers two entry templates—Cross and Cross-and-Retest—with an optional Momentum Exception for impulsive moves. Exits combine a TrendBreak (structure flips) with an ATR emergency stop (risk cap).
Updates will be published under this script.
Why this merits a new script
This is not a simple “VWAP + EMA + ATR” overlay. The components are sequenced as gates and branches that *change the trade set* in ways a visual mashup cannot:
1. Trend Gate first (EMA fast vs. slow on the entry timeframe)
Counter-trend VWAP crosses are suppressed. Many VWAP scripts fire on every cross; here, no entry logic even evaluates unless the trend gate is open.
2. Participation Gate second (Volume SMA × multiplier)
This gate filters thin liquidity moves around VWAP. Without it, the same visuals would produce materially more false triggers.
3. Branching entries with structure awareness
* Cross: Immediate VWAP cross in the trend direction.
* Cross-and-Retest: Requires a revisit to VWAP vicinity within a lookback window (recent low near VWAP for longs; recent high for shorts). This explicitly removes first-touch fakeouts that a plain cross takes.
* Momentum Exception (optional): A quantified body% + volume condition can bypass the retest when flow is impulsive—intentional risk-timing, not “just another indicator.”
4. Dual exits that reference both anchor and structure
* TrendBreak: Close only when price loses VWAP and EMA alignment flips.
* ATR stop: Placed at entry to cap tail risk.
These exits complement the entry structure rather than being generic stop/target add-ons.
What it does
* Trades the session’s fair value anchor (VWAP), but only with local-trend agreement (EMA fast vs. slow) and sufficient participation (volume filter).
* Lets you pick Cross or Cross-and-Retest entries; optionally allow a fast Momentum Exception when candles expand with volume.
* Manages positions with a structure exit (TrendBreak) and an emergency ATR stop from entry.
How it works (concepts & calculations)
* VWAP (session anchor):
Standard VWAP of the active session; entries reference the cross and the retest proximity to VWAP.
* Trend gate:
Long context only if `EMA(fast) > EMA(slow)`; short only if `EMA(fast) < EMA(slow)`.
A *gate*, not a trigger—entries aren’t considered unless this is true.
* Participation (volume) gate:
Require `volume > SMA(volume, volLen) × volMult`.
Screens out low-participation wiggles around VWAP.
Entries:
* Cross: Price crosses VWAP in the trend direction while volume gate is open.
* Cross-and-Retest: After crossing, price revisits VWAP vicinity within `lookback` (recent *low near VWAP* for longs; recent *high near VWAP* for shorts).
* Momentum Exception (optional): If body% (|close−open| / range) and volume exceed thresholds, enter without waiting for the retest.
Exits:
* TrendBreak (structure):
* Longs close when `price < VWAP` and `EMA(fast) < EMA(slow)` (mirror for shorts).
* ATR stop (risk):
* From entry: `stop = entry ± ATR(atrLen) × atrMult`.
How to use it ?
1. Select market & timeframe: Intraday on liquid symbols (equities, futures, crypto).
2. Pick entry mode:
* Start with Cross-and-Retest for fewer, more selective signals.
* Enable Momentum Exception if strong moves leave without retesting.
3. Tune guards:
* Raise `volMult` to ignore thin periods; lower it for more activity.
* Adjust `lookback` if retests come late/early on your symbol.
4. Risk:
* `atrLen` and `atrMult` set the emergency stop distance.
5. Read results per session: Optional panel (if enabled) summarizes Net-R, Win%, and PF for today’s session to evaluate
behavior regime by regime.
⚠️ Disclaimer
This script is provided for educational purposes only.
Past performance does not guarantee future results.
Trading involves risk, and users should exercise caution and use proper risk management when applying this strategy.

Balanced Price Range | Flux Charts💎 GENERAL OVERVIEW
Introducing our new Balanced Price Range (BPR) indicator! A Balanced Price Range is a trading concept used by price action traders. It is detected by finding overlapping area between two contrary Fair Value Gaps (FVGs). These areas can be used as entry points during market pullbacks. For more information about the process, please check the "HOW DOES IT WORK ?" section.
Balanced Price Range Features :
Balanced Price Range Detection : Identifies areas where bullish and bearish FVGs overlap, suggesting a zone of price equilibrium.
Customizable FVG & BPR Detection : You can fine-tune FVG detection and sensitivity for BPR detection to your liking.
Retest Labels : Bullish & Bearish retest labels will be rendered for BPRs.
Alerts : You can set alerts for Bullish & Bearish BPR detection and their retests.
🚩 UNIQUENESS
This indicator doesn't just detect standard FVGs but specifically looks for areas where bullish and bearish IFVGs (Invalidated Fair Value Gaps) overlap, defining a Balanced Price Range. It also actively manages and updates identified BPR zones, removing them when they are invalidated or remain untouched for a specified period. It highlights and alerts users to retests of established BPR zones, signaling potential trading opportunities. Users can tailor the appearance of the BPR zones and retest markers, as well as configure specific alerts for new BPR formations and retests.
📌 HOW DOES IT WORK ?
A Fair Value Gap generally occur when there is an imbalance in the market. They can be detected by specific formations within the chart. The indicator first detects bullish & bearish FVG zones according to their formations on chart. Then, they are dynamically tracked and flagged as invalidated if the price crosses them, turning them into IFVGs. When a FVG & IFVG of the same type overlaps, the indicator combines them into a single BPR of corresponding type. The detected BPR is updated as new data comes in, and renders retests labels as they occur. A bullish BPR can be used to find long trade entry opportunities, while a bearish BPR can be used to find short trade entry opportunities. Retests can also indicate potential movements in the corresponding direction of the BPR. Users can set-up alerts for BPR detection & BPR retests and will get notified as they occur.
⚙️ SETTINGS
Show Historic Zones: If enabled, invalidated or expired BPR zones will remain visible on the chart.
Balanced Price Range:
FVG Detection Method: Determines the criteria for the bar types forming the initial FVG.
Same: All three bars forming the FVG must be of the same type (all bullish or all bearish).
Mixed: The bar types must vary (a mix of bullish and bearish bars).
All: Bar types can vary or be the same.
FVG Invalidation Method: Determines which part of the candle (wick or close) invalidates the initial FVG.
BPR Invalidation Method: Determines which part of the candle (wick or close) invalidates the Balanced Price Range.
Sensitivity: Adjusts the sensitivity of FVG detection. Higher values may identify fewer, larger BPRs, while lower values may detect more, smaller BPRs.
Labels: Toggles the display of text labels on the identified zones.
Retests: Enables or disables the detection and visualization of BPR retests.

Impulse Zones | Flux Charts💎 GENERAL OVERVIEW
Introducing our new Impulse Zones indicator, a powerful tool designed to identify significant price movements accompanied by strong volume, highlighting potential areas of support and resistance. These Impulse Zones can offer valuable insights into market momentum and potential reversal or continuation points. For more information about the process, please check the "HOW DOES IT WORK ?" section.
Impulse Zones Features :
Dynamic Zone Creation : Automatically identifies and plots potential supply and demand zones based on significant price impulses and volume spikes.
Customizable Settings : Allows you to adjust the sensitivity of zone detection based on your trading style and market conditions.
Retests and Breakouts : Clearly marks instances where price retests or breaks through established Impulse Zones, providing potential entry or exit signals.
Alerts : You can set alerts for Bullish & Bearish Impulse Zone detection and their retests.
🚩 UNIQUENESS
Our Impulse Zones indicator stands out by combining both price action (impulsive moves) and volume confirmation to define significant zones. Unlike simple support and resistance indicators, it emphasizes the strength behind price movements, potentially filtering out less significant levels. The inclusion of retest and breakout visuals directly on the chart provides immediate context for potential trading opportunities. The user can also set up alerts for freshly detected Impulse Zones & the retests of them.
📌 HOW DOES IT WORK ?
The indicator identifies bars where the price range (high - low) is significantly larger than the average true range (ATR), indicating a strong price movement. The Size Sensitivity input allows you to control how large this impulse needs to be relative to the ATR.
Simultaneously, it checks if the volume on the impulse bar is significantly higher than the average volume. The Volume Sensitivity input governs this threshold.
When both the price impulse and volume confirmation criteria are met, an Impulse Zone is created in the corresponding direction. The high and low of the impulse bar define the initial boundaries of the zone. Zones are extended forward in time to remain relevant. The indicator manages the number of active zones to maintain chart clarity and can remove zones that haven't been touched for a specified period. The indicator monitors price action within and around established zones.
A retest is identified when the price touches a zone and then moves away. A break occurs when the price closes beyond the invalidation point of a zone. Keep in mind that if "Show Historic Zones" setting is disabled, you will not see break labels as their zones will be removed from the chart.
The detection of Impulse Zones are immediate signs of significant buying or selling pressure entering the market. These zones represent areas where a strong imbalance between buyers and sellers has led to a rapid price movement accompanied by high volume. Bullish Impulse Zones act as a possible future support zone, and Bearish Impulse Zones act as a possible future resistance zone. Retests of the zones suggest a strong potential movement in the corresponding direction.
⚙️ SETTINGS
1. General Configuration
Show Historic Zones: If enabled, invalidated or expired Impulse Zones will remain visible on the chart.
2. Impulse Zones
Invalidation Method: Determines which part of the candle (Wick or Close) is used to invalidate a zone break.
Size Sensitivity: Controls the required size of the impulse bar relative to the ATR for a zone to be detected. Higher values may identify fewer, larger zones. Lower values may detect more, smaller zones.
Volume Sensitivity: Controls the required volume of the impulse bar relative to the average volume for a zone to be detected. Higher values require more significant volume.
Labels: Toggles the display of "IZ" labels on the identified zones.
Retests: Enables the visual highlighting of retests on the zones.
Breaks: Enables the visual highlighting of zone breaks.

Luxy BIG beautiful Dynamic ORBThis is an advanced Opening Range Breakout (ORB) indicator that tracks price breakouts from the first 5, 15, 30, and 60 minutes of the trading session. It provides complete trade management including entry signals, stop-loss placement, take-profit targets, and position sizing calculations.
The ORB strategy is based on the concept that the opening range of a trading session often acts as support/resistance, and breakouts from this range tend to lead to significant moves.
What Makes This Different?
Most ORB indicators simply draw horizontal lines and leave you to figure out the rest. This indicator goes several steps further:
Multi-Stage Tracking
Instead of just one ORB timeframe, this tracks FOUR simultaneously (5min, 15min, 30min, 60min). Each stage builds on the previous one, giving you multiple trading opportunities throughout the session.
Active Trade Management
When a breakout occurs, the indicator automatically calculates and displays entry price, stop-loss, and multiple take-profit targets. These lines extend forward and update in real-time until the trade completes.
Cycle Detection
Unlike indicators that only show the first breakout, this tracks the complete cycle: Breakout → Retest → Re-breakout. You can see when price returns to test the ORB level after breaking out (potential re-entry).
Failed Breakout Warning
If price breaks out but quickly returns inside the range (within a few bars), the label changes to "FAILED BREAK" - warning you to exit or avoid the trade.
Position Sizing Calculator
Built-in risk management that tells you exactly how many shares to buy based on your account size and risk tolerance. No more guessing or manual calculations.
Advanced Filtering
Optional filters for volume confirmation, trend alignment, and Fair Value Gaps (FVG) to reduce false signals and improve win rate.
Core Features Explained
### 1. Multi-Stage ORB Levels
The indicator builds four separate Opening Range levels:
ORB 5 - First 5 minutes (fastest signals, most volatile)
ORB 15 - First 15 minutes (balanced, most popular)
ORB 30 - First 30 minutes (slower, more reliable)
ORB 60 - First 60 minutes (slowest, most confirmed)
Each level is drawn as a horizontal range on your chart. As time progresses, the ranges expand to include more price action. You can enable or disable any stage and assign custom colors to each.
How it works: During the opening minutes, the indicator tracks the highest high and lowest low. Once the time period completes, those levels become your ORB high and low for that stage.
### 2. Breakout Detection
When price closes outside the ORB range, a label appears:
BREAK UP (green label above price) - Price closed above ORB High
BREAK DOWN (red label below price) - Price closed below ORB Low
The label shows which ORB stage triggered (ORB5, ORB15, etc.) and the cycle number if tracking multiple breakouts.
Important: Signals appear on bar close only - no repainting. What you see is what you get.
### 3. Retest Detection
After price breaks out and moves away, if it returns to test the ORB level, a "RETEST" label appears (orange). This indicates:
The original breakout level is now acting as support/resistance
Potential re-entry opportunity if you missed the first breakout
Confirmation that the level is significant
The indicator requires price to move a minimum distance away before considering it a valid retest (configurable in settings).
### 4. Failed Breakout Detection
If price breaks out but returns inside the ORB range within a few bars (before the breakout is "committed"), the original label changes to "FAILED BREAK" in orange.
This warns you:
The breakout lacked conviction
Consider exiting if already in the trade
Wait for better setup
Committed Breakout: The indicator tracks how many bars price stays outside the range. Only after staying outside for the minimum number of bars does it become a committed breakout that can be retested.
### 5. TP/SL Lines (Trade Management)
When a breakout occurs, colored horizontal lines appear showing:
Entry Line (cyan for long, orange for short) - Your entry price (the ORB level)
Stop Loss Line (red) - Where to exit if trade goes against you
TP1, TP2, TP3 Lines (same color as entry) - Profit targets at 1R, 2R, 3R
These lines extend forward as new bars form, making it easy to track your trade. When a target is hit, the line turns green and the label shows a checkmark.
Lines freeze (stop updating) when:
Stop loss is hit
The final enabled take-profit is hit
End of trading session (optional setting)
### 6. Position Sizing Dashboard
The dashboard (bottom-left corner by default) shows real-time information:
Current ORB stage and range size
Breakout status (Inside Range / Break Up / Break Down)
Volume confirmation (if filter enabled)
Trend alignment (if filter enabled)
Entry and Stop Loss prices
All enabled Take Profit levels with percentages
Risk/Reward ratio
Position sizing: Max shares to buy and total risk amount
Position Sizing Example:
If your account is $25,000 and you risk 1% per trade ($250), and the distance from entry to stop loss is $0.50, the calculator shows you can buy 500 shares (250 / 0.50 = 500).
### 7. FVG Filter (Fair Value Gap)
Fair Value Gaps are price inefficiencies - gaps left by strong momentum where one candle's high doesn't overlap with a previous candle's low (or vice versa).
When enabled, this filter:
Detects bullish and bearish FVGs
Draws semi-transparent boxes around these gaps
Only allows breakout signals if there's an FVG near the breakout level
Why this helps: FVGs indicate institutional activity. Breakouts through FVGs tend to be stronger and more reliable.
Proximity setting: Controls how close the FVG must be to the ORB level. 2.0x means the breakout can be within 2 times the FVG size - a reasonable default.
### 8. Volume & Trend Filters
Volume Filter:
Requires current volume to be above average (customizable multiplier). High volume breakouts are more likely to sustain.
Set minimum multiplier (e.g., 1.5x = 50% above average)
Set "strong volume" multiplier (e.g., 2.5x) that bypasses other filters
Dashboard shows current volume ratio
Trend Filter:
Only shows breakouts aligned with a higher timeframe trend. Choose from:
VWAP - Price above/below volume-weighted average
EMA - Price above/below exponential moving average
SuperTrend - ATR-based trend indicator
Combined modes (VWAP+EMA, VWAP+SuperTrend) for stricter filtering
### 9. Pullback Filter (Advanced)
Purpose:
Waits for price to pull back slightly after initial breakout before confirming the signal.
This reduces false breakouts from immediate reversals.
How it works:
- After breakout is detected, indicator waits for a small pullback (default 2%)
- Once pullback occurs AND price breaks out again, signal is confirmed
- If no pullback within timeout period (5 bars), signal is issued anyway
Settings:
Enable Pullback Filter: Turn this filter on/off
Pullback %: How much price must pull back (2% is balanced)
Timeout (bars): Max bars to wait for pullback (5 is standard)
When to use:
- Choppy markets with many fake breakouts
- When you want higher quality signals
- Combine with Volume filter for maximum confirmation
Trade-off:
- Better signal quality
- May miss some valid fast moves
- Slight entry delay
How to Use This Indicator
### For Beginners - Simple Setup
Add the indicator to your chart (5-minute or 15-minute timeframe recommended)
Leave all default settings - they work well for most stocks
Watch for BREAK UP or BREAK DOWN labels to appear
Check the dashboard for entry, stop loss, and targets
Use the position sizing to determine how many shares to buy
Basic Trading Plan:
Wait for a clear breakout label
Enter at the ORB level (or next candle open if you're late)
Place stop loss where the red line indicates
Take profit at TP1 (50% of position) and TP2 (remaining 50%)
### For Advanced Traders - Customized Setup
Choose which ORB stages to track (you might only want ORB15 and ORB30)
Enable filters: Volume (stocks) or Trend (trending markets)
Enable FVG filter for institutional confirmation
Set "Track Cycles" mode to catch retests and re-breakouts
Customize stop loss method (ATR for volatile stocks, ORB% for stable ones)
Adjust risk per trade and account size for accurate position sizing
Advanced Strategy Example:
Enable ORB15 only (disable others for cleaner chart)
Turn on Volume filter at 1.5x with Strong at 2.5x
Enable Trend filter using VWAP
Set Signal Mode to "Track Cycles" with Max 3 cycles
Wait for aligned breakouts (Volume + Trend + Direction)
Enter on retest if you missed the initial break
### Timeframe Recommendations
5-minute chart: Scalping, very active trading, crypto
15-minute chart: Day trading, balanced approach (most popular)
30-minute chart: Swing entries, less screen time
60-minute chart: Position trading, longer holds
The indicator works on any intraday timeframe, but ORB is fundamentally a day trading strategy. Daily charts don't make sense for ORB.
DEFAULT CONFIGURATION
ON by Default:
• All 4 ORB stages (5/15/30/60)
• Breakout Detection
• Retest Labels
• All TP levels (1/1.5/2/3)
• TP/SL Lines (Detailed mode)
• Dashboard (Bottom Left, Dark theme)
• Position Size Calculator
OFF by Default (Optional Filters):
• FVG Filter
• Pullback Filter
• Volume Filter
• Trend Filter
• HTF Bias Check
• Alerts
Recommended for Beginners:
• Leave all defaults
• Session Mode: Auto-Detect
• Signal Mode: Track Cycles
• Stop Method: ATR
• Add Volume Filter if trading stocks
Recommended for Advanced:
• Enable ORB15 + ORB30 only (disable 5 & 60)
• Enable: Volume + Trend + FVG
• Signal Mode: Track Cycles, Max 3
• Stop Method: ATR or Safer
• Enable HTF Daily bias check
## Settings Guide
The settings are organized into logical groups. Here's what each section controls:
### ORB COLORS Section
Show Edge Labels: Display "ORB 5", "ORB 15" labels at the right edge of the levels
Background: Fill the area between ORB high/low with color
Transparency: How see-through the background is (95% is nearly invisible)
Enable ORB 5/15/30/60: Turn each stage on or off individually
Colors: Assign colors to each ORB stage for easy identification
### SESSION SETTINGS Section
Session Mode: Choose trading session (Auto-Detect works for most instruments)
Custom Session Hours: Define your own hours if needed (format: HHMM-HHMM)
Auto-Detect uses the instrument's natural hours (stocks use exchange hours, crypto uses 24/7).
### BREAKOUT DETECTION Section
Enable Breakout Detection: Master switch for signals
Show Retest Labels: Display retest signals
Label Size: Visual size for all labels (Small recommended)
Enable FVG Filter: Require Fair Value Gap confirmation
Show FVG Boxes: Display the gap boxes on chart
Signal Mode: "First Only" = one signal per direction per day, "Track Cycles" = multiple signals
Max Cycles: How many breakout-retest cycles to track (6 is balanced)
Breakout Buffer: Extra distance required beyond ORB level (0.1-0.2% recommended)
Min Distance for Retest: How far price must move away before retest is valid (2% recommended)
Min Bars Outside ORB: Bars price must stay outside for committed breakout (2 is balanced)
### TARGETS & RISK Section
Enable Targets & Stop-Loss: Calculate and show trade management
TP1/TP2/TP3 checkboxes: Select which profit targets to display
Stop Method: How to calculate stop loss placement
- ATR: Based on volatility (best for most cases)
- ORB %: Fixed % of ORB range
- Swing: Recent swing high/low
- Safer: Widest of all methods
ATR Length & Multiplier: Controls ATR stop distance (14 period, 1.5x is standard)
ORB Stop %: Percentage beyond ORB for stop (20% is balanced)
Swing Bars: Lookback period for swing high/low (3 is recent)
### TP/SL LINES Section
Show TP/SL Lines: Display horizontal lines on chart
Label Format: "Short" = minimal text, "Detailed" = shows prices
Freeze Lines at EOD: Stop extending lines at session close
### DASHBOARD Section
Show Info Panel: Display the metrics dashboard
Theme: Dark or Light colors
Position: Where to place dashboard on chart
Toggle rows: Show/hide specific information rows
Calculate Position Size: Enable the position sizing calculator
Risk Mode: Risk fixed $ amount or % of account
Account Size: Your total trading capital
Risk %: Percentage to risk per trade (0.5-1% recommended)
### VOLUME FILTER Section
Enable Volume Filter: Require volume confirmation
MA Length: Average period (20 is standard)
Min Volume: Required multiplier (1.5x = 50% above average)
Strong Volume: Multiplier that bypasses other filters (2.5x)
### TREND FILTER Section
Enable Trend Filter: Require trend alignment
Trend Mode: Method to determine trend (VWAP is simple and effective)
Custom EMA Length: If using EMA mode (50 for swing, 20 for day trading)
SuperTrend settings: Period and Multiplier if using SuperTrend mode
### HIGHER TIMEFRAME Section
Check Daily Trend: Display higher timeframe bias in dashboard
Timeframe: What TF to check (D = daily, recommended)
Method: Price vs MA (stable) or Candle Direction (reactive)
MA Period: EMA length for Price vs MA method (20 is balanced)
Min Strength %: Minimum strength threshold for HTF bias to be considered
- For "Price vs MA": Minimum distance (%) from moving average
- For "Candle Direction": Minimum candle body size (%)
- 0.5% is balanced - increase for stricter filtering
- Lower values = more signals, higher values = only strong trends
### ALERTS Section
Enable Alerts: Master switch (must be ON to use any alerts)
Breakout Alerts: Notify on ORB breakouts
Retest Alerts: Notify when price retests after breakout
Failed Break Alerts: Notify on failed breakouts
Stage Complete Alerts: Notify when each ORB stage finishes forming
After enabling desired alert types, click "Create Alert" button, select this indicator, choose "Any alert() function call".
## Tips & Best Practices
### General Trading Tips
ORB works best on liquid instruments (stocks with good volume, major crypto pairs)
First hour of the session is most important - that's when ORB is forming
Breakouts WITH the trend have higher success rates - use the trend filter
Failed breakouts are common - use the "Min Bars Outside" setting to filter weak moves
Not every day produces good ORB setups - be patient and selective
### Position Sizing Best Practices
Never risk more than 1-2% of your account on a single trade
Use the built-in calculator - don't guess your position size
Update your account size monthly as it grows
Smaller accounts: use $ Amount mode for simplicity
Larger accounts: use % of Account mode for scaling
### Take Profit Strategy
Most traders use: 50% at TP1, 50% at TP2
Aggressive: Hold through TP1 for TP2 or TP3
Conservative: Full exit at TP1 (1:1 risk/reward)
After TP1 hits, consider moving stop to breakeven
TP3 rarely hits - only on strong trending days
### Filter Combinations
Maximum Quality: Volume + Trend + FVG (fewest signals, highest quality)
Balanced: Volume + Trend (good quality, reasonable frequency)
Active Trading: No filters or Volume only (many signals, lower quality)
Trending Markets: Trend filter essential (indices, crypto)
Range-Bound: Volume + FVG (avoid trend filter)
### Common Mistakes to Avoid
Chasing breakouts - wait for the bar to close, don't FOMO into wicks
Ignoring the stop loss - always use it, move it manually if needed
Over-leveraging - the calculator shows MAX shares, you can buy less
Trading every signal - quality > quantity, use filters
Not tracking results - keep a journal to see what works for YOU
## Pros and Cons
### Advantages
Complete all-in-one solution - from signal to position sizing
Multiple timeframes tracked simultaneously
Visual clarity - easy to see what's happening
Cycle tracking catches opportunities others miss
Built-in risk management eliminates guesswork
Customizable filters for different trading styles
No repainting - what you see is locked in
Works across multiple markets (stocks, forex, crypto)
### Limitations
Intraday strategy only - doesn't work on daily charts
Requires active monitoring during first 1-2 hours of session
Not suitable for after-hours or extended sessions by default
Can produce many signals in choppy markets (use filters)
Dashboard can be overwhelming for complete beginners
Performance depends on market conditions (trends vs ranges)
Requires understanding of risk management concepts
### Best For
Day traders who can watch the first 1-2 hours of market open
Traders who want systematic entry/exit rules
Those learning proper position sizing and risk management
Active traders comfortable with multiple signals per day
Anyone trading liquid instruments with clear sessions
### Not Ideal For
Swing traders holding multi-day positions
Set-and-forget / passive investors
Traders who can't watch market open
Complete beginners unfamiliar with trading concepts
Low volume / illiquid instruments
## Frequently Asked Questions
Q: Why are no signals appearing?
A: Check that you're on an intraday timeframe (5min, 15min, etc.) and that the current time is within your session hours. Also verify that "Enable Breakout Detection" is ON and at least one ORB stage is enabled. If using filters, they might be blocking signals - try disabling them temporarily.
Q: What's the best ORB stage to use?
A: ORB15 (15 minutes) is most popular and balanced. ORB5 gives faster signals but more noise. ORB30 and ORB60 are slower but more reliable. Many traders use ORB15 + ORB30 together.
Q: Should I enable all the filters?
A: Start with no filters to see all signals. If too many false signals, add Volume filter first (stocks) or Trend filter (trending markets). FVG filter is most restrictive - use for maximum quality but fewer signals.
Q: How do I know which stop loss method to use?
A: ATR works for most cases - it adapts to volatility. Use ORB% if you want predictable stop placement. Swing is for respecting chart structure. Safer gives you the most room but largest risk.
Q: Can I use this for swing trading?
A: Not really - ORB is fundamentally an intraday strategy. The ranges reset each day. For swing trading, look at weekly support/resistance or moving averages instead.
Q: Why do TP/SL lines disappear sometimes?
A: Lines freeze (stop extending) when: stop loss is hit, the last enabled take-profit is hit, or end of session arrives (if "Freeze at EOD" is enabled). This is intentional - the trade is complete.
Q: What's the difference between "First Only" and "Track Cycles"?
A: "First Only" shows one breakout UP and one DOWN per day maximum - clean but might miss opportunities. "Track Cycles" shows breakout-retest-rebreak sequences - more signals but busier chart.
Q: Is position sizing accurate for options/forex?
A: The calculator is designed for shares (stocks). For options, ignore the share count and use the risk amount. For forex, you'll need to adapt the lot size calculation manually.
Q: How much capital do I need to use this?
A: The indicator works for any account size, but practical day trading typically requires $25,000 in the US due to Pattern Day Trader rules. Adjust the "Account Size" setting to match your capital.
Q: Can I backtest this strategy?
A: This is an indicator, not a strategy script, so it doesn't have built-in backtesting. You can visually review historical signals or code a strategy script using similar logic.
Q: Why does the dashboard show different entry price than the breakout label?
A: If you're looking at an old breakout, the ORB levels may have changed when the next stage completed. The dashboard always shows the CURRENT active range and trade setup.
Q: What's a good win rate to expect?
A: ORB strategies typically see 40-60% win rate depending on market conditions and filters used. The strategy relies on positive risk/reward ratios (2:1 or better) to be profitable even with moderate win rates.
Q: Does this work on crypto?
A: Yes, but crypto trades 24/7 so you need to define what "session start" means. Use Session Mode = Custom and set your preferred daily reset time (e.g., 0000-2359 UTC).
## Credits & Transparency
### Development
This indicator was developed with the assistance of AI technology to implement complex ORB trading logic.
The strategy concept, feature specifications, and trading logic were designed by the publisher. The implementation leverages modern development tools to ensure:
Clean, efficient, and maintainable code
Comprehensive error handling and input validation
Detailed documentation and user guidance
Performance optimization
### Trading Concepts
This indicator implements several public domain trading concepts:
Opening Range Breakout (ORB): Trading strategy popularized by Toby Crabel, Mark Fisher and many more talanted traders.
Fair Value Gap (FVG): Price imbalance concept from ICT methodology
SuperTrend: ATR-based trend indicator using public formula
Risk/Reward Ratio: Standard risk management principle
All mathematical formulas and technical concepts used are in the public domain.
### Pine Script
Uses standard TradingView built-in functions:
ta.ema(), ta.atr(), ta.vwap(), ta.highest(), ta.lowest(), request.security()
No external libraries or proprietary code from other authors.
## Disclaimer
This indicator is provided for educational and informational purposes only. It is not financial advice.
Trading involves substantial risk of loss and is not suitable for every investor. Past performance shown in examples is not indicative of future results.
The indicator provides signals and calculations, but trading decisions are solely your responsibility. Always:
Test strategies on paper before using real money
Never risk more than you can afford to lose
Understand that all trading involves risk
Consider seeking advice from a licensed financial advisor
The publisher makes no guarantees regarding accuracy, profitability, or performance. Use at your own risk.
---
Version: 3.0
Pine Script Version: v6
Last Updated: October 2024
For support, questions, or suggestions, please comment below or send a private message.
---
Happy trading, and remember: consistent risk management beats perfect entry timing every time.

No wick candlesОпис коду:
Цей скрипт для Pine Script v6 аналізує свічки на графіку і визначає свічки, що не мають фітіля знизу або згори. Він позначає їх відповідними маркерами та змінює колір свічок на помаранчевий для покращення видимості. Цей індикатор допомагає трейдерам ідентифікувати важливі зони на графіку, де свічки мають специфічні риси (без фітіля), і використовується для виявлення потенційних точок для подальших торгівельних рішень.
Що робить цей індикатор:
Зелені свічки без фітіля знизу: Це свічки, у яких ціна відкриття дорівнює мінімуму свічки. Вони позначаються зеленими стрілками під свічкою.
Червоні свічки без фітіля згори: Це свічки, у яких ціна відкриття дорівнює максимуму свічки. Вони позначаються червоними стрілками над свічкою.
Зміна кольору свічок: Свічки, що відповідають умовам (без фітіля знизу або згори), змінюють свій колір на помаранчевий для підвищення видимості та чіткого виділення важливих зон.
Як використовувати:
Цей індикатор допомагає вам ідентифікувати зони, де ціна не має фітіля знизу (для зелених свічок) або згори (для червоних свічок). Ці свічки можуть бути важливими для трейдерів, оскільки вони часто сигналізують про сильні рівні підтримки або опору, де ймовірно відбудеться ретест.
Важливо:
Чекати ретест зони: Після появи таких свічок (особливо у зонах підтримки або опору) можна очікувати, що ці рівні будуть перевірені ще раз. Якщо ціни повертаються до цих зон, це може бути сигналом для входу в ринок.
Торгівля на ретестах: Якщо ціна після першого відскоку знову наближається до цієї зони (де була свічка без фітіля), можна очікувати відскок або продовження тренду, що створює можливість для вхідної позиції.
_______________________________
Description:
This Pine Script v6 indicator analyzes the candles on the chart and identifies those that have no lower or upper wicks. It marks these candles with appropriate markers and changes the candle colors to orange for better visibility. This indicator helps traders identify important zones on the chart where candles exhibit specific characteristics (no wicks), which can be used to spot potential trading opportunities.
What this indicator does:
Green candles with no lower wick: These are candles where the opening price equals the low of the candle. They are marked with a green arrow below the candle.
Red candles with no upper wick: These are candles where the opening price equals the high of the candle. They are marked with a red arrow above the candle.
Candle color change: Candles that meet the conditions (no lower or upper wick) change their color to orange for better visibility and to clearly highlight important zones.
How to use:
This indicator helps you identify zones where prices have no lower wick (for green candles) or no upper wick (for red candles). These candles may be important for traders, as they often indicate strong support or resistance levels where a retest is likely to occur.
Important:
Wait for a zone retest: After these candles appear (especially at support or resistance zones), you can expect these levels to be tested again. If the price returns to these zones, it could signal an opportunity to enter the market.
Trading on retests: If the price approaches the zone (where a wickless candle occurred) again, it may indicate a bounce or trend continuation, which provides a potential entry point.

Volatility Breaker Blocks [BigBeluga]The Volatility Breaker Blocks indicator identifies key market levels based on significant volatility at pivot highs and lows. It plots blocks that act as potential support and resistance zones, marked in green (support) and blue (resistance). Even after a breakout, these blocks leave behind shadow boxes that continue to impact price action. The sensitivity of block detection can be adjusted in the settings, allowing traders to customize the identification of volatility breakouts. The blocks print triangle labels (up or down) after breakouts, indicating potential areas of interest.
🔵 IDEA
The Volatility Breaker Blocks indicator is designed to highlight key areas in the market where volatility has created significant price action. These blocks, created at pivot highs and lows with increased volatility, act as potential support and resistance levels.
The idea is that even after price breaks through these blocks, the remaining shadow boxes continue to influence price movements. By focusing on volatility-driven pivot points, traders can better anticipate how price may react when it revisits these areas. The indicator also captures the natural tendency for price to retest broken resistance or support levels.
🔵 KEY FEATURES & USAGE
◉ High Volatility Breaker Blocks:
The indicator identifies areas of high volatility at pivot highs and lows, plotting blocks that represent these zones. Green blocks represent support zones (identified at pivot lows), while blue blocks represent resistance zones (identified at pivot highs).
Support:
Resistance:
◉ Shadow Blocks after Breakouts:
When price breaks through a block, the block doesn't disappear. Instead, it leaves behind a shadow box, which can still influence future price action. These shadow blocks act as secondary support or resistance levels.
If the price crosses these shadow blocks, the block stops extending, and the right edge of the box is fixed at the point where the price crosses it. This feature helps traders monitor important price levels even after the initial breakout has occurred.
◉ Triangle Labels for Breakouts:
After the price breaks through a volatility block, the indicator prints triangle labels (up or down) at the breakout points.
◉ Support and Resistance Retests:
One of the key concepts in this indicator is the retesting of broken blocks. After breaking a resistance block, price often returns to the shadow box, which then acts as support. Similarly, after breaking a support block, price tends to return to the shadow box, which becomes a resistance level. This concept of price retesting and bouncing off these levels is essential for understanding how the indicator can be used to identify potential entries and exits.
The natural tendency of price to retest broken resistance or support levels.
Additionaly indicator can display retest signals of broken support or resistance
◉ Customizable Sensitivity:
The sensitivity of volatility detection can be adjusted in the settings. A higher sensitivity captures fewer but more significant breakouts, while a lower sensitivity captures more frequent volatility breakouts. This flexibility allows traders to adapt the indicator to different trading styles and market conditions.
🔵 CUSTOMIZATION
Calculation Window: Defines the window of bars over which the breaker blocks are calculated. A larger window will capture longer-term levels, while a smaller window focuses on more recent volatility areas.
Volatility Sensitivity: Adjusts the threshold for volatility detection. Lower sensitivity captures smaller breakouts, while higher sensitivity focuses on larger, more significant moves.
Retest Signals: Display or hide retest signals of shadow boxes

[ArchLabs] Support & Resitance Levels Support & Resistance Levels — SR-v1.100
Smart, auto-managed zones for clean market structure
⸻
🔍 What this indicator does
This script automatically finds and maintains high-quality support & resistance zones on your chart, so you don’t have to keep redrawing levels by hand.
It:
• Detects major swing highs and lows (pivots)
• Builds support and resistance zones (not just thin lines)
• Filters out overlapping / redundant levels
• Tracks how price interacts with those zones in real time
• Marks and alerts:
• ✅ Breakouts
• 🚨 False breakouts
• 🔁 Retests
• Flips broken support → resistance and resistance → support automatically
You get a clean structural map of the market, continuously updated.
⸻
🧠 How levels are built (conceptually)
1. The indicator looks back over a configurable window and finds significant highs and lows (pivots).
2. From each confirmed pivot, it creates:
• A core level price (horizontal line)
• A price area around it (shaded zone), sized relative to recent price range/volatility
3. It then checks for overlaps between existing levels and new candidates:
• If a new level is too close to an existing one (within your overlap threshold), it gets discarded.
• This keeps only the most meaningful, non-redundant levels on the chart.
4. A cap of around 10 levels per side (support / resistance) keeps the view readable.
The result: a curated set of zones that actually matter, not a wall of lines.
⸻
🎨 Visuals on the chart
You’ll see:
• Support zones
• Line: bullish color (default green)
• Area: semi-transparent band below/around the line
• Resistance zones
• Line: bearish color (default red)
• Area: semi-transparent band above/around the line
Colors are customizable for:
• Level line
• Zone area
• Breakout highlight
• Retest label
This makes it easy to visually separate support vs resistance and quickly spot key reactions.
⸻
⚡ Dynamic behavior & level lifecycle
Each level goes through a natural “life cycle,” which the indicator tracks for you:
1. Active zone
• The level is valid and extended to the right as long as price stays “engaged” with it (using smoothed highs/lows to avoid noise).
2. Extension / pause
• When price pulls away from the level far enough, the extension can temporarily stop so the level doesn’t stretch indefinitely without interaction.
• If price comes back into the zone with meaningful action, the level can resume extension.
3. Break & role reversal
• When price cleanly breaks the level (based on smoothed price, not just a wick), the zone is:
• Stopped and locked in place
• Marked as broken
• Immediately cloned and flipped:
• Broken support becomes a new resistance zone at the same area.
• Broken resistance becomes a new support zone.
This gives you automatic role-reversal levels without manually redrawing anything.
⸻
🧷 Event tags & alerts
The indicator tracks three key interactions with each zone:
1. Breakouts (optional)
When price decisively breaks a level:
• A small breakout label appears on/near the level:
• Support broken → bearish breakout style
• Resistance broken → bullish breakout style
• An alert message is fired (if alerts are enabled on the script)
Use this to catch true structural breaks that may signal trend continuation or regime change.
⸻
2. False breakouts (optional)
False breakouts are marked when price:
• Wicks through a level, but
• Fails to close beyond it and quickly returns inside the zone
When detected:
• A 🚨 FB label appears at the level
• The label tracks with price while the false breakout is active
• An alert can fire each time this behavior is confirmed
This is very useful for reversal traders and anyone fading failed breakouts.
⸻
3. Retests (optional)
Retests are detected when:
• Price re-enters a zone after previously moving away from it
• The candle comes back into the area for the first time in this new approach
The script:
• Marks the retest with a “T” label in a distinct color for support vs resistance
• Brings that level to the top of the internal priority list, keeping fresh retests visually and logically “hot”
Traders often use these as high-probability reaction points (e.g., breakout → retest → continuation).
⸻
⚙️ Key settings
All inputs are grouped for clarity:
Support / Resistance Levels
• Pivots Lookback
Controls how far back the indicator looks for swing highs/lows.
• Higher value → fewer, stronger levels
• Lower value → more reactive, more levels
• Overlap Multiplier (Pips)
Sets how aggressively overlapping levels are merged/ignored.
• Higher value → fewer levels, more consolidation
• Lower value → more granular levels
• Auto Overlap
When enabled, the script automatically adjusts the overlap threshold based on timeframe:
• Intraday lower timeframes → tighter filtering
• Higher/intra-session → more appropriate scaling
This lets you drop the indicator on multiple timeframes without constantly retuning.
⸻
Level Event Toggles
• Breakout Labels & Alerts (on/off)
• False Breakout Labels & Alerts (on/off)
• Retest Labels & Alerts (on/off)
Turn on only what fits your style.
Scalpers might want all three; swing traders may prefer only breakouts + retests.
⸻
Support / Resistance Colors
Separate color groups for:
• Line & area of support levels
• Line & area of resistance levels
• Visual styling for breakouts
• Visual styling for retests
You can match your existing chart theme or build a dedicated SR layout.
⸻
📈 How to use it in your trading
Here are a few practical ways to integrate this indicator:
• Context map
Use it as a structural overlay on any symbol/timeframe to see where price is likely to react.
• Breakout + retest setups
• Wait for a level to break with a breakout label.
• Then watch for a T (retest) label into the flipped zone.
• Combine with your own confirmation (price action, volume, oscillators, etc.).
• Mean-reversion & fade trades
• Hunt for false breakout (FB) labels on key levels.
• These are often good spots to fade aggressive moves that lose momentum.
• Confluence builder
• Combine zones with trend tools, VR/DC, moving averages, or higher timeframe structure.
• A breakout/retest at a level that also lines up with higher TF structure can be especially meaningful.
⸻
✅ Summary
Support & Resistance Levels (SR-v1.100) is designed to be:
• Clean – no cluttered spaghetti of lines
• Adaptive – zones evolve with the market and flip roles automatically
• Actionable – breakout, false breakout, and retest events are clearly marked and alert-ready
• Flexible – works on any market and timeframe with simple, intuitive inputs
Drop it on your chart, tune the lookback & overlap to your style, and let it handle the heavy lifting of structural mapping while you focus on decisions.

Cnagda Liquidit Trading SystemCnagda Liquidit Trading System helps spot where price is likely to trap traders and reverse, then gives simple, actionable Level to entry, place SL, and take profits with confidence. It blends imbalance zones, trend bias, order blocks, liquidity pools, high-probability fake Signal, and context-aware candle patterns into one clean workflow.
🟩🟥 Imbalance boxes: “Crowd rushed, gaps left”
What it is: Green/red boxes mark fast, one-sided moves where price “skipped” orders—think FVG-like zones that often get revisited.
Why it helps: Price frequently pulls back to “fill” these zones, creating clean retest entries with logical stops.
⏩How to use:
Green box = potential demand retest; Red box = potential supply retest. Enter on pullback into box, not on first impulse. Put stop on far side of box and aim first targets at recent swing points.
↕️ Swing bias (HH/HL vs LH/LL): “Which way is the road?”
What it is: Higher-highs/higher-lows = up-bias; Lower-highs/lower-lows = down-bias. system plots Buy/Sell OB levels aligned with that bias.
Why it helps: Trading with the broader flow reduces “hero trades” against institutions. Bias gives clearer entries and cleaner drawdowns.
⏩How to use:
Up-bias: look for long on Buy OB retests. Down-bias: look for short on Sell OB retests. Wait for a small rejection/engulfing to confirm before triggering.
🧱Order blocks: “Where big players remember”
What it is: last opposite-colored candle before an impulsive move—these zones often hold memory and reaction. system plots these as Buy/Sell OB lines.
Why it helps: Many breakouts pull back to the origin. Good entries often happen on retest, not on the breakout chase.
⏩ How to use:
Let price return into the OB, show wick rejection, and decent volume. Enter with stop beyond OB; define risk-reward before entry.
📊Volume coloring: “How Volume is move?”
What it is: Bar color reflects relative volume; inside bars are black. The dashboard also shows Volume and “Volume vs Prev.”
Why it helps: Patterns without volume often fade; volume validates strength and intent of moves.
⏩ How to use:
Favor entries where imbalance/OB/liquidity-grab coincide with higher volume. If volume is weak, reduce size or skip.
🧲 BSL/SSL liquidity pools: “Fishing for stops”
What it is: Equal highs cluster stops above (BSL); equal lows cluster stops below (SSL). system plots these and highlights the nearest one (“magnet”).
Why it helps: Price often sweeps these pools to trigger stops before reversing. This is a prime trap-reversal location.
⏩ How to use:
Watch nearest BSL/SSL. If price wicks through and closes back inside, anticipate a reversal. Trade reaction, not first poke. When price closes beyond, consider that pool mitigated and move on.
🟢🔴 Advanced liquidity grab: “Catch fakeout”
What it is: Bullish grab = makes a new low beyond a prior low but closes back above it, with a long lower wick, small body, and higher volume. Bearish is mirror. Labeled automatically.
Why it helps: It exposes trap moves (stop hunts) and often precedes true direction.
⏩ How to use:
Best when it aligns with a nearby imbalance/OB and supportive volume. Enter on reversal candle break or on retest. Stop goes beyond sweep wick.
🧠 Smart candlestick patterns (only in right place)
What it is: Engulfing, Hammer, Shooting Star, Hanging Man, Doji (with high volume), Morning/Evening Star, Piercing—but marked “effective” only if context (swing/trend/location) agrees.
Why it helps: same pattern in the wrong place is noise; in the right place, it’s signal.
⏩ How to use:
Location first (BSL/SSL/OB/imbalance), then pattern. Treat pattern as trigger/confirmation—one fresh label shows to keep chart clean.
🧭 Dashboard: “Context in a glance”
⏩ Reversal Level: current swing anchor—expect turns or reactions nearby; great for alerts and planning.
⏩ Volume vs Prev + Volume: Strength meter for signal candle—higher adds conviction.
⏩ Nearest Pool: next “magnet” area—look for sweeps/rejections there.
🧩Step-by-step trading flow (with mindset)
⏩ Set bias: HH/HL = long bias, LH/LL = short bias. Counter-trend only on clean sweeps with strong confirmation.
⏩ Find magnet: Check Nearest Pool (BSL/SSL). Focus attention there; it saves screen time.
⏩ Wait for event: Look for a sweep/grab label, or sharp rejection at pool/OB/imbalance. Avoid FOMO.
⏩ Add confluence: Stack 2–3 of these—imbalance box, OB, contextual pattern, supportive volume.
⏩Plan entry: Bullish: trigger above reversal candle high or take retest of FVG/OB. Stop below sweep wick/zone. Target at least 1:1.5–1:2.
Bearish: mirror above.
⏩Manage smartly: Take partials, move to breakeven or trail thoughtfully. Don’t drag stops inside zone out of emotion.
🎛️ Parameter tuning (to reduce human error)
⏩ swingLen: Smaller = faster but noisier; larger = cleaner but slower. Backtest first, then go live.
⏩ Tolerance (ATR or percent): ATR tolerance adapts to volatility (good for fast markets and lower TFs). Start around 0.15–0.30. In calm markets, try percent 0.05–0.15%.
⏩ minBarsGap: Start with 3–5 so equal highs/lows are truly equal—reduces false pools.
❌Common mistakes → ✅ Better habits
⏩Chasing every breakout → Wait for sweep/rejection, then confirm.
⏩Ignoring volume → Validate strength; cut size or skip on weak volume.
⏩Losing history of pools → If reviewing/backtesting, keep mitigated pools visible (dashed/faded).
⏩Over-tight tolerance/too small swingLen → Increases false signals; backtest to find balance.
📝 checklist (before entry)
⏩ Is there a nearby BSL/SSL and did a sweep/grab happen there?
⏩ Is there a close imbalance/OB that price can retest?
⏩ Do we have an effective pattern plus supportive volume?
⏩Is the stop beyond the wick/zone and RR ≥ 1:1.5?
•?((¯°·._.• 🎀 𝐻𝒶𝓅𝓅𝓎 𝒯𝓇𝒶𝒹𝒾𝓃𝑔 🎀 •._.·°¯((?•

Supply and demandHi all!
This is my take on supply/demand. The gist is that it creates a zone if there is a big enough reaction. This is configurable in settings as "Minimum range (ATR factor)" (the Average True Length of length 14) that is the distance that the price must travel and "Reaction bars" that is the maximum number of bars that price must travel this distance. The zones that are shown are the ones that have a retest, break and retest or is unmitigated (untouched). If a zone is mitigated (entered) or broken it is temporarily hidden. For a zone to be created it needs to have this reaction and the previous bar does not.
So this script will show you zones that are fresh (unmitigated), retested or broken and retested. This means that the zones that are shown have "proven" that they are good zones through this. Basically it means that the script creates a bunch of zones and then picks the good once. This makes the script have some latency, but will hopefully give you good zones. A zone is completely removed if it's broken twice (it's okay if it's broken once and can still have a retest after it has flipped from previous supply (or resistance) into demand (or support)).
Here is a zone (the one that has the lowest opacity) that is broken and retested that could have resulted in a good long trade (the settings are default but has a stop in the beginning of 2024):
You have a setting to remove zones that are pierced (broken by price wicks). The following zone is pierced by price (in the beginning of May) that will not be shown after the start of May if you have "Pierced" checked (the indicator has default settings but a stop in the middle of April):
You have a trend section. Zones that create a reaction upwards can only be created if the trend is considered to be up, and vice versa. The options here are "SMA50" (the current price needs to be over the Simple Moving Average of length 50) and "SMA50, SMA200" (price needs to be over the Simple Moving Average of length 50 and the Simple Moving Average of length 50 needs to be over the Simple Moving Average of length 200). If these conditions are met the trend is considered to be up, otherwise it's down. You can disable this by choosing "No detection".
The zones that are shown also need to be within a limit (of the current price). This limit is 10 (factor of the Average True Range if length 14) by default. Set this to 0 to deactivate. This is useful for not showing zones that are far away from current price and therefore unlikely to be interacted with.
You can stop the calculation of zones (through the "Stop" value in the settings). This is useful to see if previous zones were any good. I used it in my testing of the script but left it because it can be nice to have.
The zones created by the script have different transparency based upon the zone's interaction. The clearest zones are the ones that are unmitigated, the second clearest ones are the ones having a retest and lastly the zones which are most unclear are the ones having a break and then a retest.
You can see the concept of this script to be a mix of supply/demand and support/resistance, having zones being unmitigated (untouched) as the most important but also show the zones having an interaction (in the form of a retest or a break and retest).
This is from a previous supply (or resistance) zone that has flipped into demand (or support) and has shown to be a good zone through a retest followed by a rally (default settings):
This zone has multiple retest and then rallies that could have given a good long trades (it has the default settings but a "Stop" time at 2022-01-14):
TODO:
- Create zones based on pivots
- Handle overlapping zones
- Incorporate volume in the creation and/or interaction with zones
- Add alerts
- Add ability to set maximum zone width
- Add ability to set the maximum number of retest bars
- ...?
The example for this publication has the default settings bit a "Stop" and a tighter "Limit" of 4.
I hope this explanation makes sense, let me know otherwise. Also let me know if you have any suggestions on improvements.
Best of trading luck!

Liquidity Sweeps [LuxAlgo]The Liquidity Sweeps indicator detects the presence of liquidity sweeps on the user's chart, while also providing potential areas of support/resistance or entry when Liquidity levels are taken.
In the event of a Liquidity Sweep a Sweep Area is created which may provide further areas of interest.
🔶 USAGE
A Liquidity Sweep occurs when the price breaks through a liquidity level (further referred to as LqL ), after which the price returns below/above the liquidity level , forming a wick.
The script provides 2 options when this can happen:
A wick passes a LqL after which the price quickly returns.
First the closing price breaks through a LqL . After a while, the price retests the LqL and forms a wick in the opposite direction.
The examples above show a bullish and bearish scenario of "a wick passing through an LqL where the price quickly comes back". This type of Liquidity Sweep is represented by a dotted line.
The following example shows a broken LqL , where the price retests the Liquidity zone and bounces back.
Instead of a dotted line, this type of Liquidity Sweep is represented by a dashed line.
When a Liquidity Sweep takes place, this is indicated by highlighting the "wick- LqL " distance. This distance is also the basis for the Sweep Area (see next sub-section). A small 3-bar long dotted line starts from the opposite wick as an extra aid to determine potential support/resistance/entry, ...
Colors can be set in the settings (here yellow and aqua blue instead of default colors for clarity).
🔹 Sweep Areas
The distance between the LqL and the maximum limit of the wick forms a Sweep Area , which can provide a potential support/resistance or entry zone.
These examples show both types of Liquidity Sweeps , followed by a box indicating the Sweep Area .
When the Sweep Area is mitigated or a certain amount of bars has passed (Settings - 'Max bars'), the boxes will no longer be updated.
In this case, the 'Trigger' label shows the bar where the high crossed a LqL , after which a red box starts between LqL and high.
The low of the 'Trigger' bar is the starting point of a short dotted line. Next to the 'Trigger bar' the high touches the Sweep Area before returning, providing a potential short entry. One bar further, another entry opportunity presents itself when the price breaks the small dotted line.
In the following bullish example, not only do we see opportunities when the LqL has been swept, but the following Sweep Area provides some potential entries.
The small green dotted lines also act as a guide where the price breaks above, then forms a small range, after which the price continues in an upward direction.
Here, the initial trigger on the left forms a Sweep Area that is quickly broken. However, the small green line provides a potential entry area later on. The price moves in a short channel before breaking above the LqL (green dashed line), providing more potential entries. Price retests this LqL , and goes below this level. The price remained around the previously formed channel, after which the price resumed its upward trend.
🔶 SETTINGS
🔹 Liquidity Sweeps
Swings: Period used for the swing detection, with higher values returning longer term Liquidity Levels .
Options:
- Only Wicks: Only detects a Liquidity Sweep when a wick sweeps a previous wick
- Only Outbreaks & Retest: Only detects a Liquidity Sweep when the price breaks a Liquidity Level , returns & retests the Liquidity Level , and forms a wick in the opposite direction.
- Wicks + Outbreaks & Retest: Both options can be detected.
🔹 Sweep Area
Extend: Enables/Disables extension of the Sweep Area boxes.
Max Bars: Limit the extension to a certain number of bars.
Color Sweep Area box.

PA Swings [TTA]Hello traders!
This script helps identify swing high levels of resistance and swing low levels of support via price action.
The indicator is designed to help identify support and resistance by measuring retracements. When the retracement has reached the threshold, the indicator identifies the high or low with a horizontal, solid line.
This line will continue until it is violated. Once it is violated it will adjust to a dashed line and continue until it is violated again (retested).
Therefore, a solid line resembles an unviolated swing level; a dashed line resembles a violated swing level that has yet to be retested.
Ideally, this script will filter some movements by identifying impulses in the market. Knowing that price is in a trending move rather than bouncing around in a range can help traders in their analysis. In range bound conditions the indicator will show small impulses, sometimes trapped by a support and/or resistance line. In trending markets there will be separation between the support and resistance lines.
Retests are also identified by the indicator.
Retests of swing highs and lows may induce precise, repeatable price moves - something a trader might find advantageous. A log is included to help identify potential price levels based on historical actions when an impulse or a retest occurs.
Consequently, this may help traders identify take-profit targets and avoid stop losses that are too close to the entry point.
The indicator has a color identity panel to help you get familiar with the colored lines, line types, and what they mean. The color panel is concealable. Additional customization options are available, such as toggling the chart labels. These labels distinguish impulses up and down, retests, and the distance price has traveled since breaking or creating a support or resistance level.
This can be toggled off. A High-Volume Swings only option is available for those that wish to filter out low volume movements (such as extended market hours).
You also have the option of hiding far away lines and can define what is “far away” for them % wise. It is defaulted to 15% which may need to be adjusted on lower timeframes.
Inactive lines can be shown or they can be removed in the settings as well. While this indicator can find some great levels of support or resistance it is important to remember that, should you find this script helpful, it is a tool in your toolbox!! (:
Hope you enjoy and thank you for checking this out!

Auction Session Ranges (AMT Edition) [ Alerts] Auction Session Ranges (AMT Edition)
► Overview
The Session Ranges ( AMT Edition) is a session-based market structure and auction analysis tool designed to visually reveal acceptance, rejection, imbalance, and continuation across the Asia, London, and New York CME trading sessions.
Unlike typical indicators, this script is grounded in Auction Market Theory (AMT) and session-based structure, focusing on how price behaves at session extremes rather than relying on lagging calculations, oscillators, or predictive algorithms. Its purpose is to highlight areas where the market has earned the right to be traded, providing traders with a clear, rules-based framework for high-probability directional trades.
Important for backtesting: To properly backtest session extremes, Interaction Lines, and Closest Opposite Extreme Lines, you must use TradingView’s replay mode, as real-time bar-by-bar progression is required to observe how the market interacts with session extremes over time.
► Key Innovations
This is not a conventional session high/low indicator. Its originality comes from several unique design elements:
Differentiates interaction from true acceptance: Price touching an extreme does not automatically indicate directional intent.
Separates directional confirmation from range-bound indecision: Only confirmed crossings beyond the Interaction Line signal actionable bias.
Tracks failed auctions and partial acceptance: No volume profile or order book data required.
Visual, rule-based trade permission: Signals are objective, minimizing subjective interpretation.
Interaction & Closest Opposite Extreme Lines: Together, these lines map how far an auction progresses after an extreme is tested, highlighting continuation, partial acceptance, or failed auctions.
► Core Concepts Explained
1. Session Highs & Lows (Solid Lines)
Plotted continuously for each CME session (Asia, London, New York).
Represent the current auction boundaries for that session.
2. True Interaction Lines (Thick Dotted Lines)
Drawn when price touches or breaks a session extreme:
Touching session high → dotted line at the low of that candle
Touching session low → dotted line at the high of that candle
Auction context:
Touching alone ≠ acceptance
Acceptance occurs only when price moves beyond the Interaction Line and holds
Trading principle:
Price has not crossed → no directional bias → do not trade
Price crosses and holds → directional bias established
3. Acceptance vs Rejection
Accepted direction: Price crosses and holds beyond the Interaction Line
Rejected direction: Price crosses the line but immediately reverses
Neutral / No-Trade: Price trapped between extreme and Interaction Line
Important: Acceptance is conditional and dynamic. Each time price crosses back over the Interaction Line, acceptance is lost.
4. New Extremes = Continuation
Once an Interaction Line is crossed, each new session extreme in that direction reinforces the trend.
Traders should only look for continuation setups along the established directional bias.
AMT interpretation:
Repeated new extremes → directional imbalance
Failure to make new extremes → potential balance or rotation
5. Closest Opposite Extreme Lines (Thin Dotted Lines)
After acceptance, the script tracks price progress toward the opposite session extreme.
Plotted only if price reaches a user-defined percentage of the session range.
Helps identify:
Full acceptance (price reaches opposite extreme)
Partial acceptance (price stalls)
Failed auctions (price cannot progress meaningfully)
Trading guidance once Closest Lines appear:
Partial acceptance: Price stalls near the Closest Line but does not fully reach the opposite extreme → bias remains valid, but the move may be weakening; consider scaling out or tightening stops.
Full acceptance: Price reaches the opposite extreme → directional auction fully confirmed; bias continues, but expect potential rotation or balance afterward.
Failed auction (cannot progress meaningfully): Price reverses before reaching the Closest Line → signals exhaustion; avoid chasing the move and treat as potential trend failure.
Note: Only relevant after Interaction Line is crossed; if price never crosses the Interaction Line, Closest Lines have no trading significance.
► Step-by-Step Usage
Wait for a session extreme
Let price interact with the session high or low.
Observe the Interaction Line
No cross → do not trade
Cross and hold → directional bias established
Trade in the direction of new extremes only
Ignore counter-trend trades unless the Interaction Line is lost
Manage risk using structure
Interaction Line acts as a dynamic invalidation level
Use Closest Lines for context
Partial acceptance → bias valid, watch for weakening
Full acceptance → bias strong, continuation likely
Failed attempt → potential exhaustion, do not chase
Useful for trade management, scaling, and expectation setting
► Price Retests & Pullbacks
Scenario:
Price crosses above the Interaction Line (e.g., from a low interaction).
Over the next 3–4 15-minute bars, price dips back toward the Interaction Line, with wicks touching it but no decisive close below.
Interpretation:
Initial Acceptance Confirmed: Bias remains valid while price holds above/below the line.
Temporary Pullback / Retest: Market is re-evaluating the auction; testing participant agreement.
Wicks Touching the Line: Partial probing or liquidity sweep; market still respects original acceptance.
Trading Implication:
Continuation bias remains intact.
Pullbacks near the Interaction Line offer lower-risk entries.
Decisive close below → acceptance lost, signaling trend failure or invalidation.
Market Psychology:
Healthy auction behavior: extreme tested → acceptance confirmed → boundary retested for liquidity → continuation.
Failure to hold above signals weak acceptance or exhaustion.
✅ Key Takeaways:
Holding above Interaction Line → bias intact, pullback = opportunity
Closing below Interaction Line → acceptance lost, bias invalidated
Wicks touching only → normal retest, still valid
► No-Trade Conditions
Avoid trading when:
Price never crosses the Interaction Line
Price remains trapped between the extreme and the Interaction Line
Market rotates without forming new extremes
These indicate balance, not directional opportunity.
► Alerts
Optional alerts trigger when price crosses an Interaction Line for:
Asia session
London session
New York session
Alerts signal possible acceptance, not automatic trade entries.
► Who This Script Is For
Best suited for traders who:
Trade session structure in futures, indices, or FX
Follow Auction Market Theory principles
Prefer objective, rules-based confirmation
Want fewer but higher-quality trade opportunities
Not intended for:
Indicator stacking
Predictive trading
High-frequency scalping without structure
► Final Notes
This script does not tell you when to buy or sell.
It shows where the market has earned the right to be traded.
Use it as a decision filter, not a prediction engine.

ZenAlgo - LevelsThis script combines multiple anchored Volume-Weighted Average Price (VWAP) calculations into a single tool, providing a continuous record of past VWAP levels and highlighting when price has tested them. Typically, VWAP indicators show only the current VWAP for a single anchor period, requiring you to either keep re-anchoring manually or juggle multiple instances of different VWAP tools for each timeframe. By contrast, this script automatically tracks both the ongoing VWAP and previously completed VWAP values, along with real-time detection of “tests” (when price crosses a particular VWAP level). It’s especially valuable for traders who want to see how price has interacted with VWAP over several sessions, weeks, or months—without switching between separate indicators or manually setting anchors.
Below is a comprehensive explanation of each component, why multiple VWAP lines working together can be more informative than a single line, and how to adjust the script for various markets and trading styles:
Primary VWAP vs. Historical VWAP Lines - Standard VWAP indicators typically focus on the current line only. This script also calculates a primary VWAP, but it “locks in” each completed VWAP value when a new time anchor is detected (e.g., new weekly bar, new monthly bar, new session). As a result, you retain an ongoing history of VWAP lines for every completed anchored period. This is more powerful than manually setting up multiple VWAP tools—one for each desired timeframe—because everything is handled in a single script. You avoid chart clutter and the risk of forgetting to reset your manual VWAP at the correct bar.
Why Combine Multiple Anchored VWAP Lines in One Script? - Viewing several anchored VWAP lines together offers synergy . You see not only the current VWAP but also previous ones from different sessions or months, all within the same chart pane. This synergy becomes apparent if multiple historical VWAP lines cluster near the same price level, indicating a potentially significant zone of volume-based support or resistance. Handling this manually would involve repeatedly setting separate VWAP indicators, each reset at specific points, which is time-consuming and prone to error. In this script, the process is automated: as soon as the anchor changes, a completed VWAP line is stored so you can observe how price eventually reacts to it, repeatedly or not at all.
Automated “Test” Detection - Once a historical VWAP line is set, the script tracks when price crosses it in subsequent bars. If the high and low of a bar span that line, the script marks it in red (both the line and its label). It also keeps a counter of how many times each line has been tested. This method goes beyond a simple visual approach by quantifying the retests. Because all these lines are created and managed in one place, you don’t have to manually label the lines or check them one by one.
Advantages Over Manually Setting Multiple VWAPs
You save screen space: Instead of layering several VWAP indicators, each with unique settings, this single script plots them all on one overlay.
Automation: When a new anchor period begins, the script “closes out” the old VWAP and starts a new one. You never need to remember to reset it manually.
Retest Visualization: The script not only draws each line but also changes color and updates the label automatically if a line gets tested. Doing this by hand would be labor-intensive.
Unified Parameters: All settings (e.g., array size, max distance, test count limit) apply uniformly. You can manage them from one place, instead of configuring multiple separate tools.
Extended Insight with Multiple VWAP Lines
Since VWAP reflects the volume-weighted average price for each chosen period, historical lines can show zones where the market had a fair-value consensus in previous intervals. When the script preserves these lines, you see potential support/resistance areas more distinctly. If, for instance, price continually pivots around an old VWAP line, that may reveal a strong volume-based level. With several older VWAP lines on the chart, you gain an immediate sense of where these volume-derived averages have appeared and how price reacted over time. This wider perspective often proves more revealing than a single “current” VWAP line that does not reflect previous anchor sessions.
Handling of Illiquid Markets and Volume Limitations
VWAP is inherently tied to volume data, so its reliability decreases if volume reporting is missing or if the asset trades with very low liquidity. In such cases, a single large trade might momentarily skew the VWAP, resulting in “false” test signals when the high/low range intersects an abnormal price swing. If you suspect the data is incomplete or the market is unusually thin, it’s wise to confirm the validity of these VWAP lines before using them for any decision-making. Additionally, unusual market conditions—like after-hours trading or sudden high-volatility events—may cause VWAP to shift quickly, setting up multiple lines in a short time.
Key User-Configurable Settings
Hide VWAP on Day timeframe and above : Lets you disable the primary VWAP plot on daily or higher timeframes for a cleaner view.
Anchor Period : Select from Session, Week, Month, Quarter, Year, Decade or Century. Controls how frequently the script resets and preserves the VWAP line.
Offset : Moves the current VWAP line by a specified number of bars if you need a shifted perspective.
Max Array Size : Caps how many past VWAP lines the script will remember. Prevents clutter if you’re charting very long histories.
Max Distance : Defines how far back (in bar index units) a line is kept. If a line’s start bar is older than this threshold, it’s removed, keeping the chart uncluttered.
Max Red Labels : Limits the number of tested (red) VWAP lines that appear. If price tests a large number of old lines, only the newest red labels remain once you hit the set limit.
Workflow Overview
As soon as a new anchor period begins (e.g., a new weekly candle if “Week” is chosen), the script ends the current VWAP and stores that final value in its internal arrays.
It creates a dotted line and label representing the completed VWAP, and keeps track of whether it has been tested or not.
Subsequent bars may then cross that line. If a bar’s high/low includes the line’s value, it’s flagged as tested, labeled red, and a test counter increases.
As new anchored periods come, old lines remain visible—unless they fall outside your maxDistance or you exceed the maximum stored line count.
Real-World Benefits
Combining multiple VWAP lines—ranging, for example, from session-based lines for intraday perspectives to monthly or quarterly lines for broader context—provides a layered view of the volume-based fair price. This can help you quickly spot zones where price repeatedly intersects old VWAPs, potentially highlighting where bulls or bears took action historically. Because this script automates the management of all these lines and flags their retests, it removes a great deal of repetitive manual work that would typically accompany multiple, separate VWAP indicators set to different anchors.
Limitations & Practical Use
As with any volume-related tool, the script depends on reliable volume data. Assets trading on smaller venues or during illiquid periods may produce spurious signals. The script does not signal buy or sell decisions; rather, it helps visually map out where volume-weighted averages from previous periods might still be relevant to market behavior. Always combine the insight from these historical VWAP lines with your existing analytical approach or other technical and fundamental tools you use.
Conclusion
This script unifies past and present VWAP lines into one overlay, automatically detecting new anchor resets, storing the final VWAP values, and indicating whenever old lines are retested by price. It offers synergy through the simultaneous display of multiple historical VWAP lines, making it quicker and easier to detect potential support/resistance zones and better reflect changing market volumes over time. You no longer need to manually create, configure, or reset multiple VWAP indicators. Instead, the script handles all aspects of line creation, retest detection, and clutter management, giving you a robust framework to observe how historical VWAP data aligns with current price action.
By understanding the significance of multiple anchored VWAP lines, you can assess market structure from multiple angles in a single view. As always, ensure you confirm the reliability of the volume data for your particular asset and use these lines in conjunction with other analyses to form a well-rounded perspective on current market behavior.

OA S/R PowerPurpose of the Script
This script identifies the strength of support and resistance levels based on key factors like volume, bounce frequency, and retests. Each level is assigned a score (0-100) and visualized with color-coded labels on the chart.
Key Features
Dynamic Strength Calculation:
Volume Strength: Measures the strength based on the volume of candles touching the level.
Bounce Strength: Evaluates how often the price bounces back from the level.
Retest Strength: Scores the consistency of retests over time.
Color-Coded Visualization:
Yellow: Strong levels (Strength ≥ 70).
Orange: Medium levels (Strength between 50-70).
Red: Resistance levels (Price is below the level).
Green: Support levels (Price is above the level).
Fully Customizable Settings:
Adjust the weight for volume, bounce, and retest contributions.
Configure timeframes, percentage range, and number of levels to analyze.
How It Works
Identify Peaks and Valleys: The script calculates local highs and lows using a configurable width setting to determine potential support and resistance levels.
Filter Key Levels: Nearby levels are merged based on a user-defined percentage range, ensuring clean and relevant levels.
Strength Scoring: Levels are scored dynamically based on:
The number of touches.
The volume of touches.
The frequency of bounces and retests.
Visual Feedback: Each level is plotted on the chart with a color-coded label, indicating its importance and price relationship.
Best Use Cases
Quickly identify strong support/resistance zones for breakout or reversal trades.
Use the dynamic scoring system to prioritize key levels for your strategy.
Customize weights to align with your trading style, such as emphasizing volume or retests.

Smart VWAP FVG SystemSmart VWAP FVG System - Professional Multi-Filter Trading Indicator
📊 OVERVIEW
The Smart VWAP FVG System is an advanced multi-layered trading indicator that combines institutional volume analysis, multi-timeframe VWAP trend confirmation, and Fair Value Gap detection to identify high-probability trade entries. This indicator uses a sophisticated filtering mechanism where signals appear only when multiple independent confirmation criteria align simultaneously.
Recommended Timeframe: 5-minute (M5) or higher. The indicator works best on M5, M15, and M30 charts for intraday trading.
🎯 ORIGINALITY & PURPOSE
This indicator is original because it combines three distinct analytical methods into a unified decision-making system:
Market Profile Volume Analysis - Identifies institutional accumulation/distribution zones
Dual VWAP Filtering - Confirms trend direction using two independent VWAP calculations
Fair Value Gap Detection - Validates institutional interest through price inefficiency zones
The key innovation is the directional filter system: the primary Market Profile generates BUY-ONLY or SELL-ONLY states based on higher timeframe value area reversals, which then controls which signals from the main system are displayed. This creates a multi-timeframe confluence that significantly reduces false signals.
Unlike simple indicator mashups, each component serves a specific purpose:
Market Profile → Direction bias (trend filter)
Primary VWAP (Session) → Short-term trend confirmation
Secondary VWAP (Week) → Medium-term trend confirmation
FVG Detection → Institutional activity validation
🔧 HOW IT WORKS
1. Primary Market Profile Filter (Higher Timeframe)
The indicator calculates Market Profile on a higher timeframe (default: 1 hour) to determine the overall market structure:
Value Area High (VAH): Top 70% of volume distribution
Value Area Low (VAL): Bottom 70% of volume distribution
Point of Control (POC): Price level with highest volume
When price reaches VAH and reverses down → SELL-ONLY mode activated
When price reaches VAL and reverses up → BUY-ONLY mode activated
This higher timeframe filter ensures you're trading in the direction of institutional flow.
2. Dual VWAP System
Two independent VWAP calculations provide multi-timeframe trend confirmation:
Primary VWAP (Session-based): Resets daily, tracks intraday momentum
Secondary VWAP (Week-based): Resets weekly, confirms longer-term trend
Filter Logic:
BUY signals require: Price > Primary VWAP AND Price > Secondary VWAP
SELL signals require: Price < Primary VWAP AND Price < Secondary VWAP
This dual confirmation prevents counter-trend trades during ranging conditions.
3. Fair Value Gap (FVG) Detection
FVG zones identify price inefficiencies where institutional orders were executed rapidly:
Bullish FVG: Gap between candle .high and candle .low (upward imbalance)
Bearish FVG: Gap between candle .high and candle .low (downward imbalance)
The indicator monitors recent FVG formation (lookback: 50 bars) and requires:
Bullish FVG present for BUY signals
Bearish FVG present for SELL signals
FVG zones are displayed as colored boxes and automatically marked as "mitigated" when price fills the gap.
4. Main Trading Signal Logic
The secondary Market Profile (default: 1 hour) generates the actual trading signals:
BUY Signal Conditions:
Price reaches Value Area Low
Reversal pattern confirmed (minimum 1 bar)
Price > Primary VWAP
Price > Secondary VWAP (if filter enabled)
Recent Bullish FVG detected (if filter enabled)
Primary MP Filter = BUY-ONLY or NEUTRAL
SELL Signal Conditions:
Price reaches Value Area High
Reversal pattern confirmed (minimum 1 bar)
Price < Primary VWAP
Price < Secondary VWAP (if filter enabled)
Recent Bearish FVG detected (if filter enabled)
Primary MP Filter = SELL-ONLY or NEUTRAL
All conditions must be TRUE simultaneously for a signal to appear.
📈 VISUAL ELEMENTS
On Chart:
🟢 Green Triangle (▲) = BUY Signal
🔴 Red Triangle (▼) = SELL Signal
🟦 Blue horizontal lines = Value Area zones
🟡 Yellow line = Point of Control (POC)
🟩 Green boxes = Bullish FVG zones
🟥 Red boxes = Bearish FVG zones
🔵 Blue line = Primary VWAP (Session)
⚪ White line = Secondary VWAP (Week)
Info Panel (Top Right):
Real-time status display showing:
Filter Direction (BUY ONLY / SELL ONLY / NEUTRAL)
Active timeframes for both MP filters
FVG filter status and count
VWAP positions (ABOVE/BELOW)
Signal enablement status
Alert status
⚙️ KEY SETTINGS
MP/TPO Filter Settings (Primary Indicator)
MP Filter Time Frame: 60 minutes (controls directional bias)
Filter Value Area %: 70% (standard Market Profile calculation)
Filter Alert Distance: 1 bar
Filter Min Bars for Reversal: 1 bar
Filter Alert Zone Margin: 0.01 (1%)
FVG Filter Settings
Use FVG Filter: Enabled (toggle on/off)
FVG Timeframe: 60 minutes (1 hour)
FVG Filter Mode: Both (require bullish FVG for BUY, bearish for SELL)
FVG Lookback Period: 50 bars (how far back to search)
Show FVG Formation Signals: Optional visual markers
Max FVG on Chart: 50 zones
Show Mitigated FVG: Display filled gaps
Market Profile Settings
Higher Time Frame: 60 minutes (for main signals)
Percent for Value Area: 70%
Show POC Line: Enabled
Keep Old MPs: Enabled (maintain historical profiles)
Primary VWAP Filter
Use Primary VWAP Filter: Enabled
Primary VWAP Anchor Period: Session (resets daily)
Primary VWAP Source: HLC3 (typical price)
Secondary VWAP Filter
Use Secondary VWAP Filter: Enabled
Secondary VWAP Anchor Period: Week (resets weekly)
Secondary VWAP Filter Mode: Both
Secondary VWAP Line Color: White
Trading Signals
Show Trading Signals on Chart: Enabled
Show SELL Signals: Enabled
Show BUY Signals: Enabled
Alert Distance: 1 bar
Min Bars for Reversal: 1 bar
Alert Zone Margin: 0.01 (1%)
Retest Search Period: 20 bars
Min Bars Between Retests: 5 bars
Show Only Retests: Disabled
Alert Settings
Enable Trading Notifications: Enabled
VAH Reversal Alert: Enabled (SELL signals)
VAL Reversal Alert: Enabled (BUY signals)
Time Filter Settings
Filter Alerts By Time: Optional (exclude specific hours)
⚠️ IMPORTANT WARNINGS & LIMITATIONS
1. Repainting Behavior
CRITICAL: This indicator uses lookahead=barmerge.lookahead_on to access higher timeframe data immediately for FVG detection. This is necessary to provide real-time FVG zone visualization but has the following implications:
FVG zones may shift slightly until the higher timeframe candle closes
FVG detection signals are preliminary until HTF bar confirmation
The main trading signals (triangles) appear on confirmed bars and do not repaint
Best Practice: Always wait for the current timeframe bar to close before acting on signals. The filter status and FVG zones are informational but may adjust as new data arrives.
2. Minimum Timeframe
Do NOT use on timeframes below 5 minutes (M5)
Recommended: M5, M15, M30 for intraday trading
Higher timeframes (H1, H4) can also be used but will generate fewer signals
3. Multiple Filters Can Block Signals
By design, this indicator is conservative. When all filters are enabled:
Signals appear ONLY when all conditions align
You may see extended periods with no signals
This is intentional to reduce false positives
If you see no signals:
Check the Info Panel to see which filters are failing
Consider adjusting FVG lookback period
Temporarily disable FVG filter to test
Verify VWAP filters match current market trend
4. Market Profile Limitations
Market Profile requires sufficient volume data
Low-volume instruments may produce unreliable profiles
Value Areas update only on higher timeframe bar close
Works best on liquid markets (major forex pairs, indices, crypto)
📖 HOW TO USE
Step 1: Add to Chart
Apply indicator to M5 or higher timeframe chart
Ensure chart shows volume data
Use standard candles (NOT Heikin Ashi, Renko, etc.)
Step 2: Configure Settings
Primary MP Filter TF: Set to 60 (1 hour) minimum, or 240 (4 hour) for swing trading
Main MP TF: Set to 60 (1 hour) for intraday signals
FVG Timeframe: Match or exceed main MP timeframe
Leave other settings at default initially
Step 3: Understand the Info Panel
Monitor the top-right panel:
FILTER STATUS: Shows current directional bias
NEUTRAL = Both signals allowed
BUY ONLY = Only green triangles will appear
SELL ONLY = Only red triangles will appear
FVG Filter: Shows if bullish/bearish gaps detected recently
VWAP positions: Confirms trend alignment
Step 4: Take Signals
For BUY Signal (Green Triangle ▲):
Wait for green triangle to appear
Check Info Panel shows ✓ for BUY signals
Confirm current bar has closed
Enter long position
Stop loss: Below recent VAL or swing low
Target: Previous Value Area High or 1.5-2× risk
For SELL Signal (Red Triangle ▼):
Wait for red triangle to appear
Check Info Panel shows ✓ for SELL signals
Confirm current bar has closed
Enter short position
Stop loss: Above recent VAH or swing high
Target: Previous Value Area Low or 1.5-2× risk
Step 5: Risk Management
Risk per trade: Maximum 1-2% of account equity
Position sizing: Adjust based on stop loss distance
Avoid trading: During major news events or time filter periods
Multiple confirmations: Look for confluence with price action (support/resistance, trendlines)
🎓 UNDERLYING CONCEPTS
Market Profile Theory
Developed by J. Peter Steidlmayer in the 1980s, Market Profile organizes price and volume data to identify:
Value Areas: Where 70% of trading activity occurred
POC: Price level with highest acceptance (most volume)
Imbalances: When price moves away from value quickly
This indicator uses TPO (Time Price Opportunity) calculation method to build the volume profile distribution.
VWAP (Volume Weighted Average Price)
VWAP represents the average price weighted by volume, showing where institutional traders are positioned:
Price above VWAP = Bullish (institutions accumulated lower)
Price below VWAP = Bearish (institutions distributed higher)
Using dual VWAP (Session + Week) creates multi-timeframe trend alignment.
Fair Value Gaps (FVG)
Also known as "imbalance" or "inefficiency," FVG occurs when:
Price moves so rapidly that a gap forms in the candlestick structure
Indicates institutional order flow (large market orders)
Price often returns to "fill" these gaps (rebalance)
The 3-candle FVG pattern (gap between candle and candle ) is widely used in ICT (Inner Circle Trader) methodology and Smart Money Concepts.
🔍 CREDITS & CODE ATTRIBUTION
This indicator builds upon established technical analysis concepts and combines multiple methodologies:
1. Market Profile / TPO Calculation
Concept Origin: J. Peter Steidlmayer (Chicago Board of Trade, 1980s)
Code Inspiration: TradingView's public domain Market Profile examples
Modifications: Custom filtering logic for directional bias, dual timeframe implementation
2. VWAP Calculation
Concept Origin: Standard financial instrument (widely used since 1980s)
Code Base: TradingView built-in ta.vwap() function (public domain)
Modifications: Dual VWAP system with independent anchor periods, custom filtering modes
3. Fair Value Gap Detection
Concept Origin: Inner Circle Trader (ICT) / Smart Money Concepts methodology
Code Implementation: Original implementation based on 3-candle gap pattern
Features: Multi-timeframe detection, automatic mitigation tracking, visual zone display
4. Pine Script Framework
Language: Pine Script v6 (TradingView)
Built-in Functions Used:
ta.vwap() - Volume weighted average price
request.security() - Higher timeframe data access
ta.change() - Period detection
ta.cum() - Cumulative volume
time() - Timestamp functions
Note: All code is original implementation. While concepts are based on established trading methodologies, the combination, filtering logic, and execution are unique to this indicator.
📊 RECOMMENDED INSTRUMENTS
Best Performance:
Major Forex Pairs (EURUSD, GBPUSD, USDJPY)
Stock Indices (ES, NQ, SPX, DAX)
Major Cryptocurrencies (BTCUSD, ETHUSD)
Liquid Stocks (high daily volume)
Avoid:
Low-volume altcoins
Illiquid stocks
Exotic forex pairs with wide spreads
⚡ PERFORMANCE TIPS
Start Conservative: Enable all filters initially
Reduce Filters Gradually: If too few signals, disable Secondary VWAP filter first
Match Timeframes: Keep MP Filter TF and FVG TF at same value
Backtest First: Review historical performance on your preferred instrument/timeframe
Combine with Price Action: Look for support/resistance confluence
Use Time Filter: Avoid low-liquidity hours (optional setting)
🚫 WHAT THIS INDICATOR DOES NOT DO
Does not guarantee profits - No trading system is 100% accurate
Does not predict the future - Based on historical patterns
Does not replace risk management - Always use stop losses
Does not work on all instruments - Requires volume data and liquidity
Does not provide exact entry/exit prices - Signals are zones, not precise levels
Does not account for fundamentals - Purely technical analysis
📜 DISCLAIMER
This indicator is provided for educational and informational purposes only. It is not financial advice, and past performance does not guarantee future results.
Trading Risk Warning:
All trading involves risk of loss
You can lose more than your initial investment (leverage products)
Only trade with capital you can afford to lose
Always use appropriate position sizing and risk management
Consider seeking advice from a licensed financial advisor
Technical Limitations:
Indicator may repaint FVG zones until HTF bar closes
Signals are based on historical patterns that may not repeat
Market conditions change and no system works in all environments
Volume data quality varies by exchange/broker
By using this indicator, you acknowledge these risks and agree that the author bears no responsibility for trading losses.
📞 SUPPORT & UPDATES
Questions? Comment on this publication
Issues? Describe the problem with chart screenshot
Feature Requests? Suggest improvements in comments
Updates: Will be published as new versions using TradingView's update feature
📝 VERSION HISTORY
Version 1.0 (Current)
Initial public release
Multi-filter system: MP + Dual VWAP + FVG
Directional bias filter
Real-time info panel
Comprehensive alert system
Time-based filtering
Thank you for using Smart VWAP FVG System!
Happy Trading! 📈
