Std Dev Reversal LevelsPlots standard deviation bands around a central mean to identify statistically extreme price levels where reversals are likely.
How It Works
Price statistically tends to stay within predictable ranges around its mean. This indicator plots sigma (σ) levels showing where price becomes statistically extended.
Green lines: Levels above the mean (+1σ to +5σ)
Red lines: Levels below the mean (-1σ to -5σ)
White line: Center/mean (optional)
How To Use
Set timeframe to 1D or 4H
Use Statistical method with 20-30 lookback
Watch for price touching ±3σ levels
Look for reversal confirmation at these extremes
Target the center line for mean reversion plays
Search in scripts for "reversal"

Engulfing Detector by RWBTradeLabEngulfing Detector by RWBTradeLab
A clean, non-repainting engulfing pattern detector designed for traders who rely on price action and candle confirmation.
What this indicator does
This script automatically identifies and highlights two types of engulfing patterns on closed candles only:
1. Regular Engulfing (R EG)
* Regular Buy EG: A bullish candle fully engulfs the previous bearish candle’s high.
* Regular Sell EG: A bearish candle fully engulfs the previous bullish candle’s low.
2. E-Regular Engulfing (ER EG)
* Detects “extended” engulfing setups where a strong base candle is followed by 2 or more opposite-color candles and then a confirming engulf close.
* Useful for spotting delayed but powerful reversals.
Visuals on chart
* A rectangle (box) is drawn from the base candle to the confirmation candle.
* Optional text labels appear above/below the box (offset adjustable).
* Separate color controls for:
- Regular Buy / Regular Sell
- E-Regular Buy / E-Regular Sell
Alerts
Built-in alerts trigger only at candle close:
* R Buy EG
* R Sell EG
* ER Buy EG
* ER Sell EG
Each alert includes price and time in the message.
Key settings
* Candle Length: Scans last N closed candles (running candle excluded).
* On/Off toggles: Enable/disable each engulfing type and labels individually.
* Text Offset (%): Controls label distance from the box.
Non-repainting confirmation
All signals and alerts are calculated using confirmed bars only.
No running-bar signals → no repainting.
Best use
Works on any market and timeframe. For higher reliability, combine with:
* Key S/R zones
* Trend direction
* Volume or structure confirmation
Disclaimer:
This indicator is a pattern-detection tool, not financial advice. Trading involves risk; always use proper risk management and confirm signals with your own analysis.
Creator: RWBTradeLab
If you find this useful, please leave a like ⭐ and share your feedback.

RSI HunterConcept and Methodology This indicator is an advanced technical tool that "reverse engineers" J. Welles Wilder’s standard Relative Strength Index (RSI).
While a standard RSI takes price data and outputs an oscillator value (0-100), this script performs the inverse operation. It calculates exactly what Price the current candle must reach to generate a specific RSI value (e.g., RSI 74 or RSI 26). By projecting these price levels onto the chart, traders can visualize Overbought and Oversold zones in real-time, turning the RSI from a lagging confirmation tool into a leading price-target system.
Key Features
1. Multi-Timeframe (MTF) Projection The indicator allows you to map RSI levels from a higher timeframe onto your current chart. For example, you can view the 3-Hour RSI "Overbought" price levels while trading on a 5-minute chart. This creates distinct "stepped" support and resistance lines that remain valid for the duration of the higher timeframe's candle.
2. Dual Zone Logic The script projects two distinct bands of resistance and support:
Inner Zone (Early Warning): Defaults to RSI 69 / 31. This represents the initial threshold of over-extension.
Outer Zone (Extreme): Defaults to RSI 74 / 26. This represents statistical extremes where mean reversion probabilities are higher.
Zone Shading: The area between the Inner and Outer lines is shaded (Red for Resistance, Green for Support) to visually identify the "Reversal Zone."
3. Smart Wick & Rejection Filter (New) This version introduces a robust filtration system designed to reduce false signals during strong trending moves (often referred to as "falling knives").
How it works: The signal logic is Intra-bar Aware. It continuously asks two questions:
Did the price touch the zone? (Did the High/Low breach the Inner line?)
Did the price reject? (Did the candle Close back inside the neutral channel?)
The Result: Signals are generated only when the price tests the level but closes safely back inside the range. This captures both long-tail wick rejections (single bar) and trend reversals, while suppressing signals when the candle closes deep inside the Overbought/Oversold zones.
How to Interpret
Stepped Lines: These are the dynamic resistance (Red) and support (Green) levels based on the selected Timeframe's RSI.
Large Arrows (Deep Red / Lime Green): Triggered when price touches the Outer (Extreme) band and rejects/closes back below the Inner band.
Small Arrows (Standard Red / Green): Triggered when price touches the Inner (Early) band and rejects/closes back, but did not reach the Outer extreme.
Settings & Defaults
RSI Length: 23
Timeframe: 3 Hours (180 minutes)
Targets: 74/26 (Outer) and 69/31 (Inner)
Filter: "Wait for Confirmed Exit" is ON by default.
Disclaimer This tool is for informational and educational purposes only. RSI projections are mathematical calculations based on historical price averages and do not guarantee future market movements. Always use proper risk management.

CCI [Hash Adaptive]Adaptive CCI Pro: Professional Technical Analysis Indicator
The Commodity Channel Index is a momentum oscillator developed by Donald Lambert in 1980. CCI measures the relationship between an asset's price and its statistical average, identifying cyclical turns and overbought/oversold conditions. The indicator oscillates around zero, with values above +100 indicating overbought conditions and values below -100 suggesting oversold conditions.
Standard CCI Formula: (Typical Price - Moving Average) / (0.015 × Mean Deviation)
This indicator transforms the traditional CCI into a sophisticated visual analysis tool through several key enhancements:
Implements dual exponential moving average smoothing to eliminate market noise
Preserves signal integrity while reducing false signals
Adaptive smoothing responds to market volatility conditions
Dynamic Color Visualization System
Continuous gradient transitions from red (bearish momentum) to green (bullish momentum)
Real-time color intensity reflects momentum strength
Eliminates discrete color jumps for fluid visual interpretation
Adaptive Intelligence Features
Dynamic overbought/oversold thresholds adapt to market conditions
Reduces false signals during high volatility periods
Maintains sensitivity during low volatility environments
Momentum Vector Analysis
Incorporates velocity calculations for early trend identification
Crossover detection with momentum confirmation
Advanced signal filtering reduces market noise
Extreme Level Analysis
Values above +100: Strong overbought conditions, potential reversal zones
Values below -100: Strong oversold conditions, potential buying opportunities
Zero-line crossovers: Momentum shift confirmation
Optimization Parameters
CCI Period (Default: 14)
Shorter periods (10-12): Increased sensitivity, more signals
Standard periods (14-20): Balanced responsiveness and reliability
Longer periods (21-30): Reduced noise, stronger signal confirmation
Smoothing Factor (Default: 5)
Lower values (1-3): Maximum responsiveness, suitable for scalping
Medium values (4-6): Balanced approach for swing trading
Higher values (7-10): Institutional-grade smoothness for position trading
Signal Sensitivity (Default: 6)
Conservative (7-10): High-probability signals, reduced frequency
Balanced (5-6): Optimal risk-reward ratio
Aggressive (1-4): Maximum signal generation, requires additional confirmation
Strategic Implementation
Oversold reversals in red zones with momentum confirmation
Zero-line breaks with sustained color transitions
Extreme readings followed by momentum divergence
Risk Management
Use extreme levels (+100/-100) for position sizing decisions
Monitor color intensity for momentum strength assessment
Combine with price action analysis for comprehensive market view
Market Context Application
Trending markets: Focus on momentum direction and extreme readings
Range-bound markets: Utilize overbought/oversold levels for mean reversion
Volatile markets: Increase smoothing parameters and signal sensitivity
Professional Advantages
Instantaneous momentum assessment through color visualization
Reduced cognitive load compared to traditional oscillators
Professional presentation suitable for client reporting
Adaptive Technology
Self-adjusting parameters reduce manual optimization requirements
Consistent performance across varying market conditions
Advanced mathematics eliminate common CCI limitations
The Adaptive CCI Pro represents the evolution of momentum analysis, combining Lambert's foundational CCI concept with modern computational techniques to deliver institutional-grade market intelligence through an intuitive visual interface.

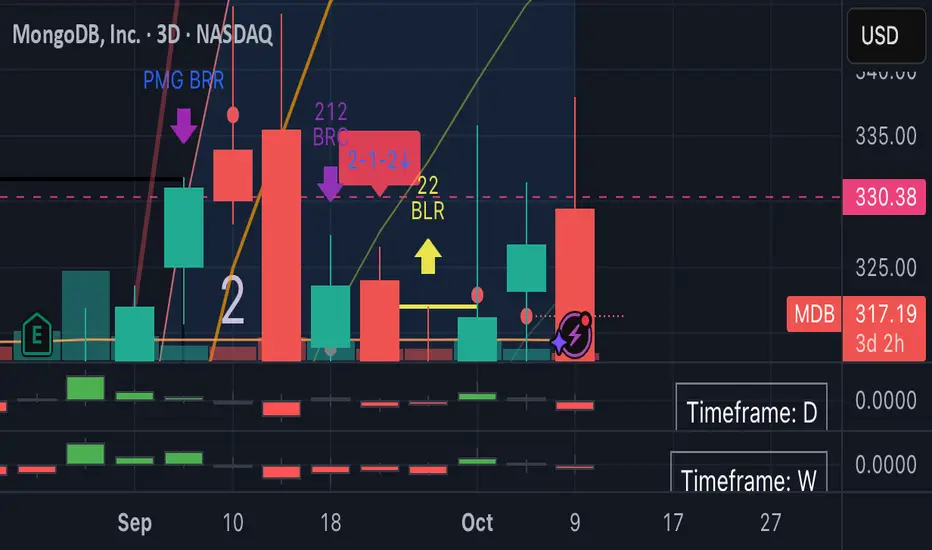
2-1-2 ReversalThis indicator identifies all 2-1-2 price action patterns on any chart or time frame — both reversals and continuations — based on Rob Smith’s The Strat trading system.
🟢 Bullish 2-1-2:
Detected when a directional candle (2D or 2U), followed by an inside bar (1), is followed by a break to the upside (2U).
🔴 Bearish 2-1-2:
Detected when a directional candle (2U or 2D), followed by an inside bar (1), is followed by a break to the downside (2D).
✅ Key Features:
Works on any time frame (1m to Monthly)
No filters — shows every valid 2-1-2 setup
Detects both reversal and continuation patterns
🔔 Built-in alert conditions for Bullish and Bearish setups
🔍 Great for strat traders who want to catch all opportunities, not just hand-picked ones
🧠 Use Case Tips:
Combine with higher time frame trend or broadening formations for confirmation
Works well with sectors (SPY, QQQ, XLE) and ETFs for strat alignment
Add volume, EMA, or other custom confluences for advanced filtering
Three-Bar Reversal/ContinuationThis indicator identifies a three-bar expansion pattern based on range and volume, designed to highlight moments when the market pushes strongly, pauses, and then resumes with confirmation.
Detection Logic
* Bar (two bars ago) must show sufficient strength, determined by the number of conditions met.
* Bar (one bar ago) must be neutral (strength = 0), marking a brief pause.
*Bar (current bar) must continue the expansion, with range and volume greater than the prior bar.
(Bar is used as a safeguard to prevent repeated detection during ongoing strong moves)
Strength Scoring
Each bar is scored 0–3 based on which of the following conditions it satisfies:
* Range exceeds a multiple of the recent average
* Volume exceeds a multiple of the recent average
* Range × volume exceeds a multiple of the recent average
The detection level input controls how many of these conditions must hold to classify a bar as “strong.” This allows tuning from permissive (1 condition) to strict (all 3 conditions).
Parameters & Utility
* length: Lookback period for moving averages of span, volume, and span×volume. Larger values smooth the averages, reducing false positives; smaller values increase sensitivity.
* coeff: Multiplicative threshold to define an unusually strong bar. Higher values reduce frequency but increase reliability.
* detectLevel: Minimum number of conditions that must be met for a bar to count as “strong.”
* showCont: Whether to allow continuation signals away from local extrema (if false, only reversals near highs/lows are considered).
* symbolUp / symbolDown: Customizable plotting symbols for bullish/bearish signals.
* showStrength: Plots tiny dots indicating the strength of each bar (1–3).
Rationale
This structure captures a recurring market motif: strong push → brief pause → renewed push, where the renewed activity is confirmed by both price expansion and volume. Using a combination of statistical thresholds (range, volume, range×volume) and price structure ensures that signals are both measurable and visually interpretable.
Usage Notes
* This setup allows traders to visually or systematically identify potential reversal or continuation points while controlling sensitivity to noise.
* Designed as a mechanical filter rather than a fully automated trading system. Signals highlight notable activity but do not dictate entry, exit, or risk management.
* Works best when combined with trend/context filters or higher-timeframe analysis.
* Adjust the parameters based on the volatility of the instrument and timeframe.

Price Action Key Level Break & Retest — Instant ReversalThis script identifies high-confidence support and resistance levels using pivot points and multi-step retest confirmation. It helps traders detect reliable breakout and reversal zones using price action.
How It Works:
1. The script scans for pivot highs and lows on the chart to identify potential key levels.
2. Each level is monitored for multiple retests (configurable by the user). The more a level is tested and holds, the stronger it becomes.
3. When price interacts with a key level:
o A Support signal occurs if the level acts as support after multiple retests.
o A Resistance signal occurs if the level acts as resistance after multiple retests.
o If a signal fails (price breaks the level), an opposite signal is automatically placed at the breach point.
4. Optional volume filter validates the strength of moves, reducing false signals.
5. Horizontal Line Visualization: Support and Resistance signals are represented by drawing manually horizontal lines, which remain on the chart regardless of scrolling, zooming, or candle compression and helps traders to identify the breakout of key levels
Example:
• Suppose a stock forms a pivot low at ₹1,000.
• Price retraces and touches ₹1,000 two to three times, holding each time — the level is confirmed as strong support.
• The script places a buy line at ₹1,000.
• If price breaks below ₹1,000 after holding it for multiple retests, the script automatically generates a Resistance Signal at the breach point, signaling a potential trend reversal.
• That Resistance Signal act as Resistance level throughout. if such Resistance level breaks out above, it act as Support level and vice versa
• This allows traders to react adaptively, entering trades based on confirmed support or resistance while managing risk.
Why It’s Useful:
• Focuses on multi-retest confirmation rather than single touch points, reducing false signals.
• To draw horizontal lines on key levels, providing clear visualization of key levels without clutter.
• Integrates adaptive breach signals, so traders can respond when levels fail.
• Suitable for swing, intraday, and trend-following strategies.
How to Use:
1. Apply the script to any timeframe.
2. Configure pivot detection length and maximum retests to match trading style.
3. Enable the optional volume filter for stronger signal validation.
4. Monitor the horizontal lines for Support/Resistance signals and opposite signals at breaches.
5. Combine with other technical analysis if desired.
Concepts Behind the Script:
• Pivot-based support and resistance
• Multi-retest validation for stronger levels
• Adaptive opposite signals for failed levels
• Volume-based confirmation for reliability
• Horizontal line visualization for easy tracking
Key Features:
Horizontal Lines visualization: Support and Resistance levels remain on the chart permanently, providing constant visual reference.
Multi-Timeframe Compatible: Can be applied on any timeframe; lines and breach logic adjust automatically.
Optional Noise Filters: Volume and retest filters improve signal reliability.
Why It’s Worth Paying:
• Uses multi-retest confirmation to reduce false signals compared to standard support/resistance scripts.
• Provides adaptive opposite signals for failed levels — giving traders an actionable edge.
• Visualizes key levels as fixed horizontal lines, helping traders track trends clearly.
• Works across multiple timeframes — suitable for intraday, swing, or trend-following strategies.
How to Request Access:
This script is invite-only on TradingView. To get access:
1. DM me on TradingView with your username.
2. Access is granted individually to ensure proper use and avoid unauthorized sharing.
3. Once approved, you can apply the script to your charts immediately and benefit from high-confidence level detection.
Disclaimer:
Trading involves risk. Signals are based on historical price action and should be used alongside other technical analysis and risk management strategies.
Past performance does not guarantee future results. This is an analytical tool; it does not provide investment advice.

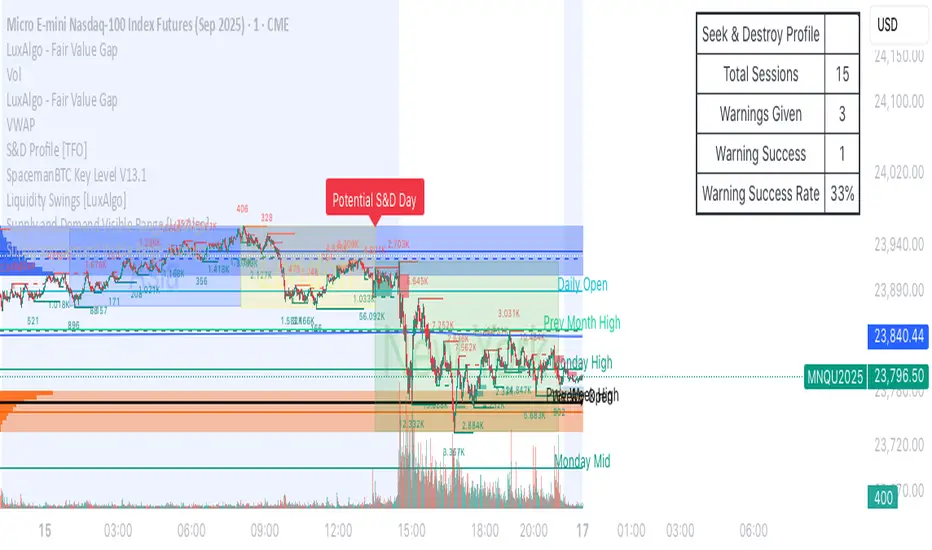
liquidity reversalThis script detects liquidity sweeps and confirms reversals based on price action. It looks for:
- A sweep of a recent high or low
- A reversal candle closing back inside range
- (Optional) Confirmation via market structure break (MSB)
When confirmed, it plots:
- BUY signals after low sweep + bullish break
- SELL signals after high sweep + bearish break
Works on any timeframe. Designed for MNQ scalping during NY open.
VRD-5: Volume Reversal Detector (5 Bars)Overview
This Pine Script indicator detects potential trend reversals based on volume patterns over a 5-bar period. It identifies accumulation (bullish) and distribution (bearish) patterns using volume analysis combined with price action.
Key Features
Volume Analysis:
Compares current volume to a 34-period SMA
Identifies strong/weak volume using configurable thresholds
Calculates volume "energy" as a 5-bar average ratio
Pattern Detection:
Bearish Signal: Looks for decreasing volume after a strong volume bar
Bullish Signal: Looks for increasing volume after weak volume bars
Visualization:
Colored volume histogram (bullish/bearish/neutral)
SMA volume line
Labels for detected signals
Customization Options:
Adjustable lookback period (3-10 bars)
Configurable thresholds for volume strength
Strict mode requiring confirming price action
Suggested Improvements
Performance Optimization:
Reduce the max_labels_count (currently 500) to improve performance
Consider using barstate.isconfirmed for more efficient calculations
Enhanced Visualization:
Add arrows on price chart for better visibility
Include a background color highlight for signal periods
Add option to display the energy level as a separate line
Additional Features:
Incorporate RSI or MACD for confirmation
Add multi-timeframe analysis capability
Include a strategy version for backtesting
Code Structure:
Separate the logic into distinct functions for better readability
Add more detailed comments for complex calculations
Consider using varip for real-time updates if needed
User Experience:
Add input options for label text size/position
Include sound options for alerts
Add a toggle for the information table
This indicator provides a solid foundation for volume-based reversal detection that could be further enhanced with these improvements while maintaining its core functionality.

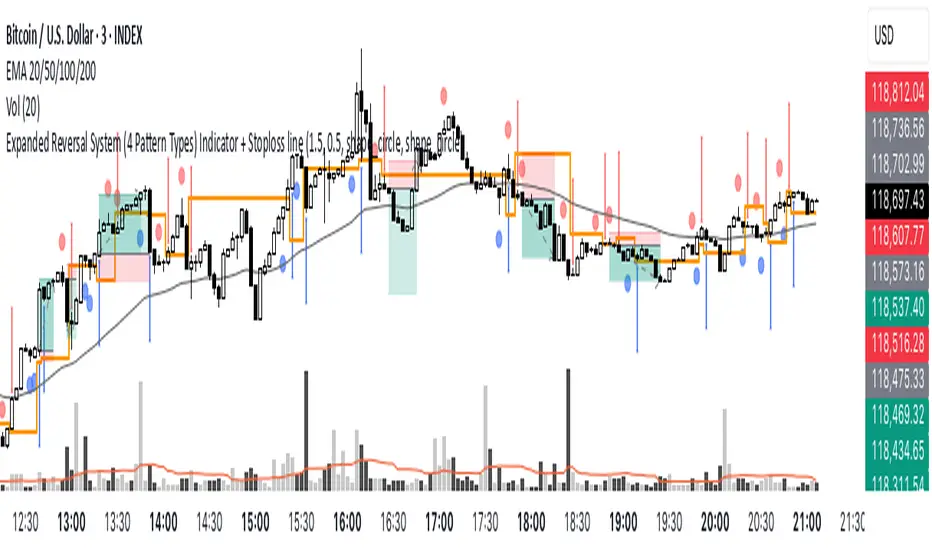
Expanded Reversal System (4 Pattern Types) Indicator + S/LOverview
This is a comprehensive and fully customizable indicator designed to provide clear, reliable, and non-repainting signals for manual traders. Built on a robust 3-bar confirmation logic, this tool aims to eliminate the common errors and visual bugs found in simpler indicators, giving you a professional-grade tool for identifying high-probability reversals.
The indicator not only provides entry signals but also plots the precise Stop Loss level for each setup, taking the guesswork out of your risk management.
How to Trade with This Indicator 🎯
This indicator provides all the necessary information to plan and execute a trade. Here is the step-by-step process:
Step 1: The Setup Circle
First, wait for a Setup Signal (a blue or red circle) to appear on a candle. This is your "heads-up" that a potential trade is forming. This candle is the "Setup Candle."
Step 2: The Trigger Arrow
Next, wait for a Blue BUY Arrow (▲) or a Red SELL Arrow (▼) to appear. This is your confirmation and your signal to prepare to enter.
Step 3: The Entry
You enter the trade at the open of the candle the arrow appears on. This is the "Entry Candle."
Step 4: The Stop Loss
The indicator automatically plots a horizontal orange line on your chart at the same time as the Entry Arrow. This line represents your exact Stop Loss level. It is placed at the low (for buys) or high (for sells) of the candle marked with the Setup Circle.
Step 5: The Take Profit (Risk/Reward)
The Take Profit level must be calculated based on the strategy's Risk/Reward (R:R) ratio.
Step 6: Early invalidation would be a signal in the opposite direction confirmed by an arrow to enter the trade, in that case close the trade and enter in the opposite direction, that's how the strategy has been tested with amazing results.
But if you wish, you could use other confluence for better confirmation, such as volume or bollinger bands.
Exchange assets do not work , you will ned to use the all time index for both the signal indicator and the strategy tester.
Use the trade tool in TV for longs or shorts
Then, apply the appropriate ratio:
Long (Buy) Take Profit (1:6 R:R):
Short (Sell) Take Profit (1:4 R:R):
Fully Customizable Settings 🔧
This indicator gives you full control. In the settings (⚙️ icon), you can:
Individually turn each of the four pattern types (Hammers, Engulfing, Piercing, Dark Cloud) ON or OFF.
Adjust the specific rules for what qualifies as a Pin Bar (Hammer/Shooting Star).
Change the color and shape of all signals (setup shapes, entry arrows, and the stop loss line).
Disclaimer: This is a tool for manual trading and does not constitute financial advice. All trading involves risk, and past performance is not a guarantee of future results. Please use this indicator responsibly as part of a comprehensive trading plan.
SM Trap Detector – Liquidity Sweeps & Institutional ReversalsOverview:
This script is designed to help traders detect Smart Money traps, liquidity grabs, and false breakouts with high precision.
Inspired by institutional trading logic (SMC, ICT, Wyckoff), this tool combines:
🟦 Liquidity Zone Mapping – Detects stop hunt targets near highs/lows
🚨 Trap Candle Detection – Identifies fakeouts using wick + volume logic
✅ Reversal Confirmation – Entry signals based on real market structure
🧭 Dashboard Panel – Always see the last trap type, price, and confirmation
🔔 Real-Time Alerts – Stay notified of traps and entry points
🧠 Logic Breakdown:
Trap Candle = Large wick, small body, volume spike, and sweep of a liquidity zone
Confirmed Entry = Reversal price action following the trap (engulfing-style)
📈 Best Used On:
Markets: Crypto, Forex, Stocks
Timeframes: No limitation but works best on 1H, 4H, Daily
🛠 Suggested Use:
Trade only confirmed entries for best results
Place stops beyond wick highs/lows
Target previous structure or use RR-based exits
📊 Backtest Tip:
Use alerts + replay mode to manually validate past traps.
Note: Please backtest before using it for entry.

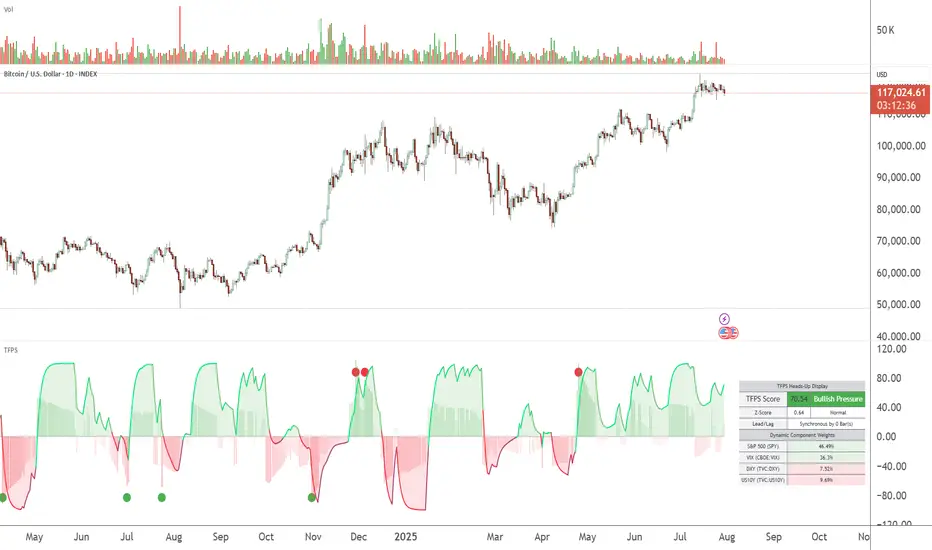
TFPS - TradFi Pressure ScoreThe Data-Driven Answer to a New Market Reality.
This indicator quantifies the pressure exerted by Wall Street on the crypto market across four critical dimensions: Risk Appetite, Fear, Liquidity Flows, and the Opportunity Cost of Capital. Our research has found that the correlation between this 4-dimensional pressure vector and crypto price action reaches peak values of 0.87. This is your decisive macro edge, delivered in real-time.
The Irreversible Transformation
A fundamental analysis of the last five years of market data proves an irreversible transformation: The crypto market has matured into a high-beta risk asset, its fate now inextricably linked to Traditional Finance (TradFi).
The empirical data is clear:
Bitcoin increasingly behaves like a leveraged version of the S&P 500.
The correlation to major stock indices is statistically significant and persistent.
The "digital gold" narrative is refuted by the data; the correlation to gold is virtually non-existent.
This means standard technical indicators are no longer sufficient. Tools like RSI or MACD are blind to the powerful, external macro context that now dominates price action. They see the effect, but not the cause.
The Solution: A 4-Dimensional Macro-Lens
The TradFi Pressure Score (TFPS) is the answer. It is an institutional-grade dashboard that aggregates the four most dominant external forces into a single, actionable score:
S&P 500 (SPY): The Pulse of Risk Appetite. A rising S&P signals a "risk-on" environment, fueling capital flows into crypto.
VIX: The Market's Fear Gauge. A rising VIX signals a "risk-off" flight to safety, draining liquidity from crypto.
DXY (US-Dollar Index): The Anchor of Global Liquidity. A strong Dollar (rising DXY) tightens financial conditions, creating powerful headwinds for risk assets like Bitcoin.
US 10Y Yield: The Opportunity Cost of Capital. Rising yields make risk-free assets more attractive, pulling capital away from non-yielding assets like crypto.
What makes the TFPS truly unique?
1. Dynamic Weighting (The Secret Weapon):
Which macro factor matters most right now? Is it a surging Dollar or a collapsing stock market? The TFPS answers this automatically. It continuously analyzes the correlation of all four components to your chosen asset (e.g., Bitcoin) and adjusts their influence in real-time. The dashboard shows you the exact live weights, ensuring you are always focused on the factor that is currently driving the market.
2. Adaptive Engine:
The forces driving a 15-minute chart are different from those driving a daily chart. The TFPS engine automatically recalibrates its internal lookback periods to your chosen timeframe. This ensures the score is always optimally relevant, whether you are a day trader or a swing trader.
3. Designed for Actionable Insights
The Pressure Line: The indicator's core output. Is its value > 0 (tailwind) or < 0 (headwind)? This provides an instant, unambiguous read on the macro environment for your trade.
The Z-Score (The Contrarian Signal): The background "Stress Cloud" and the discrete dots provide early warnings of extreme macro greed or fear. Readings above +2 or below -2 have historically pinpointed moments of market exhaustion that often precede major trend reversals.
Lead/Lag Status: Gain a critical edge by knowing who is in the driver's seat. The dashboard tells you if TradFi is leading the price action or if crypto is moving independently, allowing you to validate your trade thesis against the dominant market force.
This is a public indicator with protected source code
Access is now available for traders who understand the new market reality at the intersection of crypto and traditional finance.
You are among the first to leverage what is a new standard for macro analysis in crypto trading. Your feedback is highly valued as I continue to refine this tool.
Follow for updates and trade with the full context!
True Breakout Pattern [TradingFinder] Breakout Signal Indicator🔵 Introduction
In many market conditions, what initially appears to be a decisive breakout often turns out to be nothing more than a false breakout or fake breakout. Price breaks through a key swing level or an important support and resistance zone, only to quickly return to its previous range.
These failed breakouts, which are often the result of liquidity traps or market manipulation, serve more as a warning sign of structural weakness than confirmation of a new trend.
This indicator is designed around the concept of the fake breakout.
The logic is simple but precise : when price breaks a swing level and returns to that level within a maximum of five candles, the move is considered a false breakout. At this point, a Fibonacci retracement is applied to the recent price swing to evaluate the pullback area.
If price, within ten candles after the return to the breakout level, enters the Fibonacci zone between 0.618 and 1.0, the setup becomes valid for a potential entry. This area is identified as a long entry zone, with the stop loss placed just beyond the 1.0 level and the take profit defined based on the desired risk-to-reward ratio.
By combining accurate detection of false breakouts, analysis of price reaction to swing levels, and alignment with Fibonacci retracement logic, this framework allows traders to identify opportunities often missed by others. In a market where failed breakouts are a common and recurring phenomenon, this indicator aims to transform these traps into measurable trading opportunities.
Long Setup :
Short Setup :
🔵 How to Use
This indicator operates based on the recognition of false breakouts from structural levels in the market, specifically swing levels, and combines that with Fibonacci retracement analysis.
In this strategy, trades are only considered when price returns to the broken level within a defined time window and reacts appropriately inside a predefined Fibonacci range. Depending on the direction of the initial breakout, the system outlines two scenarios for long and short setups.
🟣 Long Setup
In the long setup, price initially breaks below a support level or swing low. If the price returns to the broken level within a maximum of five candles, the move is identified as a fake breakout.
At this stage, a Fibonacci retracement is drawn from the recent high to the low. If price, within ten candles of returning to the level, moves into the 0.618 to 1.0 Fibonacci zone, the conditions for a long entry are met.
The stop loss is placed slightly below the 1.0 level, while the take profit is set based on the trader’s preferred risk-reward ratio. This setup aims to capture deeply discounted entries at low risk, aligned with smart money reversals.
🟣 Short Setup
In the short setup, the price breaks above a resistance level or swing high. If the price returns to that level within five candles, the move is again treated as a false breakout. Fibonacci is then drawn from the recent low to the high to observe the retracement area.
Should price enter the 0.618 to 1.0 Fibonacci range within ten candles of returning, a short entry is considered valid. In this case, the stop loss is placed just above the 1.0 level, and the take profit is adjusted based on the intended risk-reward target. This method allows traders to identify high-probability short setups by focusing on failed breakouts and deep pullbacks.
🔵 Settings
🟣 Logical settings
Swing period : You can set the swing detection period.
Valid After Trigger Bars : Limits how many candles after a fake breakout the entry zone remains valid.
Max Swing Back Method : It is in two modes "All" and "Custom". If it is in "All" mode, it will check all swings, and if it is in "Custom" mode, it will check the swings to the extent you determine.
Max Swing Back : You can set the number of swings that will go back for checking.
🟣 Display settings
Displaying or not displaying swings and setting the color of labels and lines.
🟣 Alert Settings
Alert False Breakout : Enables alerts for Breakout.
Message Frequency : Determines the frequency of alerts. Options include 'All' (every function call), 'Once Per Bar' (first call within the bar), and 'Once Per Bar Close' (final script execution of the real-time bar). Default is 'Once per Bar'.
Show Alert Time by Time Zone : Configures the time zone for alert messages. Default is 'UTC'.
🔵 Conclusion
A sound understanding of the false breakout phenomenon and its relationship to structural price behavior is essential for technical traders aiming to improve precision and consistency. Many poor trading decisions stem from misinterpreting failed breakouts and entering too early into weak signals.
A structured approach, grounded in the analysis of swing levels and validated through specific price action and timing rules, can turn these misleading moves into valuable trade opportunities.
This indicator, by combining fake breakout detection with time filters and Fibonacci-based retracement zones, helps traders only engage with the market when multiple confirming factors are in alignment. The result is a strategy that emphasizes probability, risk control, and clarity in decision-making, offering a solid edge in navigating today’s volatile markets.

Momentum Trail Oscillator [AlgoAlpha]🟠 OVERVIEW
This script builds a Momentum Trail Oscillator designed to measure directional momentum strength and dynamically track shifts in trend bias using a combination of smoothed price change calculations and adaptive trailing bands. The oscillator aims to help traders visualize when momentum is expanding or contracting and to identify transitions between bullish and bearish conditions.
🟠 CONCEPTS
The core idea combines two methods. First, the script calculates a normalized momentum measure by smoothing price changes relative to their absolute values, which creates a bounded oscillator that highlights whether moves are directional or choppy. Second, it uses a trailing band mechanism inspired by volatility stops, where bands adapt to the oscillator’s volatility, adjusting the thresholds that define a shift in directional bias. This dual approach seeks to address both the magnitude and persistence of momentum, reducing false signals in ranging markets.
🟠 FEATURES
The momentum calculation applies Hull Moving Averages and double EMA smoothing to price changes, producing a smooth, responsive oscillator.
The trailing bands are derived by offsetting a weighted moving average of the oscillator by a multiple of recent momentum volatility. A directional state variable tracks whether the oscillator is above or below the bands, updating when the momentum crosses these dynamic thresholds.
Overbought and oversold zones are visually marked between fixed levels (+30/+40 and -30/-40), with color fills to highlight when momentum is in extreme areas. The script plots signals on both the oscillator pane and optionally overlays markers on the main price chart for clarity.
🟠 USAGE
To use the indicator, apply it to any symbol and timeframe. The “Oscillator Length” controls how sensitive the momentum line is to recent price changes—lower values react faster, higher values smooth out noise. The “Trail Multiplier” sets how far the adaptive bands sit from the oscillator mid-line, which affects how often trend state changes occur. When the momentum line rises into the upper filled area and then crosses back below +40, it signals potential overbought exhaustion. The opposite applies for the oversold zone below -40. The plotted trailing bands switch visibility depending on the current directional state: when momentum is trending up, the lower band acts as the active trailing stop, and when trending down, the upper band becomes active. Trend changes are marked with circular symbols when the direction variable flips, and optional overlay arrows appear on the price chart to highlight overbought or oversold reversals. Traders can combine these signals with their own price action or volume analysis to confirm entries or exits.

HA Reversal StrategyCertainly! Here's a detailed **description (elaboration)** for the **"HA Candle Test"** (i.e., the Heikin Ashi strategy script I just gave you):
---
### 📌 **Script Name**: HA Candle Test
### 📖 **Description**:
This script visualizes **Heikin Ashi candles** and identifies **trend reversal signals** using classic momentum candle behavior — particularly the appearance of **no-wick candles**, which are known to reflect strong directional pressure in Heikin Ashi charts.
It aims to **capture high-probability trend reversals** with minimal noise, relying on the natural smoothing behavior of Heikin Ashi candles.
---
### ✅ **Buy Signal Conditions**:
* At least **two consecutive red Heikin Ashi candles** (indicating a short-term downtrend).
* Followed by a **green Heikin Ashi candle** that has **no lower wick** (i.e., open == low).
* This suggests that **buyers have taken full control**, with no push from sellers — a potential start of an uptrend.
📍 **Interpreted as**: “Market was selling off, but now buyers stepped in strongly — time to consider buying.”
---
### ✅ **Sell Signal Conditions**:
* At least **two consecutive green Heikin Ashi candles** (short-term uptrend).
* Followed by a **red Heikin Ashi candle** that has **no upper wick** (i.e., open == high).
* This implies **sellers are dominating**, with no attempt from buyers to push higher — possible start of a downtrend.
📍 **Interpreted as**: “Market was rallying, but sellers just took over decisively — time to consider selling.”
---
### 📊 **Visual Aids Included**:
* Plots **Heikin Ashi candles** on your main chart for clarity.
* Uses **Buy** and **Sell** label markers (green & red) at signal points.
* Compatible with any timeframe — higher timeframes typically yield stronger signals.
---
### 💡 **Suggested Use**:
* Combine with **support/resistance**, **volume**, or **trend filters** for more robust setups.
* Works well on **1H, 4H, and Daily charts** in trending markets.
* Can be used manually or turned into an automated strategy for backtesting or alerts.
---
Would you like this script packaged as a **strategy()** for backtesting, or would you like me to add **alerts** so you can get notified in real-time when signals appear?

BB Vicinity Reversal SignalsThis indicator detects potential intraday reversal opportunities based on price action near the outer edges of Bollinger Bands (±2.7 std dev). Unlike traditional Bollinger Band signals that require strict band touches or crossings, this tool identifies reversals that occur in the vicinity of the outer bands, increasing signal frequency while maintaining logical precision.
✅ Key Features:
Buy Signal: Triggered when a bullish candle with a strong body forms near the lower Bollinger Band.
Sell Signal: Triggered when a bearish candle with a strong body forms near the upper Bollinger Band.
Vicinity logic: User-adjustable % range from the outer bands (default: 20%) to define how close price must be.
Body-to-candle ratio filter: Ensures that only meaningful directional candles trigger signals.
No repainting: All signals are generated in real-time based on confirmed candle closes.
Built-in alerts: Receive instant notifications for buy and sell setups.
This tool is ideal for traders looking to capture high-probability mean-reversion trades without being overly restrictive. It works well on intraday timeframes like 5m, 15m, and 1h.

Trend Classifier [ChartPrime]Trend Classifier
This is a multi-level trend classification tool that detects bullish, bearish, and ranging conditions using an adaptive smoothing method. It highlights trend strength through color-coded candles and layered bands, making it easy to interpret market momentum visually.
⯁ KEY FEATURES
Classifies trend strength using 3 bullish and 3 bearish levels relative to an adaptive trend line.
Neutral (range) zones are marked when price stays between key bands, often signaling low volatility or consolidation.
Automatically filters band visibility based on current trend direction:
In uptrends, only levels below the price are displayed.
In downtrends, only levels above the price are shown.
Color-coded candles:
Aqua candles for bullish conditions.
Red candles for bearish conditions.
Orange candles during neutral or ranging conditions.
Includes a trend direction change marker (diamond), plotted when a shift in trend is detected.
Plots a central smoothed trend line to anchor the trend bands dynamically.
Displays a trend strength dashboard in the top-right corner with real-time bull and bear scores (0 to 3).
Labels with arrows (▲/▼) show current trend direction and strength on the chart.
⯁ HOW TO USE
Use bull and bear levels (1–3) to assess the momentum of the current trend.
When bull = 0 and bear = 0 , market is considered ranging or consolidating – consider fading or waiting for breakout confirmation.
Trend bands can be used as dynamic support/resistance during trending phases.
Monitor the trend change diamonds to spot potential early reversals.
Combine with volume or oscillator tools for confirmation of strength shifts.
⯁ CONCLUSION
Trend Classifier helps traders stay aligned with the dominant trend while visually breaking down market momentum into levels. Its clean color-coded design and strength dashboard make it ideal for both trend following and range trading strategies.

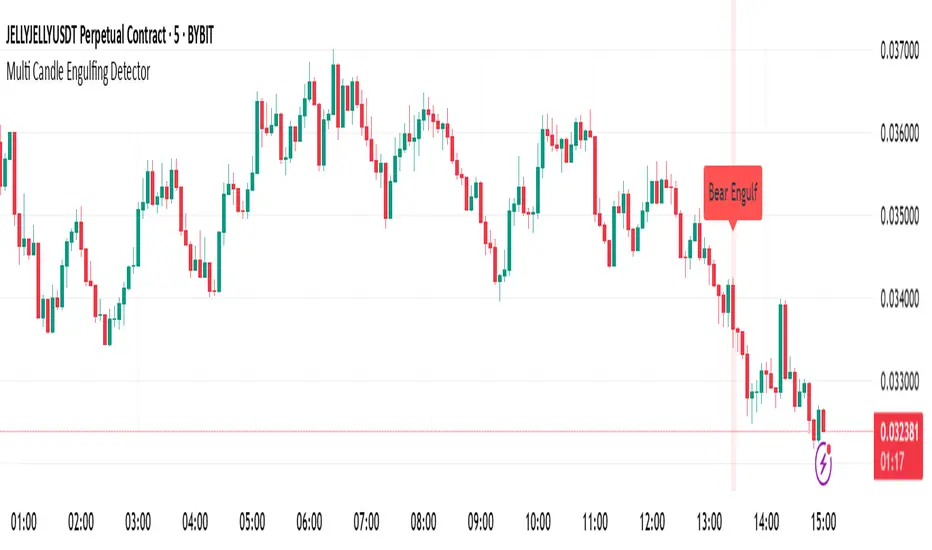
Multi Candle Engulfing Detector🔍 Multi Candle Engulfing Detector
This indicator identifies powerful engulfing candles that consume three or more previous candles — a signal often tied to strong market reversals or continuation moves.
🧠 Features
Detects candles that fully engulf the previous 3 or more candles
Optional filtering: only trigger when the engulfed candles are of the opposite color
Customizable engulf count for greater pattern control
Clear bullish and bearish signal labels on the chart
Alerts integrated: get notified the moment a setup forms
Background highlighting for enhanced visibility
⚙️ Settings
Minimum Number of Candles to Engulf: Default is 3, but can be adjusted
Require Opposite Color: When enabled, the engulfing candle must be opposite in color to the engulfed ones (e.g., green engulfing red)
📈 Use Cases
Spot strong reversal signals at tops and bottoms
Confirm breakout momentum on trend continuation
Use in confluence with other tools like volume or support/resistance
🚨 Alerts
Alerts fire when a bullish or bearish engulfing pattern is detected, allowing for mobile, email, or webhook notifications.
✅ Notes
This script is fully customizable and can be extended into a strategy or scanning tool. Feedback and suggestions are always welcome!
Bullish & Bearish Engulfing ProHello Traders!
Overview
The Bullish & Bearish Engulfing Pro indicator is a powerful pattern recognition tool that identifies key reversal points and trend continuation opportunities. These engulfing patterns often mark the beginning of a significant price move and are widely used in technical analysis. For example, in an uptrend, a Bullish Engulfing pattern can provide an ideal pullback entry signal.
This indicator combines traditional candlestick theory with advanced technical filters like trend direction and volatility analysis to offer traders precise, high-confidence signals.
Key Features :
Accurate pattern detection:
Uses refined algorithms to detect true Bullish and Bearish Engulfing patterns, filtering out noise and false positives.
Trend filter:
Customizable Simple Moving Average (SMA) ensures trades are aligned with the market’s broader trend, improving trade success rates.
Volatility awareness:
ATR-based filtering ensures that only statistically significant engulfing patterns are highlighted.
Visual clarity:
Bullish and Bearish Engulfing patterns are displayed with distinct, customizable colors and labels for instant recognition.
Flexible customization:
Users can adjust detection criteria, SMA settings, and visual options to suit their personal strategy.
Filtered signal display:
Option to visualize filtered-out signals to better understand how the logic makes its decisions.
Bullish Engulfing Pattern
Appears after a downtrend or during a pullback in an uptrend
Consists of two candles
A smaller bearish candle
Followed by a larger bullish candle that completely engulfs the previous body
Bearish Engulfing Pattern
Appears after an uptrend or during a pullback in a downtrend
Consists of two candles
A smaller bullish candle
Followed by a larger bearish candle that completely engulfs the previous body
Key differences in this implementation
What makes this indicator unique
Trend and volatility filters
Ensure patterns occur in meaningful market conditions
Comprehensive pattern analysis:
Factors in candle body ratios, wick sizes, and relative size to past candles for smarter detection
Adaptive to market conditions:
Dynamic thresholds based on ATR allow pattern recognition to adjust to different volatility regimes
Educational value:
Visualizing rejected patterns helps traders build intuition and refine their discretion
How to Trade with this Indicator
Engulfing patterns can signal strong reversals or pullback continuations. Use them with trend and volume confirmation to maximize their effectiveness.
snapshot
Bullish Opportunities:
Look for Bullish Engulfing patterns (aqua-colored candles and labels) during or after a pullback in an uptrend.
Bearish Opportunities:
Watch for Bearish Engulfing patterns (orange-colored candles and labels) during or after a rally in a downtrend.
Entry: Enter on the next bar open after the engulfing candle completes.
Stop loss: 2 ticks below/above the engulfing candle’s low/high.
Take profit: Aim for at least a 2R target, a swing high/low or manage the tradewith a trailing stop.
Trend Alignment:
For higher win probability, take trades only in the direction of the SMA-defined trend.
Note: To ensure the candle coloring appears correctly, place the indicator at the top of the object tree.

Smarter Money Concepts - OBs [PhenLabs]📊 Smarter Money Concepts - OBs
Version: PineScript™ v6
📌 Description
Smarter Money Concepts - OBs (Order Blocks) is an advanced technical analysis tool designed to identify and visualize institutional order zones on your charts. Order blocks represent significant areas of liquidity where smart money has entered positions before major moves. By tracking these zones, traders can anticipate potential reversals, continuations, and key reaction points in price action.
This indicator incorporates volume filtering technology to identify only the most significant order blocks, eliminating low-quality signals and focusing on areas where institutional participation is likely present. The combination of price structure analysis and volume confirmation provides traders with high-probability zones that may attract future price action for tests, rejections, or breakouts.
🚀 Points of Innovation
Volume-Filtered Block Detection : Identifies only order blocks formed with significant volume, focusing on areas with institutional participation
Advanced Break of Structure Logic : Uses sophisticated price action analysis to detect legitimate market structure breaks preceding order blocks
Dynamic Block Management : Intelligently tracks, extends, and removes order blocks based on price interaction and time-based expiration
Structure Recognition System : Employs technical analysis algorithms to find significant swing points for accurate order block identification
Dual Directional Tracking : Simultaneously monitors both bullish and bearish order blocks for comprehensive market structure analysis
🔧 Core Components
Order Block Detection : Identifies institutional entry zones by analyzing price action before significant breaks of structure, capturing where smart money has likely positioned before moves.
Volume Filtering Algorithm : Calculates relative volume compared to a moving average to qualify only order blocks formed with significant market participation, eliminating noise.
Structure Break Recognition : Uses price action analysis to detect legitimate breaks of market structure, ensuring order blocks are identified only at significant market turning points.
Dynamic Block Management : Continuously monitors price interaction with existing blocks, extending, maintaining, or removing them based on current market behavior.
🔥 Key Features
Volume-Based Filtering : Filter out insignificant blocks by requiring a minimum volume threshold, focusing only on zones with likely institutional activity
Visual Block Highlighting : Color-coded boxes clearly mark bullish and bearish order blocks with customizable appearance
Flexible Mitigation Options : Choose between “Wick” or “Close” methods for determining when a block has been tested or mitigated
Scan Range Adjustment : Customize how far back the indicator looks for structure points to adapt to different market conditions and timeframes
Break Source Selection : Configure which price component (close, open, high, low) is used to determine structure breaks for precise block identification
🎨 Visualization
Bullish Order Blocks : Blue-colored rectangles highlighting zones where bullish institutional orders were likely placed before upward moves, representing potential support areas.
Bearish Order Blocks : Red-colored rectangles highlighting zones where bearish institutional orders were likely placed before downward moves, representing potential resistance areas.
Block Extension : Order blocks extend to the right of the chart, providing clear visualization of these significant zones as price continues to develop.
📖 Usage Guidelines
Order Block Settings
Scan Range : Default: 25. Defines how many bars the indicator scans to determine significant structure points for order block identification.
Bull Break Price Source : Default: Close. Determines which price component is used to detect bullish breaks of structure.
Bear Break Price Source : Default: Close. Determines which price component is used to detect bearish breaks of structure.
Visual Settings
Bullish Blocks Color : Default: Blue with 85% transparency. Controls the appearance of bullish order blocks.
Bearish Blocks Color : Default: Red with 85% transparency. Controls the appearance of bearish order blocks.
General Options
Block Mitigation Method : Default: Wick, Options: Wick, Close. Determines how block mitigation is calculated - “Wick” uses high/low values while “Close” uses close values for more conservative mitigation criteria.
Remove Filled Blocks : Default: Disabled. When enabled, order blocks are removed once they’ve been mitigated by price action.
Volume Filter
Volume Filter Enabled : Default: Enabled. When activated, only shows order blocks formed with significant volume relative to recent average.
Volume SMA Period : Default: 15, Range: 1-50. Number of periods used to calculate the average volume baseline.
Min. Volume Ratio : Default: 1.5, Range: 0.5-10.0. Minimum volume ratio compared to average required to display an order block; higher values filter out more blocks.
✅ Best Use Cases
Identifying high-probability support and resistance zones for trade entries and exits
Finding optimal stop-loss placement behind significant order blocks
Detecting potential reversal areas where price may react after extended moves
Confirming breakout trades when price clears major order blocks
Building a comprehensive market structure map for medium to long-term trading decisions
Pinpointing areas where smart money may have positioned before major market moves
⚠️ Limitations
Most effective on higher timeframes (1H and above) where institutional activity is more clearly defined
Can generate multiple signals in choppy market conditions, requiring additional filtering
Volume filtering relies on accurate volume data, which may be less reliable for some securities
Recent market structure changes may invalidate older order blocks not yet automatically removed
Block identification is based on historical price action and may not predict future behavior with certainty
💡 What Makes This Unique
Volume Intelligence : Unlike basic order block indicators, this script incorporates volume analysis to identify only the most significant institutional zones, focusing on quality over quantity.
Structural Precision : Uses sophisticated break of structure algorithms to identify true market turning points, going beyond simple price pattern recognition.
Dynamic Block Management : Implements automatic block tracking, extension, and cleanup to maintain a clean and relevant chart display without manual intervention.
Institutional Focus : Designed specifically to highlight areas where smart money has likely positioned, helping retail traders align with institutional perspectives rather than retail noise.
🔬 How It Works
1. Structure Identification Process :
The indicator continuously scans price action to identify significant swing points and structure levels within the specified range, establishing a foundation for order block recognition.
2. Break Detection :
When price breaks an established structure level (crossing below a significant low for bearish breaks or above a significant high for bullish breaks), the indicator marks this as a potential zone for order block formation.
3. Volume Qualification :
For each potential order block, the algorithm calculates the relative volume compared to the configured period average. Only blocks formed with volume exceeding the minimum ratio threshold are displayed.
4. Block Creation and Management :
Valid order blocks are created, tracked, and managed as price continues to develop. Blocks extend to the right of the chart until they are either mitigated by price action or expire after the designated timeframe.
5. Continuous Monitoring :
The indicator constantly evaluates price interaction with existing blocks, determining when blocks have been tested, mitigated, or invalidated, and updates the visual representation accordingly.
💡 Note:
Order Blocks represent areas where institutional traders have likely established positions and may defend these zones during future price visits. For optimal results, use this indicator in conjunction with other confluent factors such as key support/resistance levels, trendlines, or additional confirmation indicators. The most reliable signals typically occur on higher timeframes where institutional activity is most prominent. Start with the default settings and adjust parameters gradually to match your specific trading instrument and style.

Upside Reversal ScreenerIndicator mainly intended to be used in Pinescript screener to find Upside Reversals - where an instruments drops in price then reverses.
The minimum drop (as % or % of instrument ATR) and minimum recovery (as fraction of drop) can be specified.
When used as an indicator (Set the "Running in Screener" input to False in the settings) an up arrow will show under the days where an upside reversal occurred.
To use in a screener, set it as a favourite indicator, so it will be showin in the PineScript screener.
The indicator publishes the Open, High, Low, Close (or last) prices, % price change, % of drop (from high), the recovery (as % of drop), and if the stock matched the reverse settings.

Volatility Price FlowCapitalize on market volatility with our new volatility price flow indicator. We have designed this indicator to process historical price movements and indicate when price may have reached exhaustion in the context of current volatility.
This is achieved by taking the price deviation from a user defined moving average, and applying a weighting to the deviations from the candle body and candle wick on both buy side and sell side, over a user defined period. The period of the base moving average, type of moving average and the period of the historical price deviations can all be modified. This creates a typical 'band' style indicator, though with a unique characteristic that the buy and sell side vary independently as well as the band expansion being based on weighted variables tied to the actual price changes, rather than just a standard deviation the moves uniformly.
Additionally, these bands can be merged with an anchored vwap - we do this so that the deviations of price from the moving average can include a more volume based approach to identifying potential pivots.
The end result is an indicator that reflects the current market price movements, identifies and capitalizes on impulsive or beginning moves to indicate potential tops / bottoms / reversals.
The signals are simple - anytime price closes within a band, having been outside the band, a signal is displayed. As a basic guide to setting the indicator up for the first time, we suggest reducing all of the multipliers to a value less than 1. Then gradually increase each one, until the signals reduce in quantity and improve in quality, starting with the price deviation multiplier, then the volatility multiplier and finally the expansion multiplier.
Last of all, alerts can be created based on the current chart timeframe and indicator settings, simply by adding an alert that uses the built in buy or sell signal.
Note: We cannot guarantee the accuracy of the signals provided, since the user creates the signals by modifying the settings, and as such we can take no responsibility for any trading losses incurred using the indicator and highly encourage all users to manage their risk and only risk what you can afford to lose.

Overextension Oscillator [by DanielM]The Overextension Oscillator is an indicator that detects when a market move has extended significantly beyond its typical range, signaling potential areas for a correction or reversal. Unlike traditional oscillators that rely on fixed overbought/oversold levels, this tool dynamically adjusts its thresholds based on historical swing high and swing low movements.
By analyzing all swing points on the chart, the indicator determines the expected range of price movements and identifies when the price extends beyond normal levels. Since every asset has different price behavior and volatility, swing lengths may vary from asset to asset, ensuring that overextension is measured relative to each market's historical price behavior.
How It Works
1️⃣ Swing Detection & Data Collection
The indicator scans all available swing highs and swing lows on the chart to gather a complete dataset of past price fluctuations.
It records the percentage differences between swings to determine how much price typically moves in a given market.
2️⃣ Overextension Calculation
Using the stored swing data, the indicator calculates:
Average Swing Difference – Measures the average percentage difference between swings.
Average Move Percentage – Determines the typical magnitude of price moves within a trend cycle.
These values are used to create dynamic overextension thresholds that adjust based on historical data.
3️⃣ Price Distance & Overextension Measurement
The indicator calculates the distance between the current price and the closest historical swing point. If this distance exceeds the predefined threshold based on past swings, the move is considered overextended. The greater the deviation, the higher the probability of a pullback or short-term reversal.
4️⃣ Buy/Sell Signal Generation
A Buy signal is generated when the price has dropped below an overextended threshold relative to a past swing low.
A Sell signal is generated when the price has risen beyond an overextended threshold relative to a past swing high.
These signals indicate that the price has reached a level where it historically tends to slow down or reverse.
