Std Dev Reversal LevelsStd Dev Reversal Levels. Uses STD devs
Std Dev Reversal Levels. Uses STD devs
Std Dev Reversal Levels. Uses STD devs
Std Dev Reversal Levels. Uses STD devs
Std Dev Reversal Levels. Uses STD devs
Std Dev Reversal Levels. Uses STD devs
Search in scripts for "reversal"

Trend Reversal by George - Reversal ColorsTrend Reversal by George - Reversal Colors
This indicator is designed to visually identify major shifts in market trends and signal trend continuity. By analyzing dynamic price action, it detects when market sentiment flips between bullish and bearish control.
The tool focuses on relying entirely on candlestick coloring to communicate market state:
Reversal Signals: Highlights specific bars with unique colors at the exact moment a trend changes direction, serving as potential entry or exit points.
Trend Continuation: Uses distinct colors to indicate when a trend has been established and is currently active (holding a position).

Chronos Reversal Labs - SPChronos Reversal Labs - Shadow Portfolio
Chronos Reversal Labs - Shadow Portfolio: combines reinforcement learning optimization with adaptive confluence detection through a shadow portfolio system. Unlike traditional indicator mashups that force traders to manually interpret conflicting signals, this system deploys 4 multi-armed bandit algorithms to automatically discover which of 5 specialized confluence strategies performs best in current market conditions, then validates those discoveries through parallel shadow portfolios that track virtual P&L for each strategy independently.
Core Innovation: Rather than relying on static indicator combinations, this system implements Thompson Sampling (Bayesian multi-armed bandits), contextual bandits (regime-specific learning), advanced chop zone detection (geometric pattern analysis), and historical pre-training to build a self-improving confluence detection engine. The shadow portfolio system runs 5 parallel virtual trading accounts—one per strategy—allowing the system to learn which confluence approach works best through actual position tracking with realistic exits.
Target Users: Intermediate to advanced traders seeking systematic reversal signals with mathematical rigor. Suitable for swing trading and day trading across stocks, forex, crypto, and futures on liquid instruments. Requires understanding of basic technical analysis and willingness to allow 50-100 bars for initial learning.
Why These Components Are Combined
The Fundamental Problem
No single confluence method works consistently across all market regimes. Kernel-based methods (entropy, DFA) excel during predictable phases but fail in chaos. Structure-based methods (harmonics, BOS) work during clear swings but fail in ranging conditions. Technical methods (RSI, MACD, divergence) provide reliable signals in trends but generate false signals during consolidation.
Traditional solutions force traders to either manually switch between methods (slow, error-prone) or interpret all signals simultaneously (cognitive overload). Both fail because they assume the trader knows which regime the market is in and which method works best.
The Solution: Meta-Learning Through Reinforcement Learning
This system solves the problem through automated strategy selection : Deploy 5 specialized confluence strategies designed for different market conditions, track their real-world performance through shadow portfolios, then use multi-armed bandit algorithms to automatically select the optimal strategy for the next trade.
Why Shadow Portfolios? Traditional bandit implementations use abstract "rewards." Shadow portfolios provide realistic performance measurement : Each strategy gets a virtual trading account with actual position tracking, stop-loss management, take-profit targets, and maximum holding periods. This creates risk-adjusted learning where strategies are evaluated on P&L, win rate, and drawdown—not arbitrary scores.
The Five Confluence Strategies
The system deploys 5 orthogonal strategies with different weighting schemes optimized for specific market conditions:
Strategy 1: Kernel-Dominant (Entropy/DFA focused, optimal in predictable markets)
Shannon Entropy weight × 2.5, DFA weight × 2.5
Detects low-entropy predictable patterns and DFA persistence/mean-reversion signals
Failure mode: High-entropy chaos (hedged by Technical-Dominant)
Strategy 2: Structure-Dominant (Harmonic/BOS focused, optimal in clear swing structures)
Harmonics weight × 2.5, Liquidity (S/R) weight × 2.0
Uses swing detection, break-of-structure, and support/resistance clustering
Failure mode: Range-bound markets (hedged by Balanced)
Strategy 3: Technical-Dominant (RSI/MACD/Divergence focused, optimal in established trends)
RSI weight × 2.0, MACD weight × 2.0, Trend weight × 2.0
Zero-lag RSI suite with 4 calculation methods, MACD analysis, divergence detection
Failure mode: Choppy/ranging markets (hedged by chop filter)
Strategy 4: Balanced (Equal weighting, optimal in unknown/transitional regimes)
All components weighted 1.2×
Baseline performance during regime uncertainty
Strategy 5: Regime-Adaptive (Dynamic weighting by detected market state)
Chop zones: Kernel × 2.0, Technical × 0.3
Bull/Bear trends: Trend × 1.5, DFA × 2.0
Ranging: Mean reversion × 1.5
Adapts explicitly to detected regime
Multi-Armed Bandit System: 4 Core Algorithms
What Is a Multi-Armed Bandit Problem?
Formal Definition: K arms (strategies), each with unknown reward distribution. Goal: Maximize cumulative reward while learning which arms are best. Challenge: Balance exploration (trying uncertain strategies) vs. exploitation (using known-best strategy).
Trading Application: Each confluence strategy is an "arm." After each trade, receive reward (P&L percentage). Bandits decide which strategy to trust for next signal.
The 4 Implemented Algorithms
1. Thompson Sampling (DEFAULT)
Category: Bayesian approach with probability distributions
How It Works: Model each strategy as Beta(α, β) where α = wins, β = losses. Sample from distributions, select highest sample.
Properties: Optimal regret O(K log T), automatic exploration-exploitation balance
When To Use: Best all-around choice, adaptive markets, long-term optimization
2. UCB1 (Upper Confidence Bound)
Category: Frequentist approach with confidence intervals
Formula: UCB_i = reward_mean_i + sqrt(2 × ln(total_pulls) / pulls_i)
Properties: Deterministic, interpretable, same optimal regret as Thompson
When To Use: Prefer deterministic behavior, stable markets
3. Epsilon-Greedy
Category: Simple baseline with random exploration
How It Works: With probability ε (0.15): random strategy. Else: best average reward.
Properties: Simple, fast initial learning
When To Use: Baseline comparison, short-term testing
4. Contextual Bandit
Category: Context-aware Thompson Sampling
Enhancement: Maintains separate alpha/beta for Bull/Bear/Ranging regimes
Learning: "Strategy 2: 60% win rate in Bull, 40% in Bear"
When To Use: After 100+ bars, clear regime shifts
Shadow Portfolio System
Why Shadow Portfolios?
Traditional bandits use abstract scores. Shadow portfolios provide realistic performance measurement through actual position simulation.
How It Works
Position Opening:
When strategy generates validated signal:
Opens virtual position for selected strategy
Records: entry price, direction, entry bar, RSI method
Optional: Open positions for ALL strategies simultaneously (faster learning)
Position Management (Every Bar):
Current P&L: pnl_pct = (close - entry) / entry × direction × 100
Exit if: pnl_pct <= -2.0% (stop-loss) OR pnl_pct >= +4.0% (take-profit) OR held ≥ 100 bars (time)
Position Closing:
Calculate final P&L percentage
Update strategy equity, track win rate, gross profit/loss, max drawdown
Calculate risk-adjusted reward:
text
base_reward = pnl_pct / 10.0
win_rate_bonus = (win_rate - 0.5) × 0.3
drawdown_penalty = -max_drawdown × 0.05
total_reward = sigmoid(base + bonus + penalty)
Update bandit algorithms with reward
Update RSI method bandit
Statistics Tracked Per Strategy:
Equity curve (starts at $10,000)
Win rate percentage
Max drawdown
Gross profit/loss
Current open position
This creates closed-loop learning : Strategies compete → Best performers selected → Bandits learn quality → System adapts automatically.
Historical Pre-Training System
The Problem with Live-Only Learning
Standard bandits start with zero knowledge and need 50-100 signals to stabilize. For weekly timeframe traders, this could take years.
The Solution: Historical Training
During Chart Load: System processes last 300-1000 bars (configurable) in "training mode":
Detect signals using Balanced strategy (consistent baseline)
For each signal, open virtual training positions for all 5 strategies
Track positions through historical bars using same exit logic (SL/TP/time)
Update bandit algorithms with historical outcomes
CRITICAL TRANSPARENCY: Signal detection does NOT look ahead—signals use only data available at entry bar. Exit tracking DOES look ahead (uses future bars for SL/TP), which is acceptable because:
✅ Entry decisions remain valid (no forward bias)
✅ Learning phase only (not affecting shown signals)
✅ Real-time mirrors training (identical exit logic)
Training Completion: Once chart reaches current bar, system transitions to live mode. Dashboard displays training vs. live statistics for comparison.
Benefit: System begins live trading with 100-500 historical trades worth of learning, enabling immediate intelligent strategy selection.
Advanced Chop Zone Detection Engine
The Innovation: Multi-Layer Geometric Chop Analysis
Traditional chop filters use simple volatility metrics (ATR thresholds) that can't distinguish between trending volatility (good for signals) and choppy volatility (bad for signals). This system implements three-layer geometric pattern analysis to precisely identify consolidation zones where reversal signals fail.
Layer 1: Micro-Structure Chop Detection
Method: Analyzes micro pivot points (5-bar left, 2-bar right) to detect geometric compression patterns.
Slope Analysis:
Calculates slope of pivot high trendline and pivot low trendline
Compression ratio: compression = slope_high - slope_low
Pattern Classification:
Converging slopes (compression < -0.05) → "Rising Wedge" or "Falling Wedge"
Flat slopes (|slope| < 0.05) → "Rectangle"
Parallel slopes (|compression| < 0.1) → "Channel"
Expanding slopes → "Expanding Range"
Chop Scoring:
Rectangle pattern: +15 points (highest chop)
Low average slope (<0.05): +15 points
Wedge patterns: +12 points
Flat structures: +10 points
Why This Works: Geometric patterns reveal market indecision. Rectangles and wedges create false breakouts that trap technical traders. By quantifying geometric compression, system detects these zones before signals fire.
Layer 2: Macro-Structure Chop Detection
Method: Tracks major swing highs/lows using ATR-based deviation threshold (default 2.0× ATR), projects channel boundaries forward.
Channel Position Calculation:
proj_high = last_swing_high + (swing_high_slope × bars_since)
proj_low = last_swing_low + (swing_low_slope × bars_since)
channel_width = proj_high - proj_low
position = (close - proj_low) / channel_width
Dead Zone Detection:
Middle 50% of channel (position 0.25-0.75) = low-conviction zone
Score increases as price approaches center (0.5)
Chop Scoring:
Price in dead zone: +15 points (scaled by centrality)
Narrow channel width (<3× ATR): +15 points
Channel width 3-5× ATR: +10 points
Why This Works: Price in middle of range has equal probability of moving either direction. Institutional traders avoid mid-range entries. By detecting "dead zones," system avoids low-probability setups.
Layer 3: Volume Chop Scoring
Method: Low volume indicates weak conviction—precursor to ranging behavior.
Scoring:
Volume < 0.5× average: +20 points
Volume 0.5-0.8× average: +15 points
Volume 0.8-1.0× average: +10 points
Overall Chop Intensity & Signal Filtering
Total Chop Calculation:
chop_intensity = micro_score + macro_score + (volume_score × volume_weight)
is_chop = chop_intensity >= 40
Signal Filtering (Three-Tier Approach):
1. Signal Blocking (Intensity > 70):
Extreme chop detected (e.g., tight rectangle + dead zone + low volume)
ALL signals blocked regardless of confluence
Chart displays red/orange background shading
2. Threshold Adjustment (Intensity 40-70):
Moderate chop detected
Confluence threshold increased: threshold += (chop_intensity / 50)
Only highest-quality signals pass
3. Strategy Weight Adjustment:
During Chop: Kernel-Dominant weight × 2.0 (entropy detects breakout precursors), Technical-Dominant weight × 0.3 (reduces false signals)
After Chop Exit: Weights revert to normal
Why This Three-Tier Approach Is Original: Most chop filters simply block all signals (loses breakout entries). This system adapts strategy selection during chop—allowing Kernel-Dominant (which excels at detecting low-entropy breakout precursors) to operate while suppressing Technical-Dominant (which generates false signals in consolidation). Result: System remains functional across full market regime spectrum.
Zero-Lag Filter Suite with Dynamic Volatility Scaling
Zero-Lag ADX (Trend Regime Detection)
Implementation: Applies ZLEMA to ADX components:
lag = (length - 1) / 2
zl_source = source + (source - source ) × strength
Dynamic Volatility Scaling (DVS):
Calculates volatility ratio: current_ATR / ATR_100period_avg
Adjusts ADX length dynamically: High vol → shorter length (faster), Low vol → longer length (smoother)
Regime Classification:
ADX > 25 with +DI > -DI = Bull Trend
ADX > 25 with -DI > +DI = Bear Trend
ADX < 25 = Ranging
Zero-Lag RSI Suite (4 Methods with Bandit Selection)
Method 1: Standard RSI - Traditional Wilder's RSI
Method 2: Ehlers Zero-Lag RSI
ema1 = ema(close, length)
ema2 = ema(ema1, length)
zl_close = close + (ema1 - ema2)
Method 3: ZLEMA RSI
lag = (length - 1) / 2
zl_close = close + (close - close )
Method 4: Kalman-Filtered RSI - Adaptive smoothing with process/measurement noise
RSI Method Bandit: Separate 4-arm bandit learns which calculation method produces best results. Updates independently after each trade.
Kalman Adaptive Filters
Fast Kalman: Low process noise → Responsive to genuine moves
Slow Kalman: Higher measurement noise → Filters noise
Application: Crossover logic for trend detection, acceleration analysis for momentum inflection
What Makes This Original
Innovation 1: Shadow Portfolio Validation
First TradingView script to implement parallel virtual portfolios for multi-armed bandit reward calculation. Instead of abstract scoring metrics, each strategy's performance is measured through realistic position tracking with stop-loss, take-profit, time-based exits, and risk-adjusted reward functions (P&L + win rate + drawdown). This provides orders-of-magnitude better reward signal quality for bandit learning than traditional score-based approaches.
Innovation 2: Three-Layer Geometric Chop Detection
Novel multi-scale geometric pattern analysis combining: (1) Micro-structure slope analysis with pattern classification (wedges, rectangles, channels), (2) Macro-structure channel projection with dead zone detection, (3) Volume confirmation. Unlike simple volatility filters, this system adapts strategy weights during chop —boosting Kernel-Dominant (breakout detection) while suppressing Technical-Dominant (false signal reduction)—allowing operation across full market regime spectrum without blind signal blocking.
Innovation 3: Historical Pre-Training System
Implements two-phase learning : Training phase (processes 300-1000 historical bars on chart load with proper state isolation) followed by live phase (real-time learning). Training positions tracked separately from live positions. System begins live trading with 100-500 trades worth of learned experience. Dashboard displays training vs. live performance for transparency.
Innovation 4: Contextual Multi-Armed Bandits with Regime-Specific Learning
Beyond standard bandits (global strategy quality), implements regime-specific alpha/beta parameters for Bull/Bear/Ranging contexts. System learns: "Strategy 2: 60% win rate in ranging markets, 45% in bull trends." Uses current regime's learned parameters for strategy selection, enabling regime-aware optimization.
Innovation 5: RSI Method Meta-Learning
Deploys 4 different RSI calculation methods (Standard, Ehlers ZL, ZLEMA, Kalman) with separate 4-arm bandit that learns which calculation works best. Updates RSI method bandit independently based on trade outcomes, allowing automatic adaptation to instrument characteristics.
Innovation 6: Dynamic Volatility Scaling (DVS)
Adjusts ALL lookback periods based on current ATR ratio vs. 100-period average. High volatility → shorter lengths (faster response). Low volatility → longer lengths (smoother signals). Applied system-wide to entropy, DFA, RSI, ADX, and Kalman filters for adaptive responsiveness.
How to Use: Practical Guide
Initial Setup (5 Minutes)
Theory Mode: Start with "BALANCED" (APEX for aggressive, CONSERVATIVE for defensive)
Enable RL: Toggle "Enable RL Auto-Optimization" to TRUE, select "Thompson Sampling"
Enable Confluence Modules: Divergence, Volume Analysis, Liquidity Mapping, RSI OB/OS, Trend Analysis, MACD (all recommended)
Enable Chop Filter: Toggle "Enable Chop Filter" to TRUE, sensitivity 1.0 (default)
Historical Training: Enable "Enable Historical Pre-Training", set 300-500 bars
Dashboard: Enable "Show Dashboard", position Top Right, size Large
Learning Phase (First 50-100 Bars)
Monitor Thompson Sampling Section:
Alpha/beta values should diverge from initial 1.0 after 20-30 trades
Expected win% should stabilize around 55-60% (excellent), >50% (acceptable)
"Pulls" column should show balanced exploration (not 100% one strategy)
Monitor Shadow Portfolios:
Equity curves should diverge (different strategies performing differently)
Win rate > 55% is strong
Max drawdown < 15% is healthy
Monitor Training vs Live (if enabled):
Delta difference < 10% indicates good generalization
Large negative delta suggests overfitting
Large positive delta suggests system adapting well
Optimization:
Too few signals: Lower "Base Confluence Threshold" to 2.5-3.0
Too many signals: Raise threshold to 4.0-4.5
One strategy dominates (>80%): Increase "Exploration Rate" to 0.20-0.25
Excessive chop blocking: Lower "Chop Sensitivity" to 0.7-0.8
Signal Interpretation
Dashboard Indicators:
"WAITING FOR SIGNAL": No confluence
"LONG ACTIVE ": Validated long entry
"SHORT ACTIVE ": Validated short entry
Chart Visuals:
Triangle markers: Entry signal (green = long, red = short)
Orange/red background: Chop zone
Lines: Support/resistance if enabled
Position Management
Entry: Enter on triangle marker, confirm direction matches dashboard, check confidence >60%
Stop-Loss: Entry ± 1.5× ATR or at structural swing point
Take-Profit:
TP1: Entry + 1.5R (take 50%, move SL to breakeven)
TP2: Entry + 3.0R (runner) or trail
Position Sizing:
Risk per trade = 1-2% of capital
Position size = (Account × Risk%) / (Entry - SL)
Recommended Settings by Instrument
Stocks (Large Cap): Balanced mode, Threshold 3.5, Thompson Sampling, Chop 1.0, 15min-1H, Training 300-500 bars
Forex Majors: Conservative-Balanced mode, Threshold 3.5-4.0, Thompson Sampling, Chop 0.8-1.0, 5min-30min, Training 400-600 bars
Cryptocurrency: Balanced-APEX mode, Threshold 3.0-3.5, Thompson Sampling, Chop 1.2-1.5, 15min-4H, Training 300-500 bars
Futures: Balanced mode, Threshold 3.5, UCB1 or Thompson, Chop 1.0, 5min-30min, Training 400-600 bars
Technical Approximations & Limitations
1. Thompson Sampling: Pseudo-Random Beta Distribution
Standard: Cryptographic RNG with true beta sampling
This Implementation: Box-Muller transform using market data as entropy source
Impact: Not cryptographically random but maintains exploration-exploitation balance. Sufficient for strategy selection.
2. Shadow Portfolio: Simplified Execution Model
Standard: Order book simulation with slippage, partial fills
This Implementation: Perfect fills at close price, no fees modeled
Impact: Real-world performance ~0.1-0.3% worse per trade due to execution costs.
3. Historical Training: Forward-Looking for Exits Only
Entry signals: Use only past data (causal, no bias)
Exit tracking: Uses future bars to determine SL/TP (forward-looking)
Impact: Acceptable because: (1) Entry logic remains valid, (2) Live trading mirrors training, (3) Improves learning quality. Training win rates reflect 8-bar evaluation window—live performance may differ if positions held longer.
4. Shannon Entropy & DFA: Simplified Calculations
Impact: 10-15% precision loss vs. academic implementations. Still captures predictability and persistence signals effectively.
General Limitations
No Predictive Guarantee: Past performance ≠ future results
Learning Period Required: Minimum 50-100 bars for stable statistics
Overfitting Risk: May not generalize to unprecedented conditions
Single-Instrument: No multi-asset correlation or sector context
Execution Assumptions: Degrades in illiquid markets (<100k volume), major news events, flash crashes
Risk Warnings & Disclaimers
No Guarantee of Profit: All trading involves substantial risk of loss. This indicator is a tool, not a guaranteed profit system.
System Failures: Software bugs possible despite testing. Use appropriate position sizing.
Market Regime Changes: Performance may degrade during extreme volatility (VIX >40), low liquidity periods, or fundamental regime shifts.
Broker-Specific Issues: Real-world execution includes slippage (0.1-0.5%), commissions, overnight financing costs, partial fills.
Forward-Looking Bias in Training: Historical training uses 8-bar forward window for exit evaluation. Dashboard "Training Win%" reflects this method. Real-time performance may differ.
Appropriate Use
This Indicator IS:
✅ Entry trigger system with confluence validation
✅ Risk management framework (automated SL/TP)
✅ Adaptive strategy selection engine
✅ Learning system that improves over time
This Indicator IS NOT:
❌ Complete trading strategy (requires position sizing, portfolio management)
❌ Replacement for due diligence
❌ Guaranteed profit generator
❌ Suitable for complete beginners
Recommended Complementary Analysis: Market context, volume profile, fundamental catalysts, higher timeframe alignment, support/resistance from other sources.
Conclusion
Chronos Reversal Labs V2.0 - Elite Edition synthesizes research from multi-armed bandit theory (Thompson Sampling, UCB, contextual bandits), market microstructure (geometric chop detection, zero-lag filters), and machine learning (shadow portfolio validation, historical pre-training, RSI method meta-learning).
Unlike typical indicator mashups, this system implements mathematically rigorous bandit algorithms with realistic performance validation, three-layer chop detection with adaptive strategy weighting, regime-specific learning, and full transparency on approximations and limitations.
The system is designed for intermediate to advanced traders who understand that no indicator is perfect, but through proper machine learning and realistic validation, we can build systems that improve over time and adapt to changing markets without manual intervention.
Use responsibly. Understand the limitations. Risk disclosure applies. Past performance does not guarantee future results.
Taking you to school. — Dskyz, Trade with insight. Trade with anticipation.

Custom Reversal Scalper – Adib NooraniCustom Reversal Scalper – Adib Noorani (Modified Edition)
An improved, non-repainting visual reversal indicator inspired by Adib Noorani's "Reversal Scalper" and updated to address key shortcomings with compliance to Adib's rules and recommendations.
Reversal Logic & Entry Filtering: Combines Adib's reversal oscillator and trend ribbon logic with added 30-minute exclusion, optimizing signals for volatile Indian indices like $NSE:NIFTY.
Shortcomings Addressed:
Eliminates repainting—entries and exits only display after the required market action.
Implements strict intraday time filtering per Adib's guidance.
Uses automatic, dynamic trailing stop (red line) post-take-profit for advanced risk management.
Maintains risk:reward visualization and minimizes chart clutter.
Directly Based on: Adib Noorani's YouTube training: www.youtube.com
How to Use:
Trade only outside first 30 minutes, per Adib's rules.
Go Long on black candle after confirmation and price crosses blue line.
Go Short on white candle after confirmation and price crosses blue line.
Stop into trailing is handled automatically after take profit.
Follow all further execution and visual risk management recommendations as per Adib's video.
This script incorporates the key corrections and execution principles demonstrated by Adib Noorani for safe scalping on Indian indices and F&O instruments.
Credits: Original logic and teaching by Adib Noorani . Modifications, anti-repainting logic, and full RR/visual improvements by script author.
For educational purposes. Please backtest and follow personal risk management.

RSI Regime: Continuation vs Reversal Indicator Description: RSI Regime (Continuation vs. Reversal)
This indicator uses the standard Relative Strength Index (RSI) to analyze market momentum and categorize it into three "regimes." Its primary goal is to help you determine if an overbought (OB) or oversold (OS) signal is likely to be a continuation of the current trend or a reversal point.
It also identifies "Fast Trend Starts," which are exceptionally fast and powerful moves from one extreme to the other.
Core Features & How to Read It
1. The Three RSI Regimes (Background Color) The script calculates a moving average (SMA) of the RSI to determine the dominant medium-term momentum. This is shown as the background color:
Bull Regime (Green Background): The RSI's average is high (e.g., above 55). The market is in a clear uptrend.
Bear Regime (Red Background): The RSI's average is low (e.g., below 45). The market is in a clear downtrend.
Range Regime (Orange Background): The RSI's average is in the middle. The market is consolidating or undecided.
2. Overbought (OB) & Oversold (OS) Signals
When the RSI line crosses into the overbought (e.g., >70) or oversold (e.g., <30) zones, the indicator generates one of two types of signals:
A) Continuation Signals (Small Triangles: ►)
These signals suggest an OB/OS reading is just a "pause" and the main trend will likely continue.
Orange ► (at the top): Appears when RSI becomes overbought while the market is already in a Bull Regime. This suggests the uptrend is strong, and this OB signal may not lead to a big drop.
Teal ► (at the bottom): Appears when RSI becomes oversold while the market is already in a Bear Regime. This suggests the downtrend is strong, and this OS signal may not lead to a big bounce.
(Note: An optional Price EMA filter can be enabled to make these signals more strict.)
B) Reversal Signals (Small Labels: "OS→>50" / "OB→<50")
These labels appear after an OB/OS signal to confirm that a reversal has actually occurred.
"OS→>50 Reversal" (Aqua Label): Appears if the RSI becomes oversold and then recovers back above the 50 midline within a set number of bars. This confirms the oversold dip was a reversal point.
"OB→<50 Reversal" (Orange Label): Appears if the RSI becomes overbought and then falls back below the 50 midline within a set number of bars. This confirms the overbought peak was a reversal point.
3. "Fast Trend Starts" (Large Labels)
This is a unique feature that identifies the fastest percentile of market moves. It measures how many bars it takes for the RSI to go from one extreme to the other and flags when a move is in the top 5% (default) of all historical moves.
"Long Pullbacks (Fast OS→BullRange)" (Large Green Label): This powerful signal appears when the RSI moves from oversold (<30) all the way up to the bull range (>60) exceptionally fast. It identifies a very strong, fast, and decisive bounce that could signal the start of a new uptrend.
"Short Pumps (Fast OB→BearRange)" (Large Red Label): This appears when the RSI moves from overbought (>70) all the way down to the bear range (<40) exceptionally fast. It identifies a very sharp, fast rejection or "pump-and-dump" that could signal the start of a new downtrend.
Key User Inputs
RSI Length (14): The lookback period for the main RSI calculation.
OB (70) / OS (30): The standard overbought and oversold levels.
Bull/Bear Range Threshold (60/40): These are the levels used to confirm the "Fast Trend Starts." They are separate from the OB/OS levels.
RSI Regime SMA Length (21): The lookback period for the moving average that determines the background regime.
Use Price EMA filter (true): If checked, the small "Continuation" triangles will only appear if the price is also above (for bulls) or below (for bears) its own 50-period EMA.
Fastest X% duration (5.0): This sets the percentile for the "Fast Trend Start" labels. 5.0 means it only flags moves that are in the fastest 5% of all recorded moves.

Scalp BTC/ETH — Reversal & Continuation (v1, Pine v6)Scalp BTC/ETH — Reversal & Continuation (1m à 10m)
Cet indicateur détecte des opportunités de micro-scalping sur futures (BTC/ETH) basées sur deux mécaniques courtes validées par structure de prix :
A) Reversal de pression (contre-mouvement contrôlé)
Détection d’une sur-extension brutale suivie d’une absorption sur la bougie suivante.
Objectif : capturer la première respiration après un excès de prix (rejet court).
B) Continuation courte (momentum + reprise)
Détection de 3 bougies directionnelles consécutives suivies d’un pullback léger, puis signal sur la reprise du mouvement initial.
Gestion intégrée (scénario standard TP dynamique)
TP1 → 50% de la position à un gain fixe (% adaptable au timeframe)
Stop déplacé au Break-Even sur le restant
Sortie finale sur bougie inverse significative
(correction ≥ X% du corps précédent) ou timeout (max bars en trade)
Scalp BTC/ETH — Reversal & Continuation (1m to 10m)
This indicator detects short-term futures scalping setups on BTC & ETH using two mechanical price-action models designed for fast execution:
A) Reversal Compression (counter-move entry)
Identifies a sharp impulse (overextension) followed by absorption / failure to extend on the next candle.
Objective: capture the first corrective pullback after exhaustion.
B) Controlled Continuation (momentum follow-through)
Identifies 3 consecutive trend candles, then a shallow pullback, and triggers an entry on the resumption of the main leg.
Built-in trade logic (dynamic TP structure)
TP1 → scale out 50% of the position at a fixed percentage (auto-scaled per timeframe)
Stop moved to Break-Even after TP1
Final exit on either:
• a meaningful opposite candle (≥ X% correction of prior body), or
• a timeout (max bars in trade)
Technical characteristics
Designed for 1m / 3m / 5m / 7m / 10m
No repainting (bar-close confirmed logic)
Works for both LONG & SHORT
Built-in alert events:
ENTRY_LONG / ENTRY_SHORT / TP1 / EXIT_STOP / EXIT_INVERSE / EXIT_TIMEOUT
Suitable for manual execution, semi-automation (alerts) or full bot integration (webhook JSON)
Purpose
Provide a repeatable, rule-based, non-subjective framework to harvest micro-moves with controlled risk, without relying on lagging indicators or long-term prediction.
(A Strategy / backtesting version is planned as a next iteration.)

Chronos Reversal Labs🧬 Chronos Reversal Lab - Machine Learning Market Structure Analysis
OVERVIEW
Chronos Reversal Lab (CRL) is an advanced market structure analyzer that combines computational intelligence kernels with classical technical analysis to identify high-probability reversal opportunities. The system integrates Shannon Entropy analysis, Detrended Fluctuation Analysis (DFA), Kalman adaptive filtering, and harmonic pattern recognition into a unified confluence-based signal engine.
WHAT MAKES IT ORIGINAL
Unlike traditional reversal indicators that rely solely on oscillators or pattern recognition, CRL employs a multi-kernel machine learning approach that analyzes market behavior through information theory, statistical physics, and adaptive state-space estimation. The system combines these computational methods with geometric pattern analysis and market microstructure to create a comprehensive reversal detection framework.
HOW IT WORKS (Technical Methodology)
1. COMPUTATIONAL KERNELS
Shannon Entropy Analysis
Measures market uncertainty using information theory:
• Discretizes price returns into bins (user-configurable 5-20 bins)
• Calculates probability distribution entropy over lookback window
• Normalizes entropy to 0-1 scale (0 = perfectly predictable, 1 = random)
• Low entropy states (< 0.3 default) indicate algorithmic clarity phases
• When entropy drops, directional moves become statistically more probable
Detrended Fluctuation Analysis (DFA)
Statistical technique measuring long-range correlations:
• Analyzes price series across multiple box sizes (4 to user-set maximum)
• Calculates fluctuation scaling exponent (Alpha)
• Alpha > 0.5: Trend persistence (momentum regime)
• Alpha < 0.5: Mean reversion tendency (reversal regime)
• Alpha range 0.3-1.5 mapped to trading strategies
Kalman Adaptive Filter
State-space estimation for lag-free trend tracking:
• Maintains separate fast and slow Kalman filters
• Process noise and measurement noise are user-configurable
• Tracks price state with adaptive gain adjustments
• Calculates acceleration (second derivative) for momentum detection
• Provides cleaner trend signals than traditional moving averages
2. HARMONIC PATTERN DETECTION
Identifies geometric reversal patterns:
• Gartley: 0.618 AB/XA, 0.786 AD/XA retracement
• Bat: 0.382-0.5 AB/XA, 0.886 AD/XA retracement
• Butterfly: 0.786 AB/XA, 1.272-1.618 AD/XA extension
• Cypher: 0.382-0.618 AB/XA, 0.786 AD/XA retracement
Pattern Validation Process:
• Requires alternating swing structure (XABCD points)
• Fibonacci ratio tolerance: 0.02-0.20 (user-adjustable precision)
• Minimum 50% ratio accuracy score required
• PRZ (Potential Reversal Zone) calculated around D point
• Zone size: ATR-based with pattern-specific multipliers
• Active pattern tracking with 100-bar invalidation window
3. MARKET STRUCTURE ANALYSIS
Swing Point Detection:
• Pivot-based swing identification (3-21 bars configurable)
• Minimum swing size: ATR multiples (0.5-5.0x)
• Adaptive filtering: volatility regime adjustment (0.7-1.3x)
• Swing confirmation tracking with RSI and volume context
• Maintains structural history (up to 500 swings)
Break of Structure (BOS):
• Detects price crossing previous swing highs/lows
• Used for trend continuation vs reversal classification
• Optional requirement for signal validation
Support/Resistance Detection:
• Identifies horizontal levels from swing clusters
• Touch counting algorithm (price within ATR×0.3 tolerance)
• Weighted by recency and number of tests
• Dynamic updating as structure evolves
4. CONFLUENCE SCORING SYSTEM
Multi-factor analysis with regime-aware weighting:
Hierarchical Kernel Logic:
• Entropy gates advanced kernel activation
• Only when entropy < threshold do DFA and Kalman accelerate scoring
• Prevents false signals during chaotic (high entropy) conditions
Scoring Components:
ML Kernels (when entropy low):
• Low entropy + trend alignment: +3.0 points × trend weight
• DFA super-trend (α>1.5): +4.0 points × trend weight
• DFA persistence (α>0.65): +2.5 points × trend weight
• DFA mean-reversion (α<0.35): +2.0 points × mean-reversion weight
• Kalman acceleration: up to +3.0 points (scaled by magnitude)
Classical Technical Analysis:
• RSI oversold (<30) / overbought (>70): +1.5 points
• RSI divergence (bullish/bearish): +2.5 points
• High relative volume (>1.5x): +0-2.0 points (scaled)
• Volume impulse (>2.0x): +1.5 points
• VWAP extremes: +1.0 point
• Trend alignment (Kalman fast vs slow): +1.5 points
• MACD crossover/momentum: +1.0 point
Structural Factors:
• Near support (within 0.5 ATR): +0-2.0 points (inverse distance)
• Near resistance (within 0.5 ATR): +0-2.0 points (inverse distance)
• Harmonic PRZ zone: +3.0 to +6.0 points (pattern score dependent)
• Break of structure: +1.5 points
Regime Adjustments:
• Trend weight: 1.5× in trend regime, 0.5× in mean-reversion
• Mean-reversion weight: 1.5× in MR regime, 0.5× in trend
• Volatility multiplier: 0.7-1.3× based on ATR regime
• Theory mode multiplier: 0.8× (Conservative) to 1.2× (APEX)
Final Threshold:
Base threshold (default 3.5) adjusted by:
• Theory mode: -0.3 (APEX) to +0.8 (Conservative)
• Regime: +0.5 (high vol) to -0.3 (low vol or strong trend)
• Filter: +0.2 if regime filter enabled
5. SIGNAL GENERATION ARCHITECTURE
Five-stage validation process:
Stage 1 - ML Kernel Analysis:
• Entropy threshold check
• DFA regime classification
• Kalman acceleration confirmation
Stage 2 - Structural Confirmation:
• Market structure supports directional bias
• BOS alignment (if required)
• Swing point validation
Stage 3 - Trigger Validation:
• Engulfing candle (if required)
• HTF bias confirmation (if strict HTF enabled)
• Harmonic PRZ alignment (if confirmation enabled)
Stage 4 - Consistency Check:
• Anticipation depth: checks N bars back (1-13 configurable)
• Ensures Kalman acceleration direction persists
• Filters whipsaw conditions
Stage 5 - Structural Soundness (Critical Filter):
• Verifies adequate room before next major swing level
• Long signals: must have >0.25 ATR clearance to last swing high
• Short signals: must have >0.25 ATR clearance to last swing low
• Prevents trades directly into obvious structural barriers
Dynamic Risk Management:
• Stop-loss: Placed beyond last structural swing ± 2 ticks
• Take-profit 1: Risk × configurable R1 multiplier (default 1.5R)
• Take-profit 2: Risk × configurable R2 multiplier (default 3.0R)
• Confidence score: Calibrated 0-99% based on confluence + kernel boost
6. ADAPTIVE REGIME SYSTEM
Continuous market state monitoring:
Trend Regime:
• Kalman fast vs slow positioning
• Multi-timeframe alignment (optional HTF)
• Strength: ATR-normalized fast/slow spread
Volatility Regime:
• Current ATR vs 100-bar average
• Regime ratio: 0.7-1.3 typical range
• Affects swing size filtering and cooldown periods
Signal Cooldown:
• Base: User-set bars (1-300)
• High volatility (>1.5): cooldown × 1.5
• Low volatility (<0.5): cooldown × 0.7
• Post-BOS: minimum 20-bar cooldown enforced
FOUR OPERATIONAL MODES
CONSERVATIVE MODE:
• Threshold adjustment: +0.8
• Mode multiplier: 0.8×
• Strictest filtering for highest quality
• Recommended for: Beginners, large accounts, swing trading
• Expected signals: 3-5 per week (typical volatile instrument)
BALANCED MODE:
• Threshold adjustment: +0.3
• Mode multiplier: 1.0×
• Standard operational parameters
• Recommended for: General trading, learning phase
• Expected signals: 5-10 per week
APEX MODE:
• Threshold adjustment: -0.3
• Mode multiplier: 1.2×
• Maximum sensitivity, reduced cooldowns
• Recommended for: Scalping, high volatility, experienced traders
• Expected signals: 10-20 per week
INSTITUTIONAL MODE:
• Threshold adjustment: +0.5
• Mode multiplier: 1.1×
• Enhanced structural weighting, HTF emphasis
• Recommended for: Professional traders, swing positions
• Expected signals: 4-8 per week
VISUAL COMPONENTS
1. Fibonacci Retracement Levels
• Auto-calculated from most recent swing structure
• Standard levels: 0%, 23.6%, 38.2%, 50%, 61.8%, 78.6%, 100%, 127.2%, 161.8%, 200%, 261.8%
• Key levels emphasized (50%, 61.8%, 100%, 161.8%)
• Color gradient from bullish to bearish based on level
• Automatic cleanup when levels are crossed
• Label intensity control (None/Fib only/All)
2. Support and Resistance Lines
• Dynamic horizontal levels from swing clusters
• Width: 2px solid lines
• Colors: Green (support), Red (resistance)
• Labels show price and level type
• Touch-based validation (minimum 2 touches)
• Real-time updates and invalidation
3. Harmonic PRZ Boxes
• Displayed around pattern completion (D point)
• Pattern-specific colors (Gartley: purple, Bat: orange, etc.)
• Box height: ATR-based zone sizing
• Score-dependent transparency
• 100-bar active window before removal
4. Confluence Boxes
• Appear when confluence ≥ threshold
• Yellow/orange gradient based on score strength
• Height: High to low of bar
• Width: 1 bar on each side
• Real-time score-based transparency
5. Kalman Filter Lines
• Fast filter: Bullish color (green default)
• Slow filter: Bearish color (red default)
• Width: 2px
• Transparency adjustable (0-90%)
• Optional display toggle
6. Signal Markers
• Long: Green triangle below bar (tiny size)
• Short: Red triangle above bar (tiny size)
• Appear only on confirmed signals
• Includes alert generation
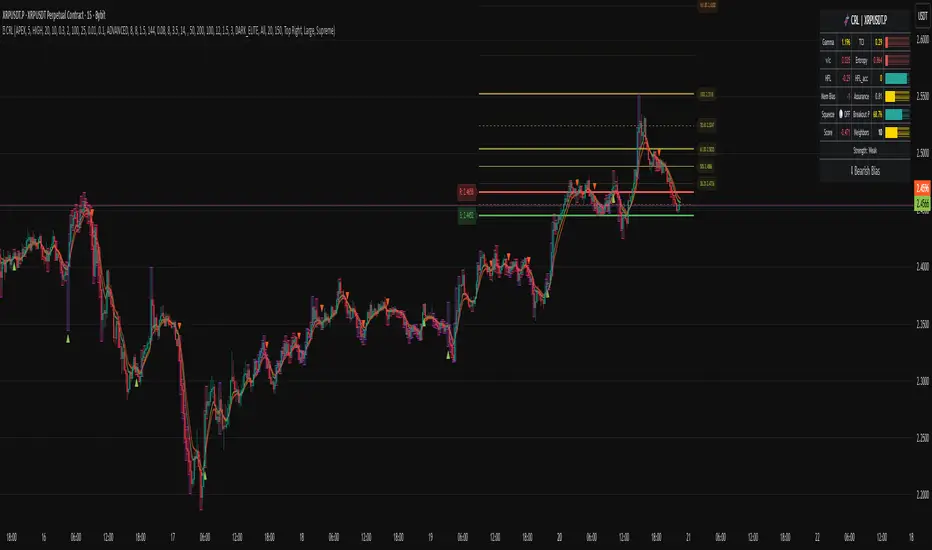
7. Premium Dashboard
Features real-time metrics with visual gauges:
Layout Options:
• Position: 4 corners selectable
• Size: Small (9 rows) / Normal (12 rows) / Large (14 rows)
• Themes: Supreme, Cosmic, Vortex, Heritage
Metrics Displayed:
• Gamma (DFA - 0.5): Shows trend persistence vs mean-reversion
• TCI (Trend Strength): ATR-normalized Kalman spread with gauge
• v/c (Relative Volume): Current vs average with color coding
• Entropy: Market predictability state with gauge
• HFL (High-Frequency Line): Kalman fast/slow difference / ATR
• HFL_acc (Acceleration): Second derivative momentum
• Mem Bias: Net bullish-bearish confluence (-1 to +1)
• Assurance: Confidence × (1-entropy) metric
• Squeeze: Bollinger Band / Keltner Channel squeeze detection
• Breakout P: Probability estimate from DFA + trend + acceleration
• Score: Final confluence vs threshold (normalized)
• Neighbors: Active harmonic patterns count
• Signal Strength: Strong/Moderate/Weak classification
• Signal Banner: Current directional bias with emoji indicators
Gauge Visualization:
• 10-bar horizontal gauges (█ filled, ░ empty)
• Color-coded: Green (strong) / Gold (moderate) / Red (weak)
• Real-time updates every bar
HOW TO USE
Step 1: Configure Mode and Resolution
• Select Theory Mode based on trading style (Conservative/Balanced/APEX/Institutional)
• Set Structural Resolution (Standard for fast markets, High for balanced, Ultra/Institutional for swing)
• Enable Adaptive Filtering (recommended for all volatile assets)
Step 2: Enable Desired Kernels
• Shannon Entropy: Essential for predictability detection (recommended ON)
• DFA Analysis: Critical for regime classification (recommended ON)
• Kalman Filter: Provides lag-free trend tracking (recommended ON)
• All three work synergistically; disabling reduces effectiveness
Step 3: Configure Confluence Factors
• Enable desired technical factors (RSI, MACD, Volume, Divergence)
• Enable Liquidity Mapping for support/resistance proximity scoring
• Enable Harmonic Detection if trading pattern-based setups
• Adjust base confluence threshold (3.5 default; higher = fewer, cleaner signals)
Step 4: Set Trigger Requirements
• Require Engulfing: Adds precision, reduces frequency (recommended for Conservative)
• Require BOS: Ensures structural alignment (recommended for trend-following)
• Require Structural Soundness: Critical filter preventing traps (highly recommended)
• Strict HTF Bias: For multi-timeframe traders only
Step 5: Adjust Visual Preferences
• Enable/disable Fibonacci levels, S/R lines, PRZ boxes, confluence boxes
• Set label intensity (None/Fib/All)
• Adjust transparency (0-90%) for overlay clarity
• Configure dashboard position, size, and theme
Step 6: Configure Alerts
• Enable master alerts toggle
• Select alert types: Anticipation, Confirmation, High Confluence, Low Entropy
• Enable JSON details for automated trading integration
Step 7: Interpret Signals
• Wait for triangle markers (green up = long, red down = short)
• Check dashboard for confluence score, entropy, DFA regime
• Verify signal aligns with higher timeframe bias (if using HTF setting)
• Confirm adequate space to take-profit levels (no nearby structural barriers)
Step 8: Execute and Manage
• Enter at close of signal candle (or next bar open)
• Set stop-loss at calculated level (visible in alert if JSON enabled)
• Scale out at TP1 (1.5R default), trail remaining to TP2 (3.0R default)
• Exit early if entropy spikes >0.7 or DFA regime flips against position
CUSTOMIZATION GUIDE
Timeframe Optimization:
Scalping (1-5 minutes):
• Theory Mode: APEX
• Anticipation Depth: 3-5
• Structural Resolution: STANDARD
• Signal Cooldown: 8-12 bars
• Enable fast kernels, disable HTF bias
Day Trading (15m-1H):
• Theory Mode: BALANCED
• Anticipation Depth: 5-8
• Structural Resolution: HIGH
• Signal Cooldown: 12-20 bars
• Standard configuration
Swing Trading (4H-Daily):
• Theory Mode: INSTITUTIONAL
• Anticipation Depth: 8-13
• Structural Resolution: ULTRA or INSTITUTIONAL
• Signal Cooldown: 20-50 bars
• Enable HTF bias, strict confirmations
Market Type Optimization:
Forex Majors:
• All kernels enabled
• Harmonic patterns effective
• Balanced or Institutional mode
• Standard settings work well
Stock Indices:
• Emphasis on volume analysis
• DFA critical for regime detection
• Conservative or Balanced mode
• Enable liquidity mapping
Cryptocurrencies:
• Adaptive filtering essential
• Higher volatility regime expected
• APEX mode for active trading
• Wider ATR multiples for swing sizing
IMPORTANT DISCLAIMERS
• This indicator does not predict future price movements
• Computational kernels calculate probabilities, not certainties
• Past confluence scores do not guarantee future signal performance
• Always backtest on YOUR specific instruments and timeframes before live trading
• Machine learning kernels require calibration period (minimum 100 bars of data)
• Performance varies significantly across market conditions and regimes
• Signals are suggestions for analysis, not automated trading instructions
• Proper risk management (stops, position sizing) is mandatory
• Complex calculations may impact performance on lower-end devices
• Designed for liquid markets; avoid illiquid or gap-prone instruments
PERFORMANCE CONSIDERATIONS
Computational Intensity:
• DFA analysis: Moderate (scales with length and box size parameters)
• Entropy calculation: Moderate (scales with lookback and bins)
• Kalman filtering: Low (efficient state-space updates)
• Harmonic detection: Moderate to High (pattern matching across swing history)
• Overall: Medium computational load
Optimization Tips:
• Reduce Structural Analysis Depth (144 default → 50-100 for faster performance)
• Increase Calc Step (2 default → 3-4 for lighter load)
• Reduce Pattern Analysis Depth (8 default → 3-5 if harmonics not primary focus)
• Limit Draw Window (150 bars default prevents visual clutter on long charts)
• Disable unused confluence factors to reduce calculations
Best Suited For:
• Liquid instruments: Major forex, stock indices, large-cap crypto
• Active timeframes: 5-minute through daily (avoid tick/second charts)
• Trending or ranging markets: Adapts to both via regime detection
• Pattern traders: Harmonic integration adds geometric confluence
• Multi-timeframe analysts: HTF bias and regime detection support this approach
Not Recommended For:
• Illiquid penny stocks or micro-cap altcoins
• Markets with frequent gaps (stocks outside regular hours without gap adjustment)
• Extremely fast timeframes (tick, second charts) due to calculation overhead
• Pure mean-reversion systems (unless using CONSERVATIVE mode with DFA filters)
METHODOLOGY NOTE
The computational kernels (Shannon Entropy, DFA, Kalman Filter) are established statistical and signal processing techniques adapted for financial time series analysis. These are deterministic mathematical algorithms, not predictive AI models. The term "machine learning" refers to the adaptive, data-driven nature of the calculations, not neural networks or training processes.
Confluence scoring is rule-based with regime-dependent weighting. The system does not "learn" from historical trades but adapts its sensitivity to current volatility and trend conditions through mathematical regime classification.
SUPPORT & UPDATES
• Questions about configuration or usage? Send me a message on TradingView
• Feature requests are welcome for consideration in future updates
• Bug reports appreciated and addressed promptly
• I respond to messages within 24 hours
• Regular updates included (improvements, optimizations, new features)
FINAL REMINDERS
• This is an analytical tool for confluence analysis, not a standalone trading system
• Combine with your existing strategy, risk management, and market analysis
• Start with paper trading to learn the system's behavior on your markets
• Allow 50-100 signals minimum for performance evaluation
• Adjust parameters based on YOUR timeframe, instrument, and trading style
• No indicator guarantees profitable trades - proper risk management is essential
— Dskyz, Trade with insight. Trade with anticipation.
HA Reversal + Doji 🔥 Heikin Ashi Reversal + Stochastic Filter (Precision Entry System)
This indicator is designed to detect high–quality reversal entries using a Heikin Ashi candle pattern (Doji + 2 no–wick confirmation) combined with a strict Stochastic filter that uses memory of extreme touches to control trade direction.
✅ Entry Logic
🔹 Bullish BUY Signal
A BUY is triggered only when:
A valid reversal pattern is detected:
Doji candle (pivot) 3 bars back
Followed by 2 bullish candles with no lower wicks
Stochastic touched Oversold (≤ 20) at least once before the signal
Pattern + Stoch alignment = BUY
🔹 Bearish SELL Signal
A SELL is triggered only when:
Valid bearish reversal pattern:
Doji candle (pivot) 3 bars back
Followed by 2 bearish candles with no upper wicks
Stochastic touched Overbought (≥ 80) before the signal
Pattern + Stoch alignment = SELL
🧠 Stochastic “Memory” Filter
This is not a basic OB/OS filter — it uses event memory:
If Stochastic touches Oversold, the system becomes ready for BUY
If it touches Overbought, it becomes ready for SELL
Both directions can be armed at once
Once a BUY or SELL actually triggers, memory resets to neutral
Prevents “signal spam” during chop and keeps direction meaningful
🎯 Why This Works
✔ Filters out random countertrend noise
✔ Only trades after momentum exhaustion
✔ Uses strict Heikin Ashi reversal structure
✔ Works great across crypto, forex, indices, metals
✔ Designed for precision entries and swing continuation traps
⚙️ Customizable Options
Doji detection mode (body % / ticks / hybrid)
Wick tolerance
Heikin Ashi source (chart or calculated)
Stochastic source (raw or smoothed)
Option to avoid duplicate same-direction signals
Visual aids: pattern markers, blocked signals, doji debugging
📌 Best Use Cases
Reversal scalping on 5m/15m
Swing entries on 1H/4H
Trend exhaustion confirmation
Smart Money Concepts entry refinement
Entry timing after liquidity sweeps
🚨 Important
This is not a repainting system. Signals are generated at bar close only. Always combine with proper risk management and market context.
Let me know if you want:
✅ A shorter description
✅ An SEO optimized TradingView title
✅ A strategy version with backtesting
✅ Alerts version for automation

CVD Absorption + Confirmation [Orderflow & Volume]This indicator detects bullish and bearish absorption setups by combining Cumulative Volume Delta (CVD) with price action, candlestick, and volume confirmations.
🔹 What is Absorption?
Absorption happens when aggressive buyers/sellers push CVD to new highs or lows, but price fails to follow through.
Bearish absorption: CVD makes a higher high, but price does not.
Bullish absorption: CVD makes a lower low, but price does not.
This often signals that limit orders are absorbing aggressive market orders, creating potential reversal points.
🔹 Confirmation Patterns
Absorption signals are only shown if they are validated by one of the following patterns:
Engulfing candle with low volume → reversal faces little resistance.
Engulfing candle with high volume → strong aggressive participation.
Pin bar with high volume → absorption visible in the wick.
CVD flattening / slope reversal → shift in aggressive order flow.
🔹 Signals
✅ Bullish absorption confirmed → Green label below the bar.
❌ Bearish absorption confirmed → Red label above the bar.
Each label represents a potential reversal setup after orderflow absorption is validated.
🔹 Alerts
Built-in alerts are included for both bullish and bearish confirmations, so you can track setups in real-time without watching the chart 24/7.
📌 How to Use:
Best applied at key levels (supply/demand, VWAP, OR, liquidity zones).
Look for confluence with your trading strategy before taking entries.
Works on all markets and timeframes where volume is reliable.

CHoCH Reversal Hunter🔥 CHoCH Reversal Hunter — Detect Bearish CHoCH Patterns & Fibonacci Golden Zone For Precision Reversal Setups
📈 Overview
CHoCH Reversal Hunter is a Pine Script™ indicator for structured bearish market analysis.
It combines major/minor pivot detection, Change of Character (CHoCH) filtering, and logarithmic Fibonacci retracements into one framework.
The goal: identify Small LL → CHoCH → Golden Zone setups with higher precision.
🧠 Core Logic
1. 📊 Market Structure Backbone
Tracks the 4 most recent major highs (H0–H3) and 3 major lows.
These pivots form the basis for trend evaluation.
2. 🔻 Bearish Background Conditions
A bearish market context is confirmed when:
// Bearish Background Condition
isBearish = (High 3 < High 2) and (
(High 2 > High 1 and High 2 < High 0) or
(High 2 <= High 1)
)
// Reset to neutral if High 2 < High 3
This ensures that only a true lower-high structure activates the bearish framework.
3. 🎯 Hunt for Small Lower Low (LL)
Monitors minor pivot lows with a smaller lookback period.
A valid Small LL must break below the third major low (Low 2).
This Small LL becomes the 0% Fibonacci anchor.
4. 🔄 Change of Character (CHoCH) Selection
The indicator scans recent bars for three possible CHoCH patterns:
// CHoCH Type Definitions in CHoCH Hunter
// Inside → current bar inside previous bar
isInsideBar = high < high and low > low
// Smarty → short-term reversal clue
isSmartyBar = low > low and low < low
// Pivot → minor swing high (small swing detection)
isSmallPivotHigh = ta.pivothigh(high, small_swing_period, small_swing_period)
Filter rules for validity:
CHoCH must occur before the Small LL bar.
Its high must be greater than the Small LL bar’s high (dominance criterion).
5. ⚡ Confirmation & Fibonacci Activation
Once price crosses above the selected CHoCH → setup confirmed.
Fibonacci retracements (logarithmic scale) are calculated:
100% → current high (dynamic, updates before breach).
65% → Golden Zone upper boundary.
50% → Golden Zone lower boundary.
0% → Small LL anchor.
6. 📈 Dynamic Management & Reset Rules
Before 50% breach → Fibo High auto-updates with new highs.
After breach → Levels freeze.
Setup resets if:
Price drops below Small LL.
Price breaks beyond frozen levels.
New Small LL formation detected.
✨ Key Features
📍 Automatic detection of major & minor pivots.
🔍 Clear definitions for Inside, Smarty, Pivot CHoCHs.
📐 Logarithmic Fibonacci retracements for exponential markets.
🎯 Golden Zone highlighting (50%–65%).
🔄 Built-in reset logic to invalidate weak setups.
🎨 Visualization
Pivot markers for Major (📕) & Minor (📘) swings.
Labels for CHoCH points with type (“Inside”, “Smarty”, “Pivot”).
Golden Zone highlighted between 50%–65%.
Optional structure labels for clarity.
⚙️ Inputs & Customization
Major Structure Period (default: 4) — sensitivity for big swings.
Minor Structure Period (default: 2) — sensitivity for small swings.
Toggle display of pivots, structure labels, and Golden Zone.
📚 Educational Value
CHoCH Reversal Hunter is designed to help traders learn:
How bearish structures are objectively defined.
Different CHoCH types and how to filter them.
Applying Fibonacci retracements in structured setups.
⚠️ Risk Disclaimer
🚨 This indicator is for educational purposes only and does not constitute financial advice.
Trading involves significant risk — always backtest and apply sound risk management.
🆕 Release Notes v1.0
Bearish structure detection logic added.
CHoCH type classification (Inside, Smarty, Pivot).
Logarithmic Fibonacci retracement with Golden Zone.
Automatic reset & invalidation rules.
💡 Pro Tip: Watch for the sequence Bearish Background → Small LL → CHoCH → Golden Zone — this is the core hunting pattern of CHoCH Reversal Hunter.

Volatility Wick Trap — Smart Reversal EngineThe Volatility Wick Trap — Smart Reversal Engine is a precision reversal detection tool designed for traders who rely on smart money footprints, volatility compression, and liquidity wick exhaustion to time entries near market turns.
💡 Core Components:
Volatility Squeeze Detection: Identifies candles where range compresses significantly compared to the 14-period average true range, highlighting potential breakout zones.
Liquidity Wick Exhaustion: Detects candles with dominant upper or lower wicks, signaling failed liquidity grabs or stop hunts.
Contextual EMA Filter: Uses a 21-period EMA to filter signals, improving accuracy by aligning with market structure bias.
🔍 How It Works:
Green diamond lines mark bullish hidden reversal zones.
Red diamond lines mark bearish hidden reversal traps.
These lines only appear when volatility compresses and wick traps are confirmed within the trend context.
✅ Clean. Minimal. Tactical.
Ideal for scalpers, swing traders, and smart money enthusiasts looking to fade emotional price spikes.

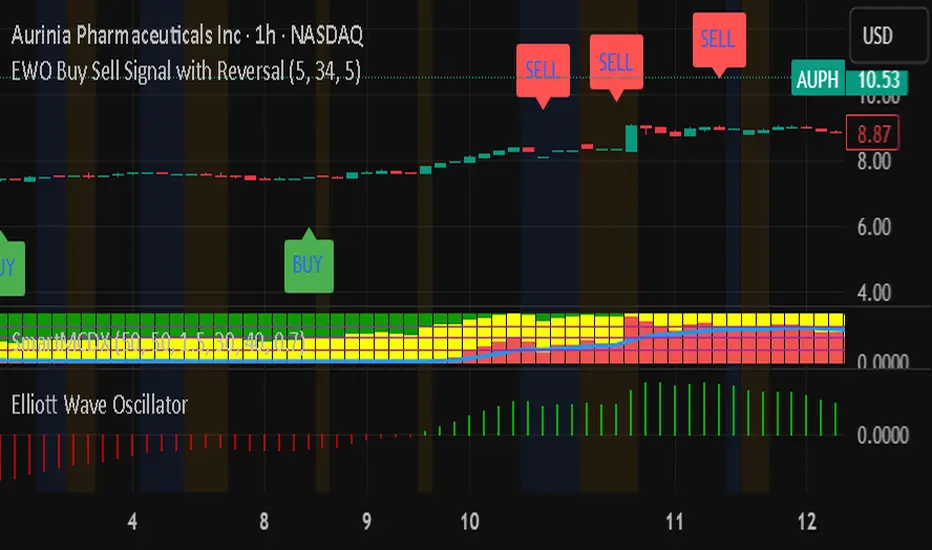
EWO Buy Sell Signal with ReversalEWO Buy Sell Signal with Reversal EWO Buy Sell Signal with Reversal EWO Buy Sell Signal with Reversal EWO Buy Sell Signal with Reversal
WT + Stoch RSI Reversal Combo📊MR.Z RSI : WT + Stochastic RSI Reversal Combo
This custom indicator combines WaveTrend oscillator and Stochastic RSI to detect high-confidence market reversal points, filtering signals so they only appear when both indicators align.
🔍 Core Components:
✅ WaveTrend Oscillator
Based on smoothed deviation from EMA (similar to TCI logic)
Plots:
WT1 (main line)
WT2 (signal line = SMA of WT1)
Uses overbought/oversold thresholds (default: ±53) to filter signals
✅ Stochastic RSI
Momentum oscillator based on RSI's stochastic value
Plots:
%K: smoothed Stoch of RSI
%D: smoothed version of %K
Adjustable oversold/overbought thresholds (default: 20/80)
🔁 Combined Reversal Signal Logic:
🔼 Buy Signal
WT1 crosses above WT2 below WT oversold level (e.g., -53)
%K crosses above %D below Stoch RSI oversold level (e.g., 20)
🔽 Sell Signal
WT1 crosses below WT2 above WT overbought level (e.g., 53)
%K crosses below %D above Stoch RSI overbought level (e.g., 80)
🔔 Signals are only plotted and alerted if both conditions are true.
📌 Features:
Toggle on/off:
WaveTrend lines and histogram
Stochastic RSI
Combined Buy/Sell signals
Horizontal reference lines (±100, OB/OS)
Fully customizable smoothing lengths and thresholds
Signal plots:
✅ Green up-triangle = Combo Buy
✅ Red down-triangle = Combo Sell
Optional: Circle/cross markers for WT-only and Stoch-only signals
🔔 Built-in alerts for Buy/Sell signals
📈 Use Cases:
Reversal Trading: Wait for both indicators to confirm momentum shift
Entry Filter: Use in combination with trend indicators (like EMA)
Scalping or Swing: Works on intraday and higher timeframes

Stochastic Z-Score [AlgoAlpha]🟠 OVERVIEW
This indicator is a custom-built oscillator called the Stochastic Z-Score , which blends a volatility-normalized Z-Score with stochastic principles and smooths it using a Hull Moving Average (HMA). It transforms raw price deviations into a normalized momentum structure, then processes that through a stochastic function to better identify extreme moves. A secondary long-term momentum component is also included using an ALMA smoother. The result is a responsive oscillator that reacts to sharp imbalances while remaining stable in sideways conditions. Colored histograms, dynamic oscillator bands, and reversal labels help users visually assess shifts in momentum and identify potential turning points.
🟠 CONCEPTS
The Z-Score is calculated by comparing price to its mean and dividing by its standard deviation—this normalizes movement and highlights how far current price has stretched from typical values. This Z-Score is then passed through a stochastic function, which further refines the signal into a bounded range for easier interpretation. To reduce noise, a Hull Moving Average is applied. A separate long-term trend filter based on the ALMA of the Z-Score helps determine broader context, filtering out short-term traps. Zones are mapped with thresholds at ±2 and ±2.5 to distinguish regular momentum from extreme exhaustion. The tool is built to adapt across timeframes and assets.
🟠 FEATURES
Z-Score histogram with gradient color to visualize deviation intensity (optional toggle).
Primary oscillator line (smoothed stochastic Z-Score) with adaptive coloring based on momentum direction.
Dynamic bands at ±2 and ±2.5 to represent regular vs extreme momentum zones.
Long-term momentum line (ALMA) with contextual coloring to separate trend phases.
Automatic reversal markers when short-term crosses occur at extremes with supporting long-term momentum.
Built-in alerts for oscillator direction changes, zero-line crosses, overbought/oversold entries, and trend confirmation.
🟠 USAGE
Use this script to track momentum shifts and identify potential reversal areas. When the oscillator is rising and crosses above the previous value—especially from deeply negative zones (below -2)—and the ALMA is also above zero, this suggests bullish reversal conditions. The opposite holds for bearish setups. Reversal labels ("▲" and "▼") appear only when both short- and long-term conditions align. The ±2 and ±2.5 thresholds act as momentum warning zones; values inside are typical trends, while those beyond suggest exhaustion or extremes. Adjust the length input to match the asset’s volatility. Enable the histogram to explore underlying raw Z-Score movements. Alerts can be configured to notify key changes in momentum or zone entries.

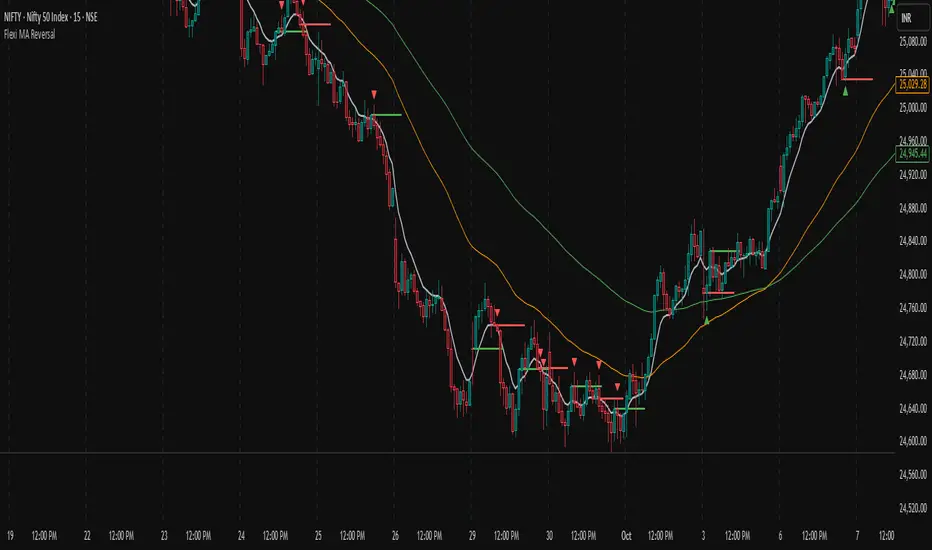
Flexi MA Reversal🔹 FlexiMA Reversal – Customizable MA-Based Reversal Indicator
FlexiMA Reversal is a real-time, moving average-based reversal indicator designed to highlight potential market turning points using signal and alert lines. It provides visual cues for both early alerts and confirmed entry signals on candle close.
🔧 Key Features:
Customizable Moving Average Type: Choose from EMA, SMA, WMA, or VWMA (default is EMA).
Flexible MA Inputs: Configure up to three MAs (commonly used 5, 50, and 200).
Toggle Visibility: Enable or disable each MA line as needed.
Real-Time Alert System:
Thin alert lines appear when a potential reversal is detected.
Thicker signal lines confirm the reversal when price closes beyond the alert level.
Optional Visual Styling:
Choose custom colors for each MA, signal, and alert line.
Alert candles are automatically colored to match the corresponding alert line.
Option to show only signal lines for cleaner charts.
Customizable projection length for both alert and signal lines.
📈 Strategy Logic:
This indicator is designed to detect reversal opportunities based on the relationship between price and a selected short-term moving average.
Bullish Setup:
Price closes below the selected MA (e.g., EMA 5).
A bullish alert line is drawn at the high.
If a subsequent candle closes above the alert line and the MA, a bullish signal line is plotted.
Bearish Setup:
Price closes above the selected MA.
A bearish alert line is drawn at the low.
If a subsequent candle closes below the alert line and the MA, a bearish signal line is plotted.
This approach attempts to capture quick market shifts where short-term momentum reverses direction near key MA levels.
🎯 How to Use:
Although originally developed using the 5 EMA strategy, through testing it was found that using 6, 7, or 8 EMA offers even better signal quality.
To add broader trend context, 50 MA and 200 MA lines are included and can be toggled on/off based on your strategy preference.
🔍 Trend Filtering & Re-Entry Tips:
Due to the nature of shorter moving averages, reversal signals may appear frequently. For better trend alignment:
Use the 50 MA as a trend filter:
❌ Ignore bearish signals when price is above 50 MA
❌ Ignore bullish signals when price is below 50 MA
Alternatively, filtered-out signals can be used for re-entry within the trend:
For example, if you receive a bearish alert and signal above the 50 MA, and the next candle closes back above the bearish alert line, this may be interpreted as a bullish re-entry opportunity into the prevailing uptrend.
🛠️ Styling Tips:
You can disable alert candle coloring in the Style tab of the indicator settings.
Use the "Show Only Signal Lines" checkbox to keep the chart minimalistic while still tracking confirmed entries.
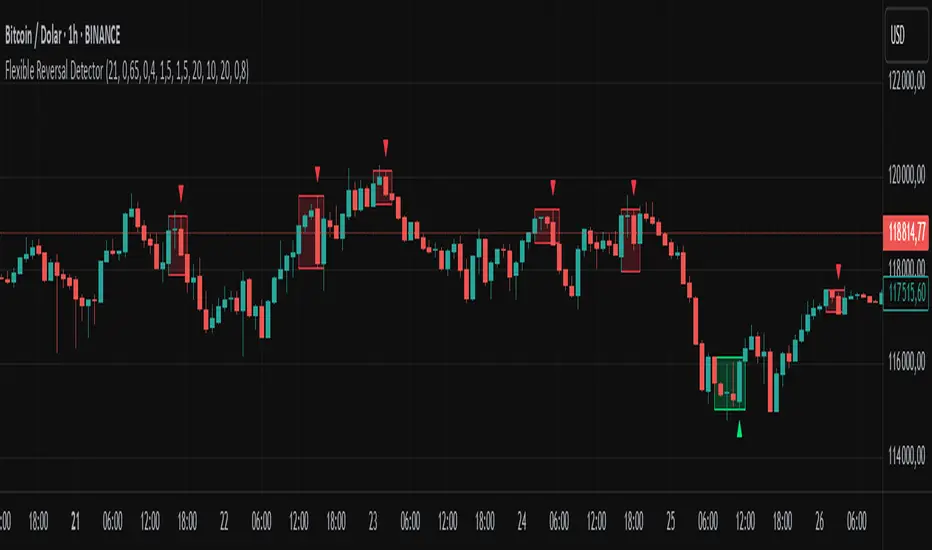
Flexible Reversal DetectorFlexible Reversal Detector
An advanced, fully customizable analytical tool designed to identify local trend reversal zones based on candlestick formations. Users have full control over all logic parameters, making it adaptable to different trading styles and preferences.
Key Features
Adjustable maximum pattern length (number of candles)
Customizable body size ratios for initial, middle, and final candles
Configurable minimum price movement (in %) required before a pattern is considered valid
Colored horizontal lines showing the full length of the pattern – helpful in identifying structure, potential support/resistance zones
Optional volume filter – the volume of the final candle is compared to a volume SMA; multiplier can be adjusted (e.g. 1 = equal to average, 0.8 = 80% of average)
Logic Overview
U Pattern
Each bearish candle is treated as a potential start of a reversal pattern.
Subsequent candles, if small enough and within defined thresholds, form the middle part of the structure.
When a bullish candle with a sufficiently large body appears, it is marked as the final candle of the pattern.
The pattern is considered valid if it was preceded by a defined percentage price drop and – optionally – if the volume condition was met.
∩ Pattern
Each bullish candle may act as the initial candle of a potential reversal pattern in the opposite direction.
Following smaller candles form the middle part, as long as they meet the defined criteria.
The appearance of a strong bearish candle marks the end of the formation.
If this pattern is preceded by a certain price increase (and optionally meets the volume filter), it is highlighted on the chart.
Note: On markets with low volatility or on lower timeframes, it is recommended to reduce the percentage thresholds for signal detection. For more dynamic price action or higher timeframes, consider increasing them accordingly.
Visualization
The final candle of the pattern is marked visually on the chart (depending on direction)
Colored horizontal lines indicate the full span of the pattern – from initial to final candle
Lucy – 3-Bar Reversal with EMA50 Trend Filter📛 Lucy – 3-Bar Reversal with EMA50 Trend Filter
Purpose:
To detect and highlight bullish and bearish 3-bar reversal patterns on the chart, but only when they align with the dominant trend, defined by the EMA 50.
✅ How It Works
🟢 Bullish 3-Bar Reversal (Buy Setup):
Bar 1 is bearish (close < open)
Bar 2 makes a lower low than Bar 1
Bar 3 is bullish (close > open) and closes above Bar 2’s high
Price must be above EMA 50 (trend filter)
✅ Result: Shows a green triangle below the bar
🔴 Bearish 3-Bar Reversal (Sell Setup):
Bar 1 is bullish (close > open)
Bar 2 makes a higher high than Bar 1
Bar 3 is bearish (close < open) and closes below Bar 2’s low
Price must be below EMA 50
✅ Result: Shows a red triangle above the bar
📊 What It Plots:
🔼 Green triangle below bullish signal bar
🔽 Red triangle above bearish signal bar
🟠 Orange line = EMA50 (trend filter)
🔔 Built-in Alerts:
You’ll get an alert if:
A bullish reversal pattern forms above EMA50
A bearish reversal pattern forms below EMA50
🧠 Use Cases:
Great for trend-following traders who want clean, price-action entries
Works well on intraday (15m/1h) or swing (4h/daily) timeframes
Can be used for manual entries, or converted to strategy for automation
Future Candle Reversal Projection (Mastersinnifty)Overview
This tool identifies potential future market reversal zones by dynamically projecting pivot-based swing patterns forward in time. Unlike traditional ZigZag indicators that only reflect past movements, this indicator anticipates probable future turning points based on historical swing periodicity.
---
Key Features
- Forward Projections: Calculates and projects future swing zones based on detected pivot distances.
- Customizable Detection: Adjust the ZigZag depth for different trading styles (scalping, swing, position).
- Dynamic Updates: Real-time recalibration as new pivots form.
- Clean Visual Markers: Projects reversal estimates as intuitive labels and dotted lines.
---
How it Works
The indicator identifies significant swing highs and lows using a user-defined ZigZag depth setting. It measures the time (bars) and price characteristics of the latest swing movement. Using this pattern, it projects forward estimated reversal points at consistent intervals. Midpoint price levels between the last high and low are used for each future projection.
---
Who Can Benefit
- Intraday and swing traders seeking advanced planning zones.
- Technical analysts relying on pattern periodicity.
- Traders who wish to combine projected reversal markers with their own risk management strategies.
---
Disclaimer
This tool is an analytical and educational utility. It does not predict markets with certainty. Always combine it with your own analysis and risk management. Past behavior does not guarantee future results.

Red & Green Zone ReversalOverview
The “Red & Green Zone Reversal” indicator is designed to visually highlight potential reversal zones on your chart by using a combination of Bollinger Bands and the Relative Strength Index (RSI).
It overlays on the chart and provides background color cues—red for oversold conditions and green for overbought conditions—along with corresponding alert triggers.
Key Components
Overlay: The indicator is set to overlay the chart, meaning its visual cues (colored backgrounds) are drawn directly on the price chart.
Bollinger Bands Calculation
Period: A 20-period simple moving average (SMA) is calculated from the closing prices.
Standard Deviation Multiplier: A multiplier of 2.0 is applied.
Bands Defined:
Basis: The 20-period SMA.
Deviation: Calculated as 2 times the standard deviation over the same period.
Upper Band: Basis plus the deviation.
Lower Band: Basis minus the deviation.
RSI Calculation
Period: The RSI is computed over a 14-period span using the closing prices.
Thresholds:
Oversold Threshold: 30 (used for the red zone condition).
Overbought Threshold: 70 (used for the green zone condition).
Zone Conditions
Red Zone (Oversold):
Criteria: The price is below the lower Bollinger Band and the RSI is below 30.
Purpose: Highlights a situation where the asset may be deeply oversold, signaling a potential reversal to the upside.
Green Zone (Overbought):
Criteria: The price is above the upper Bollinger Band and the RSI is above 70.
Purpose: Indicates that the asset may be overbought, potentially signaling a reversal to the downside.
Visual and Alert Components
Background Coloring:
Red Background: Applied when the red zone condition is met (using a semi-transparent red).
Green Background: Applied when the green zone condition is met (using a semi-transparent green).
Alerts:
Red Alert: An alert condition titled “Deep Oversold Alert” is triggered with the message “Deep Oversold Signal triggered!” when the red zone criteria are satisfied.
Green Alert: Similarly, an alert condition titled “Deep Overbought Alert” is triggered with the message “Deep Overbought Signal triggered!” when the green zone criteria are met.
Important Disclaimers
Not Financial Advice:
This indicator is provided for informational and analytical purposes only. It does not constitute trading advice or a recommendation to buy or sell any asset. Traders should use it as one of several tools in their analysis and should perform their own due diligence.
Risk Management:
Trading inherently involves risk. Past performance is not indicative of future results. Always implement appropriate risk management and use stop losses where necessary.
Summary
In summary, the “Red & Green Zone Reversal” indicator uses Bollinger Bands and RSI to detect extreme market conditions. It visually marks oversold (red) and overbought (green) conditions directly on the chart and offers alert conditions to help traders monitor these potential reversal points.
Enjoy!!

5-0 Harmonic Pattern [TradingFinder] 0XABCD 50 Harmonic Detector🔵 Introduction
Harmonic patterns are a powerful tool in technical analysis, widely used to detect reversal points and trend changes. Among these, the 5-0 Harmonic Pattern stands out due to its reliance on specific Fibonacci ratios—1.13, 1.618, 2.24, and 0.45 to 0.55—anchored at points 0, X, A, B, C, and D. This pattern provides a structured approach for identifying critical buy and sell points, helping traders achieve optimal entry and exit levels in volatile markets.
This 5-0 Harmonic Pattern indicator automatically detects and marks bullish and bearish formations on the chart, offering precise trading signals based on established harmonic ratios. With its dynamic signals, the 5-0 pattern enables traders to anticipate market movements and capitalize on favorable price trends.
Especially in fast-moving markets, harmonic patterns, particularly the 5-0 Harmonic Pattern, equip traders with an essential framework for identifying reversal opportunities and refining their trading strategies.
Bullish 5-0 Pattern :
Bearish 5-0 Pattern :
🔵 How to Use
The 5-0 Harmonic Pattern indicator is designed to automatically mark the key levels of the harmonic structure: 0, X, A, B, C, and D. By doing so, it detects both bullish and bearish patterns and helps traders recognize optimal entry and exit points.
Formed through specific Fibonacci levels, this pattern signals potential shifts in trend direction, giving traders critical insights for managing entries and exits effectively. The tool proves valuable in high-volatility settings, enabling traders to leverage these signals for refined decision-making.
🟣 Bullish 5-0 Pattern
A bullish 5-0 pattern materializes when Fibonacci levels indicate a potential price reversal to the upside. With points 0, X, A, B, C, and D in alignment, the indicator highlights this upward momentum by displaying a green arrow as a buy signal on the chart. This marking provides a clear entry point, indicating that prices are likely to rise, making it a prime moment for traders to enter long positions.
Additionally, the bullish 5-0 pattern is equipped with tools for traders to set stop-loss and take-profit points based on harmonic lines within the pattern, which represent support and resistance levels. Using these dynamic points, traders can create a more effective risk-reward setup while following the bullish signals in a standalone harmonic strategy.
🟣 Bearish 5-0 Pattern
The bearish 5-0 pattern functions similarly but signals a likely downturn. This pattern emerges when Fibonacci ratios align at points 0, X, A, B, C, and D, predicting a reversal downward. The indicator generates a sell signal, marked by a red arrow, prompting traders to exit long positions or initiate short trades to capitalize on falling prices.
Traders can utilize this bearish pattern for defining exit strategies and setting key levels for stop-loss and take-profit orders. The bearish 5-0 pattern enhances traders’ abilities to gauge critical price levels and manage trade risk effectively, especially in volatile markets. For traders focused on profiting from downward trends, this indicator serves as a powerful tool for timely entries and exits.
🔵 Setting
🟣 Logical Setting
ZigZag Pivot Period : You can adjust the period so that the harmonic patterns are adjusted according to the pivot period you want. This factor is the most important parameter in pattern recognition.
Show Valid Forma t: If this parameter is on "On" mode, only patterns will be displayed that they have exact format and no noise can be seen in them. If "Off" is, the patterns displayed that maybe are noisy and do not exactly correspond to the original pattern.
Show Formation Last Pivot Confirm : if Turned on, you can see this ability of patterns when their last pivot is formed. If this feature is off, it will see the patterns as soon as they are formed. The advantage of this option being clear is less formation of fielded patterns, and it is accompanied by the latest pattern seeing and a sharp reduction in reward to risk.
Period of Formation Last Pivot : Using this parameter you can determine that the last pivot is based on Pivot period.
🟣 Genaral Setting
Show : Enter "On" to display the template and "Off" to not display the template.
Color : Enter the desired color to draw the pattern in this parameter.
LineWidth : You can enter the number 1 or numbers higher than one to adjust the thickness of the drawing lines. This number must be an integer and increases with increasing thickness.
LabelSize : You can adjust the size of the labels by using the "size.auto", "size.tiny", "size.smal", "size.normal", "size.large" or "size.huge" entries.
🟣 Alert Setting
Alert : On / Off
Message Frequency : This string parameter defines the announcement frequency. Choices include: "All" (activates the alert every time the function is called), "Once Per Bar" (activates the alert only on the first call within the bar), and "Once Per Bar Close" (the alert is activated only by a call at the last script execution of the real-time bar upon closing). The default setting is "Once per Bar".
Show Alert Time by Time Zone : The date, hour, and minute you receive in alert messages can be based on any time zone you choose. For example, if you want New York time, you should enter "UTC-4". This input is set to the time zone "UTC" by default.
Conclusion
The 5-0 Harmonic Pattern indicator serves as a robust solution for technical analysts and traders looking to pinpoint market reversal points. By automatically recognizing 5-0 patterns and generating buy and sell signals based on Fibonacci ratios, this tool supports precise trend analysis and entry/exit timing. The indicator’s adjustable alerts, color themes, and pattern toggles allow for comprehensive customization, ensuring alignment with individual trading strategies.
Harmonic patterns, especially the 5-0 Harmonic Pattern, guide traders in identifying high-accuracy entry and exit points, thus aiding in more informed trading decisions. By combining Fibonacci ratio analysis with real-time signal updates, this indicator provides a well-rounded approach for risk management and capitalizing on trading opportunities. Professional traders can harness this tool to enhance technical analysis precision and capitalize on price trends effectively, maximizing profitability in both bullish and bearish markets.

Smart Signals Assistant [AlgoAlpha]🟠 OVERVIEW
The Smart Signals Assistant is a comprehensive, all-in-one trading toolkit designed to provide a complete analytical framework on your chart. It is built around a primary signal engine that generates trend and reversal signals, enhanced by a suite of five optional "confluence" indicators that provide deeper market context.
This script is highly modular, allowing you to build a personalized dashboard. You can use the main signals for entries, add a machine-learning classifier to check if the market is trending, overlay dynamic support/resistance clouds, and manage your trades with on-chart take-profit and stop-loss levels. The system is tied together with a powerful, multi-step alert builder that lets you create custom alert conditions from any combination of the script's components.
🟠 CONCEPTS
This indicator is a collection of several distinct systems working together. The combination is designed to allow traders to build a complete strategy—from signal generation to confirmation and trade management—within a single tool. Here are the core concepts behind them:
Smart Signals Engine: This is the heart of the indicator and operates as a hybrid with two distinct modes. The "Swing" mode uses a proprietary model that analyzes price stability and volatility to identify stable, longer-term trends. The "Scalping" mode uses a more responsive machine-laerning trend system that dynamically adapts its parameters based on learned market 'states' to real-time changes in market conditions, making it better suited for faster, lower-timeframe movements.
Fair Value Trail (FVT): This is not a simple moving average. It's a volatility-based trail that helps identify dynamic zones of support and resistance. The concept is to track a "fair value" price, derived by analyzing price levels with significant volume activity, providing logical areas for entries or trailing stop-loss adjustments.
Trend Spine: This component calculates a core trend backbone. Its purpose is to cut through short-term noise and provide a clearer, more stable view of the underlying primary trend direction by filtering out price action during periods of low directional momentum.
Trend Bias: This is a band that measures the strength and weakness of the current price momentum. It visualizes whether bullish or bearish pressure is accelerating or decelerating by comparing recent momentum to its historical average, which is useful for confirming the conviction behind a move.
Firmament Clouds: These are dynamic zones plotted on the chart that act as potential areas of support and resistance. Unlike static lines, these clouds expand and contract based on market volatility, providing an adaptive view of key price zones where the market may be overextended.
Trend-Range Classifier (TRC): This is a machine learning model that analyzes multiple market characteristics (like volatility and momentum patterns) in real-time. It classifies the current market environment as either "trending" or "ranging," helping you decide which strategy to apply and filter signals that are inappropriate for the current conditions.
🟠 FEATURES
Trend & Reversal Signals: Configure the main engine to provide either trend-following signals or potential counter-trend reversal signals. Signals are categorized as "Normal" or "Strong" to indicate conviction.
Advanced Candle Coloring: Choose from multiple candle coloring modes, including static trend colors, a color gradient based on momentum, or a gradient based on volume. Also includes an option to highlight ranging markets with gray candles.
Automated Trade Management: Enable on-chart Take-Profit and Stop-Loss levels that are automatically calculated when a signal appears. These are visualized with colored risk/reward zones.
Component Status Table: A customizable on-chart dashboard that shows the live status, direction, and signal duration for every active component, giving you a complete overview at a glance.
Powerful Multi-Step Alert System: Build highly specific, custom alerts. You can combine dozens of built-in conditions from all components using AND/OR logic across a sequence of up to 7 steps.
External Alert Integration: The alert system can incorporate up to five external sources, allowing you to mix conditions from this script with your other favorite indicators.
🟠 USAGE
This script is designed to be adapted to your personal trading style by combining components to build a complete strategy. The synergy between the components is key to its usefulness. Here is a general workflow:
Initial Configuration: Start by enabling the core "Smart Signals" in the settings. Choose your preferred "Smart Signals Mode" (Swing or Scalping) and "Signal Mode" (Trend or Reversal) based on your strategy and timeframe.
Adding Confluence for Reliability: To increase the reliability of signals, enable one or more confluence tools. For example, a trend trader can enable the "Trend-Range Classifier" and decide to only consider signals that appear when the market is classified as "Trending." You could further enhance this by also enabling the "Fair Value Trail" and only taking buy signals that occur near or above the trail. This demonstrates how combining components filters for higher-quality setups.
Reading the Visuals: A standard "▲" or "▼" represents a normal signal, while a "+▲" or "+▼" indicates a strong signal with higher conviction. Use the candle colors to gauge the momentum within the trend.
Managing Trades: If you enable "Take-Profit Levels" and "Stop-Loss Level," the script will automatically plot these on your chart when a signal appears. This can help you pre-plan your risk and potential targets. The exit signals ("x") can be used as a suggestion for taking partial or full profits.
Setting Up Custom Alerts for High-Probability Setups: For a high-probability setup, navigate to the "Alerts" tab. You can create a sequence that combines multiple components to fire only on your ideal conditions. For instance:
Step 1: "Smart Signals Strong Bullish Signal "
Step 2: "Market Is Trending " AND "FVT In Bullish Trend "
This alert would only trigger when a strong buy signal occurs while the TRC confirms a trend and the price is in a favorable position relative to the Fair Value Trail, effectively filtering out lower-quality signals by demanding agreement between multiple, conceptually different components.
Paid script

Shark Harmonic Pattern [TradingFinder] Shark Detector Indicator🔵 Introduction
The Shark harmonic pattern, first introduced by Scott Carney in 2011, is a recognized tool in technical analysis. Since its inception, it has been widely adopted by traders as an essential market analysis tool.
Due to its complexity, the Shark pattern can be challenging for novice traders. Therefore, we have developed the Harmonic Pattern Indicator to help analysts and traders easily identify these patterns.
🟣 Understanding the Types of Shark Pattern
In technical analysis, the Shark harmonic pattern forms at the end of trends and is categorized into two types: Bullish and Bearish Shark Patterns.
Bullish Shark Pattern : This pattern appears at the end of a downtrend, indicating a potential reversal to an uptrend. Traders can use this pattern to identify buy entry points. The image below illustrates the core components of the Bullish Shark Pattern.
Bearish Shark Pattern : Conversely, the Bearish Shark Pattern forms at the end of an uptrend, signaling a possible reversal to a downtrend. This pattern prompts traders to shift their positions from buying to selling. The image below showcases the characteristics of the Bearish Shark Pattern.
🔵 How to Use
🟣 Trading with the Bullish Shark Pattern
The Bullish Shark Pattern acts as a reversal pattern, helping traders identify the end of a downtrend and the beginning of an uptrend. It consists of five key points that indicate alternating bullish and bearish movements.
Upon the complete formation of this pattern, traders can look for opportunities to enter buy trades. To manage risk effectively, it is advisable to set a stop-loss below the lowest price point within the pattern.
🟣 Trading with the Bearish Shark Pattern
Similarly, the Bearish Shark Pattern functions as a reversal pattern but in the opposite direction. It helps traders identify the end of an uptrend and the onset of a downtrend.
After the pattern fully forms, traders can seek sell entry opportunities. As with the bullish pattern, placing a stop-loss above the highest price point within the pattern is recommended for risk management.
🔵 Setting
🟣 Logical Setting
ZigZag Pivot Period : You can adjust the period so that the harmonic patterns are adjusted according to the pivot period you want. This factor is the most important parameter in pattern recognition.
Show Valid Format : If this parameter is on "On" mode, only patterns will be displayed that they have exact format and no noise can be seen in them. If "Off" is, the patterns displayed that maybe are noisy and do not exactly correspond to the original pattern.
Show Formation Last Pivot Confirm : if Turned on, you can see this ability of patterns when their last pivot is formed. If this feature is off, it will see the patterns as soon as they are formed. The advantage of this option being clear is less formation of fielded patterns, and it is accompanied by the latest pattern seeing and a sharp reduction in reward to risk.
Period of Formation Last Pivot : Using this parameter you can determine that the last pivot is based on Pivot period.
🟣 Genaral Setting
Show : Enter "On" to display the template and "Off" to not display the template.
Color : Enter the desired color to draw the pattern in this parameter.
LineWidth : You can enter the number 1 or numbers higher than one to adjust the thickness of the drawing lines. This number must be an integer and increases with increasing thickness.
LabelSize : You can adjust the size of the labels by using the "size.auto", "size.tiny", "size.smal", "size.normal", "size.large" or "size.huge" entries.
🟣 Alert Setting
Alert : On / Off
Message Frequency : This string parameter defines the announcement frequency. Choices include: "All" (activates the alert every time the function is called), "Once Per Bar" (activates the alert only on the first call within the bar), and "Once Per Bar Close" (the alert is activated only by a call at the last script execution of the real-time bar upon closing). The default setting is "Once per Bar".
Show Alert Time by Time Zone : The date, hour, and minute you receive in alert messages can be based on any time zone you choose. For example, if you want New York time, you should enter "UTC-4". This input is set to the time zone "UTC" by default.
🔵 Conclusion
The Shark harmonic pattern is a potent analytical tool in technical analysis that aids traders in identifying critical reversal points in financial markets. Whether in a bullish or bearish context, this pattern provides clear trend change signals, allowing traders to enter trades with greater precision and optimize their strategies.
However, as with all analytical methods, it is essential to supplement the Shark pattern with additional analyses and strict risk management to avoid potential losses. Incorporating this pattern into a comprehensive trading strategy can lead to better trade outcomes and more opportunities for success

Bearish 3 Bars Reversal PatternThis TradingView Pine Script indicator identifies and highlights a bearish 3-bar reversal pattern on your chart. The script also calculates the percentage difference between the current low and the previous high, displaying this value on the chart when the pattern is detected.
Features:
Pattern Detection:
The script detects a bearish 3-bar reversal pattern when the high of the previous bar is higher than the high of the bar before it, and the current high is lower than the previous high.
Percentage Difference Calculation:
When the pattern is detected, the script calculates the percentage difference between the current low and the previous high. This percentage is displayed on the chart.
Visual Indicators:
When a bearish 3-bar reversal pattern is detected, a label is created on the chart showing the calculated percentage difference. The label is styled with a downward arrow, red color, and white text for clear visibility.
Alerts:
An alert condition is set up to notify users when the bearish 3-bar reversal pattern is detected. This allows traders to take timely action based on the pattern.
