MACD Alert [All MA in one] [Smart Crypto Trade (SCT)]This code is a gift from "Smart Crypto Trade (SCT)" group
MACD indicator contains 3 EMA, I think one of the best usage of MACD is trend detection and divergences.
In our indicator, you can select the type of Moving averages that used in macd.
You can using "MACD" based on several types of moving averages including:
Exponential Moving Average ( EMA )
Volume-Weighted Moving Average ( VWMA )
Simple Moving Average ( SMA )
Weighted Moving Average ( WMA )
Exponentially Weighted Moving Average (RMA) that used in RSI
Smoothed Moving Average ( SMMA )
Arnaud Legoux Moving Average ( ALMA )
Double EMA ( DEMA )
Double SMA (DSMA)
Double WMA (DWMA)
Double RMA (DRMA)
Triple EMA ( TEMA )
Triple SMA (TSMA)
Triple WMA (TWMA)
Triple RMA (TRMA)
Linear regression curve Moving Average ( LSMA )
Variable Index Dynamic Average ( VIDYA )
Fractal Adaptive Moving Average ( FRAMA )
In other words we tried to collect all the most popular MAs in our MACD indicator.
In addition, you can use four types of alert or alarm conditions for detection LONG or SHORT positions and trends. For this, you must set an alert in alert tab and set the condition based on four defaults conditions.
Enjoy
Search in scripts for "rma"

DPO RMA STRATEGYThis strategy uses tradingview's built-in "Detrended Price Osciilator" ( DPO )indicator script.
It takes the average of 6 different fib lookback periods. (55,89,144,233,377,610)
This is plotted in the purple line.
It then takes the RMA of the DPO and uses the RMA's to determine entry points with crossovers and crossunders.
It's an extremely easy indicator to use. You mostly only need to adjust the last 2 inputs (These are the RMA Smoother inputs)
Works well with most any market and with any timeframe.
Works great on Heiken Ashi if you keep orders under 150. But I can't post in heiken ashi format thanks to automated traders complaining to tradingivew that they can't make any money with heiken ashi candles
And then pine coders like this that are embraced with high regard because they realized that they can spam a heiken ashi chart with over 400 trades and magically it has excessive slippage.

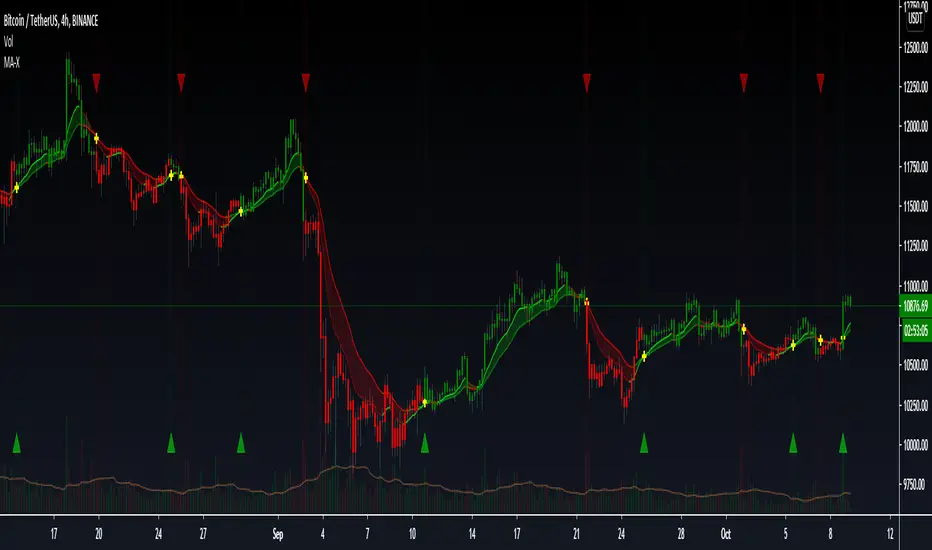
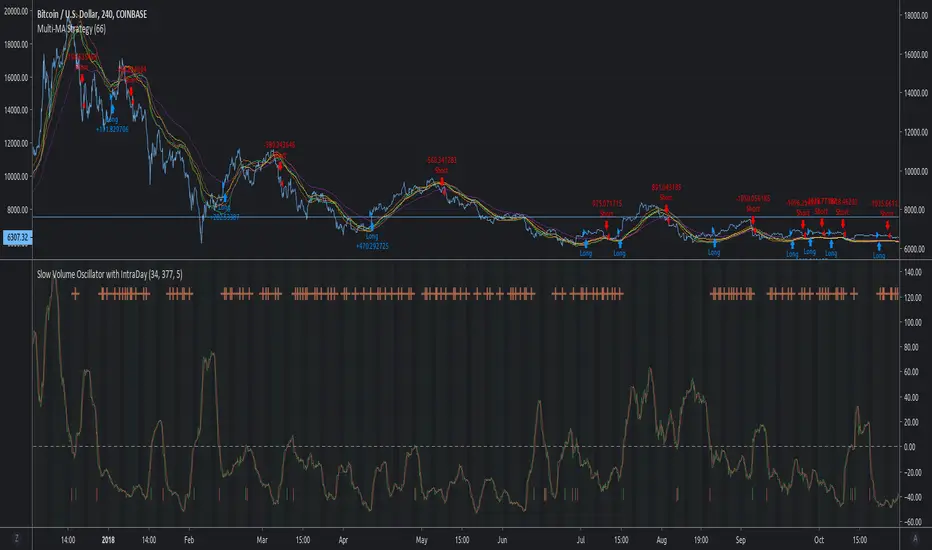
MACD Multi-MA StrategyThis script applies the average of each major MA (SMA, RMA, EMA, WVMA, WMA) to the MACD formula.
The logic is simple. When all 5 MA's are in agreement in direction, then then script will notify users of change.
I posted this as a strategy to help show how logic does in back test. If you use my simple yet effective solution to find take profit locations, you can blow this back testing out of the water!!!
To set alerts simply turn script into study
//@version=2
study(title="MACD Multi-MA Study", overlay=false)
src = close
len1 = input(8, "FAST LOOKBACK")
len2 = input(144, "SLOW LOOKBACK")
/////////////////////////////////////////////
length = len2-len1
ma = vwma(src, length)
plot(ma, title="VWMA", color=lime)
length1 = len2-len1
ma1 = rma(src, length1)
plot(ma1, title="RMA", color=purple)
length2 = len2-len1
ma2 = sma(src, length2)
plot(ma2, title="SMA", color=red)
length3 = len2-len1
ma3 = wma(src, length3)
plot(ma3, title="WMA", color=orange)
length4 = len2-len1
ma4 = ema(src, length4)
plot(ma4, title="EMA", color=yellow)
long = ma > ma and ma1 > ma1 and ma2 > ma2 and ma3 > ma3 and ma4 > ma4
short = ma < ma and ma1 < ma1 and ma2 < ma2 and ma3 < ma3 and ma4 < ma4
alertcondition(long == true, title='MACD LONG SIGNAL', message='MACD LONG!')
alertcondition(short == true, title='MACD SHORT SIGNAL', message='MACD SHORT!')
DeepClean Linear indicator 1. Indicator Name
DeepClean Linear indicator
2. One-Line Introduction
A trend-recognition indicator that overlays a “transparent wave” on price, removing noise and revealing directional bias and trend intensity in a highly intuitive visual form.
3. Overall Summary
The DeepClean Linear indicator calculates trend direction using changes in linear regression slope and determines trend strength by comparing how consistently the regression line moves over a defined lookback window.
Rather than merely identifying trend direction, the indicator applies a triple-layer noise-filtering process (EMA → SMA → RMA) to produce a clean, wave-shaped data line that filters out unnecessary market noise.
This transparent wave sits directly on top of price, allowing traders to visually compare price movement and trend strength at the same time.
A stronger trend results in a taller, thicker wave, while weakening momentum causes the wave to thin, making it easier to spot trend continuation, exhaustion, or upcoming reversal.
Color automatically shifts based on trend:
Bright cyan/teal during bullish conditions
Reddish tones during bearish conditions
Transparency dynamically adjusts depending on strength
The indicator excels at identifying the true underlying trend by ignoring minor fluctuations and is well suited for scalping, swing trading, and position trading.
It also significantly reduces false signals in ranging markets, making it ideal for trend-following strategies.
4. Advantages
① Ultra-Clean Noise-Reduced Wave
Utilizes a 3-stage smoothing filter (EMA → SMA → RMA) to produce a much cleaner wave than standard moving averages, highlighting only core trend movement.
② Trend Direction & Strength at a Glance
Based on comparative linear regression behavior, the indicator quantifies both direction and strength, making convergence/divergence highly visible.
③ Intuitive Price Overlay Visualization
The semi-transparent wave sits directly on price action, allowing traders to instantly see divergence from price, trend weakening, or early turning points.
④ Dynamic Transparency Coloring
Strong trends appear bold and intense, while weaker trends fade visually—making signal interpretation effortless.
⑤ Excellent Range Filtering
During low-direction phases (state = 0), the wave turns neutral, preventing forced or premature entries.
⑥ Multi-Timeframe Compatibility
The wave remains stable from 1-minute to weekly charts, making it suitable for trend analysis, execution, and risk control across all timeframes.
📌 Core Concept Overview
The indicator evaluates the relative comparison of linear regression values over the last n periods.
A positive trend value indicates bullish bias
A negative trend value indicates bearish bias
Intensity represents strength and controls wave height
waveTop / waveBot define the visual wave area relative to price
State Values
1 = Bullish Trend
-1 = Bearish Trend
0 = Neutral / Weak Direction
⚙️ Settings Overview
Option Description
Trend Lookback (n) Comparison window for regression slope. Higher = bigger trend focus.
Range Tolerance (%) Strength threshold to classify bullish/bearish movement. Higher = more conservative.
Source Price source for regression calculations.
Linear Reg Length Length of the linear regression.
Noise Filter Strength (smoothK) Controls the smoothing intensity. Higher = smoother wave.
Wave Amplitude (amp) Adjusts the height/thickness of the wave.
Bull/Bear Color Colors for bullish/bearish waves.
Base Transparency Base opacity level; modified dynamically by trend strength.
📈 Bullish Timing Recognition Examples
Wave begins turning brighter teal and more opaque, indicating strengthening upward pressure.
waveTop expands above price, signaling early trend expansion.
State flips to 1, often marking a trend restart or early reversal phase.
A steadily rising wave height suggests sustained bullish momentum.
📉 Bearish Timing Recognition Examples
Wave shifts into red tones, showing bearish dominance.
waveBot expands below price, indicating rising downside volatility.
State stays at -1 while intensity increases, signaling entry into strong downtrend conditions.
A shift from weak → strong bearish intensity can provide short-entry timing cues.
🧪 Recommended Usage
Use as a core component in trend-following systems
Adjust position size based on wave thickness (trend strength)
Combine with RSI/MACD to reduce false signals during overbought/oversold zones
Sudden wave expansion during volatility increases helps detect trend acceleration
In sideways markets, frequent state = 0 readings help avoid low-probability trades
🔒 Important Notes
As a trend-based indicator, it may misread choppy/ranging markets
Because of smoothing, signals may appear slightly delayed
Extreme news volatility can temporarily distort trend clarity

Stop Loss With Average True Range (ATR)Stop Loss With Average True Range (ATR)
It simplifies the calculation of stop loss price for stop loss method using the average true range (ATR).
For example;
You want to stop loss below 3 ATR. Let's assume the price is 100, the average true range is 5. You will multiply the average true range by 3 and subtract from the price and enter a stop loss order at the 85 price you have reached. Instead of doing this calculation every time, you just need to use this script and set the multiplier to 3. A stop loss line will be drawn below the price candles.
You can set the method to be used when averaging the true range. Methods you can use to average: EMA (exponentially moving average), HMA (hull moving average), RMA (moving average used in RSI), SMA (simple moving average), SWMA (symmetrically weighted moving average), VWMA (volume-weighted moving average), WMA (weighted moving average).
You can set the length to be used when averaging the true range.
You can set the multiplier to be used when determining the stop loss price.
Turkish
Ortalama Gerçek Aralıkla (ATR) Zarar Durdurma
Gerçek aralığın ortalamasını kullanarak zarar durdurma yöntemi için zarar durdurma fiyatının hesaplanmasını kolaylaştırır.
Örneğin;
3 ATR kadar aşağıda zarar durdurmak istiyorsunuz. Fiyatın 100, ortalama gerçek aralığın 5 olduğunu varsayalım. Ortalama gerçek aralığı 3 ile çarparak fiyattan çıkaracaksınız ve ulaştığınız 85 fiyatına zarar durdurma emri gireceksiniz. Bu hesabı her seferinde yapmak yerine bu betiği kullanmanız ve çarpanı 3 olarak ayarlamanız yeterli. Bu sayede fiyat mumlarının altına zarar durdurma çizgisi çizilecektir.
Gerçek aralığın ortalaması alınırken kullanılacak yöntemi ayarlayabilirsiniz. Ortalama almak için seçebileceğiniz yöntemler: EMA (üstel hareketli ortalama), HMA (gövde hareketli ortalama), RMA (göreceli hareketli ortalama), SMA (basit hareketli ortalama), SWMA (simetrik ağırlıklı hareketli ortalama), VWMA (hacim ağırıklı hareketli ortalama), WMA (ağırlıklı hareketli ortalama).
Gerçek aralığın ortalaması alınırken kullanılacak periyot uzunluğunu ayarlayabilirsiniz.
Zarar durdurma fiyatını belirlerken kullanılacak çarpanı ayarlayabilirsiniz.

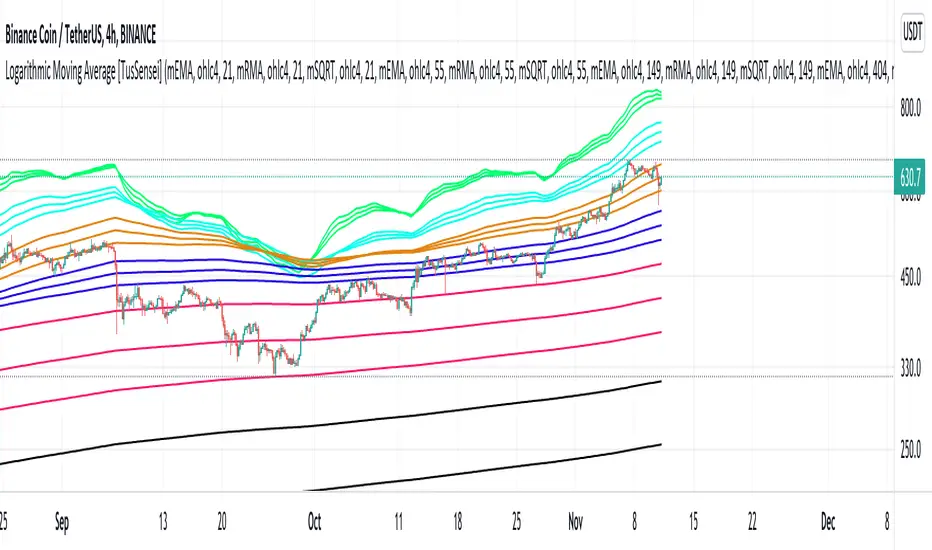
Logarithmic Moving Average [TusSensei]Logarithmic moving averages involve mathematical modification of classical moving averages(EMA-RMA-SMA). Logarithmic modified averages deviate high over short time periods. For long time periods, it behaves exactly like the original moving averages. Its basic formulation is (MovingAverage x (1 + (1 / log(length))).
The most important reason for the operability of logarithmic moving averages is the time periods they use. The values used are 21-55-149-404-1098-2981. These numbers are the consecutive powers of the number "e", which is the base of the natural logarithm (rounded up to an integer).
In this script you will also see another moving average called SQRT. This moving average is equal to the square root of the product of the EMA and the RMA. In other words, it is a moving average that is the geometric mean of two averages. In this script, you can use all of the EMA-RMA-SQRT and SMA averages in the classical and modified way. For formulaic modification, it is sufficient to select "mEMA", "mRMA" forms from the setting section.
Thanks everyone!
[Saga Trading] Moving Average ProThis open-source indicator provides trend and market structure context using multiple moving averages.
It allows traders to visualize several moving averages simultaneously, with configurable calculation methods (EMA, SMA, or RMA), in order to better assess trend alignment, momentum, and structural bias.
Common references such as the 50-period and 200-period averages are included because they are widely observed by market participants. Crossovers between these averages (often referred to as golden or death crosses) are displayed as structural information only and should not be interpreted as trading signals.
The purpose of this tool is to help traders understand market structure and trend context, not to generate entries or exits.
This indicator is intended for educational and analytical purposes and should be used alongside price action and broader market analysis.

Multiple Colored Moving AveragesMULTIPLE COLORED MOVING AVERAGES - USER GUIDE
DISCLAIMER
----------
Both the code and this documentation were created heavily using artificial intelligence. I'm lazy...
This indicator was inspired by repo32's "Moving Average Colored EMA/SMA" indicator. *
What is this indicator?
-----------------------
This is a TradingView indicator that displays up to 4 different moving averages on your chart simultaneously. Each moving average can be customized with different calculation methods, colors, and filtering options.
Why would I use multiple moving averages?
-----------------------------------------
- See trend direction across different timeframes at once
- Identify support and resistance levels
- Spot crossover signals between fast and slow MAs
- Reduce false signals with filtering options
- Compare how different MA types react to price action
What moving average types are available?
----------------------------------------
11 different types:
- SMA: Simple average, equal weight to all periods
- EMA: Exponential, more weight to recent prices
- WMA: Weighted, linear weighting toward recent data
- RMA: Running average, smooth like EMA
- DEMA: Double exponential, reduced lag
- TEMA: Triple exponential, even less lag
- HMA: Hull, fast and smooth combination
- VWMA: Volume weighted, includes volume data
- LSMA: Least squares, based on linear regression
- TMA: Triangular, double-smoothed
- ZLEMA: Zero lag exponential, compensated for lag
How do I set up the indicator?
------------------------------
Each MA has these settings:
- Enable/Disable: Turn each MA on or off
- Type: Choose from the 11 calculation methods
- Length: Number of periods (21, 50, 100, 200 are common)
- Smoothing: 0-10 levels of extra smoothing
- Noise Filter: 0-5% to ignore small changes
- Colors: Bullish (rising) and bearish (falling) colors
- Line Width: 1-5 pixels thickness
What does the smoothing feature do?
-----------------------------------
Smoothing applies extra calculations to make the moving average line smoother. Higher levels reduce noise but make the MA respond slower to price changes. Use higher smoothing in choppy markets, lower smoothing in trending markets.
What is the noise filter?
--------------------------
The noise filter ignores small percentage changes in the moving average. For example, a 0.3% filter will ignore any MA movement smaller than 0.3%. This helps eliminate false signals from minor price fluctuations.
When should I use this indicator?
---------------------------------
- Trend analysis: See if market is going up, down, or sideways
- Entry timing: Look for price bounces off MA levels
- Exit signals: Watch for MA slope changes or crossovers
- Support/resistance: MAs often act as dynamic levels
- Multi-timeframe analysis: Use different lengths for different perspectives
What are some good settings to start with?
-------------------------------------------
Conservative approach:
- MA 1: EMA 21 (short-term trend)
- MA 2: SMA 50 (medium-term trend)
- MA 3: SMA 200 (long-term trend)
- Low noise filtering (0.1-0.3%)
Active trading:
- MA 1: HMA 9 (very responsive)
- MA 2: EMA 21 (short-term)
- MA 3: EMA 50 (medium-term)
- Minimal or no smoothing
How do I interpret the colors?
------------------------------
Each MA changes color based on its direction:
- Bullish color: MA is rising (upward trend)
- Bearish color: MA is falling (downward trend)
- Gray: MA is flat or unchanged
What should I look for in crossovers?
-------------------------------------
- Golden Cross: Fast MA crosses above slow MA (bullish signal)
- Death Cross: Fast MA crosses below slow MA (bearish signal)
- Multiple crossovers in same direction can confirm trend changes
- Wait for clear separation between MAs after crossover
How do I use MAs for support and resistance?
---------------------------------------------
- In uptrends: MAs often provide support when price pulls back
- In downtrends: MAs may act as resistance on rallies
- Multiple MAs create support/resistance zones
- Stronger levels where multiple MAs cluster together
Can I use this with other indicators?
-------------------------------------
Yes, it works well with:
- Volume indicators for confirmation
- RSI or MACD for timing entries
- Bollinger Bands for volatility context
- Price action patterns for setup confirmation
What if I get too many signals?
-------------------------------
- Increase smoothing levels
- Raise noise filter percentages
- Use longer MA periods
- Focus on major crossovers only
- Wait for multiple MA confirmation
What if signals are too slow?
-----------------------------
- Reduce smoothing to 0
- Lower noise filter values
- Switch to faster MA types (HMA, ZLEMA, DEMA)
- Use shorter periods
- Focus on the fastest MA only
Which MA types work best in different markets?
----------------------------------------------
Trending markets: EMA, DEMA, TEMA (responsive to trends)
Choppy markets: SMA, TMA, HMA with smoothing (less whipsaws)
High volatility: Use higher smoothing and noise filtering
Low volatility: Use minimal filtering for better responsiveness
Do I need all the advanced features?
------------------------------------
No. Start with basic settings:
- Choose MA type and length
- Set colors you prefer
- Leave smoothing at 0
- Leave noise filter at 0
Add complexity only if needed to improve signal quality.
How do I know if my settings are working?
-----------------------------------------
- Backtest on historical data
- Paper trade the signals first
- Adjust based on market conditions
- Keep a trading journal to track performance
- Be willing to modify settings as markets change
Can I save different configurations?
------------------------------------
Yes, save different indicator templates in TradingView for:
- Different trading styles (scalping, swing trading)
- Different market conditions (trending, ranging)
- Different instruments (stocks, forex, crypto)

Adaptive Fibonacci Trend Ribbon[FibonacciFlux]Adaptive Fibonacci Trend Ribbon (FibonacciFlux)
Overview
The Adaptive Fibonacci Trend Ribbon is a versatile technical analysis tool designed for traders who want to leverage the power of multiple moving averages while integrating Fibonacci numbers. This indicator provides a dynamic visual representation of market trends, enhancing decision-making processes in trading.
Key Features
1. Multi-Moving Averages
- The indicator calculates eight different moving averages based on user-defined periods, including Fibonacci numbers such as 5, 8, 13, 21, 34, 55, 89, and 144.
- Traders can choose from various moving average types, including EMA, HMA, WMA, VWMA, ALMA, SMA, RMA, and TMA , allowing for tailored analysis based on market conditions.
2. Trend Detection
- Each moving average is color-coded based on its trend direction, with green indicating an upward trend and red indicating a downward trend.
- This visual clarity helps traders quickly assess market sentiment and make informed decisions.
3. Fill Areas for Enhanced Insight
- The indicator features fill areas between the moving averages, which dynamically change color according to their relative positions.
- This provides a clear visual cue of trend strength and potential reversal points, allowing traders to identify key areas of interest.
4. Customizable Inputs
- Users can easily adjust the source data, moving average lengths, and ALMA parameters (offset and sigma) to fit their trading strategies.
- This flexibility ensures that traders can adapt the tool to various market conditions and personal preferences.
Insights and Applications
1. Fibonacci Integration
- By incorporating Fibonacci numbers into the moving average periods, this indicator allows traders to align their strategies with key levels of support and resistance.
- This can enhance the accuracy of entry and exit points, particularly in trending markets.
2. Trend Continuation and Reversal Analysis
- The adaptive nature of the moving averages provides insights into potential trend continuations or reversals.
- Traders can use the indicator to identify when to enter or exit positions based on the interaction between the moving averages.
3. Visual Clarity for Quick Decisions
- The color-coded moving averages and fill areas offer immediate visual feedback on market conditions, helping traders react swiftly to changing dynamics.
- This is especially useful in fast-moving markets where timely decisions are critical.
Conclusion
The Adaptive Fibonacci Trend Ribbon is an essential tool for traders looking to enhance their technical analysis capabilities. By combining multiple moving averages with Fibonacci integration and dynamic visual cues, this indicator offers a robust framework for understanding market trends. Its flexibility and clarity make it an invaluable asset for both novice and experienced traders alike.
Open Source Contribution
This indicator is open source, inviting contributions and improvements from the trading community. Feel free to fork, enhance, and share your insights with the world, helping to foster a collaborative environment for traders everywhere.

Moving Average Lab - by InFinitoThe Moving Average Lab allows to create any possible combination of up to 3 given MAs. It is meant to help you find the perfect MA that fits your style, strategy and market type.
This script allows to average, weight, double and triple multiple types and lengths of Moving Averages
Currently supported MA types are:
SMA
EMA
VWMA
WMA
SMMA (RMA)
HMA
LSMA
DEMA
TEMA
Features:
- Double or Triple any type of Moving Average using the same logic used for calculating DEMAs and TEMAs:
In the following example you can see a normal, double and triple 200 VWMA
- Average 2 or 3 different types and lengths of Moving Average:
In the example you can see the average between a Double LSMA and a SMA
- Weight each MA manually:
The example shows the average of an HMA and a VWMA with the HMA having a weight of 2 and the VWMA having a weight of 1
- Average up to 3 personalized MAs:
The example shows the average of an EMA + a Double WMA + a Triple SMA with a 3:2:1 weighting
- Average different Moving Averages with different length each:
The example shows the average of an 800 SMA + a 400 VWMA + a 200 EMA

Keltner Channels Bands (RMA)Keltner Channel Bands
These normally consist of:
Keltner Channel Upper Band = EMA + Multiplier ∗ ATR
Keltner Channel Lower Band = EMA − Multiplier ∗ ATR
However instead of using ATR we are using RMA
This gives us a much smoother take of the KCB
We are also using 2 sets of bands built on 1 Moving average, this is a common set up for mean reversion strategies.
This can often be paired with RSI for lower timeframe divergences
Divergence
This is using the RSI to calculate when price sets new lows/highs whilst the RSI movement is in the opposite direction.
The way this is calculated is slightly different to traditional divergence scripts. instead of looking for pivot highs/lows in the RSI we are logging the RSI value when price makes it pivot highs/lows.
Gradient Bands
The Gradient Colouring on the bands is measuring how long price has been either side of the MA.
As Keltner bands are commonly used as a mean reversion strategy, I thought it would be useful to see how long price has been trending in a certain direction, the stronger the colours get,
the longer price has been trending that direction which could suggest we are looking for a retrace soon.
Alerts
Alerts included let you choose whether you want to receive an alert for the inside, outside or both band touches.
To set up these alerts, simply toggle them on in the settings, then click on the 3 dots next to the indicators name, from there you click 'Add Alert'.
From there you can customise the alert settings but make sure to leave the 2 top boxes which control the alert conditions. They will be default selected onto your correct settings, the rest you may want to change.
Once you create the alert, it will then trigger as soon as price touches your chosen inside/outside band.
Suggestions
Please feel free to offer any suggestions which you think could improve the script
Disclaimer
The default settings/parameters were shared by Jimtalbott, feel free to play about with the and use this code to make your own strategies.

Combined Moving Averages + Squeeze & Volume Spike SignalsThis is a set of 4 combined moving averages. Each moving average is a combination of an EMA, SMA, HMA, RMA, WMA and VWMA with the same length as set in your input settings. All 6 of them are added together and then divided by 6 for an average of all of them. This is based on the theory that most traders use their own preference of moving averages, so combining them all should give us a better idea of where price should actually react since we are using the average of what most traders are using on their charts. It also smooths the moving averages out as well so you get a much easier to read moving average than any of them on their own which should help you hold positions longer and time your entries better.
The default lengths used for this indicator are as follows: 10, 50, 100 and 500. These lengths can be updated in the settings. The 10 and 500 will change colors when the individual moving average is less than or greater than its previous value. Price above or below the moving average does not affect the colors. The 50 and 100 are colored based on whether the 50 is greater/less than the 100.
The two middle length moving averages by default are the 50 and 100. This has been turned into a cloud because it is the area where price typically bounces, since tons of traders use the 50 and 100 moving averages. This should be your long/short zone when price is trending.
Each moving average can be set to use a different source such as close, open, high, low, ohlc4, etc. You can also adjust the length of each moving average. Default settings work well, but feel free to customize them to your liking. You can also change the colors of the lines in the settings.
Beware that changing the lengths of MA #2 and MA #3 will change the signals, squeezes and the cloud.
VOLUME SPIKES
The cloud will change to a brighter color when a volume spike is detected. When a major volume spike is detected, it will turn very bright colored green/red according to the direction of the cloud. This notifies you of volume spikes so you have a better idea of how strong the trend is. If the cloud is a dark green/red then that means that volume is less than or equal to the recent median volume.
SIGNALS
There are also signals that will be given when the current candle is in the cloud, the candle is going in the same direction as the cloud, the MA #2 and MA #3 is going in the same direction and a volume spike is detected. These help you identify good entries when markets are trending. Be cautious of these signals when the trend is sideways and not clearly moving in one direction. The signals can be turned on or off in the settings.
SQUEEZE
Many times when moving averages squeeze together, a big move happens shortly after. Because of this I added a yellow background color when a squeeze is detected. It looks at the median value difference of the MA #2 and MA #3 and if the current value difference is less than the median multiplied by the multiplier in the settings then it will change the background color to notify you. The default value of the multiplier is .6, meaning the squeeze signal will only show if the current value difference of the cloud is less than .6 of the median difference. The multiplier can be adjusted in the settings to suit your preferences. Lower values will only show tighter squeezes.
MARKETS
This indicator can be used on all markets including stocks, crypto, futures and forex.
TIMEFRAMES
This indicator can be used on all timeframes.
PAIRINGS
We recommend pairing this combined moving average with Trend Friend Swing Trade And Scalp Signals for extra confluence. Look for price to bounce in the cloud with good volume and a confirming signal from Trend Friend for highly probable moves.
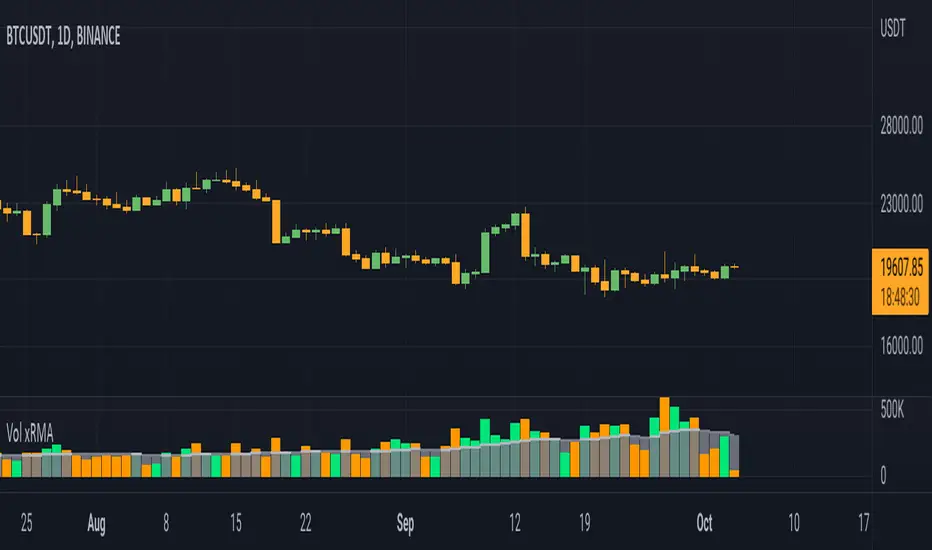
Volume xRMAInspired from Volume xSMA.
Few changes from Volume xSMA
1. MA changed from SMA to RMA (better smoothness and filtering)
2. xRMA plot modified to cloumn and stepline combined (for better visibility)
3. Color pallete changed (personal liking)
Thanks for the support.
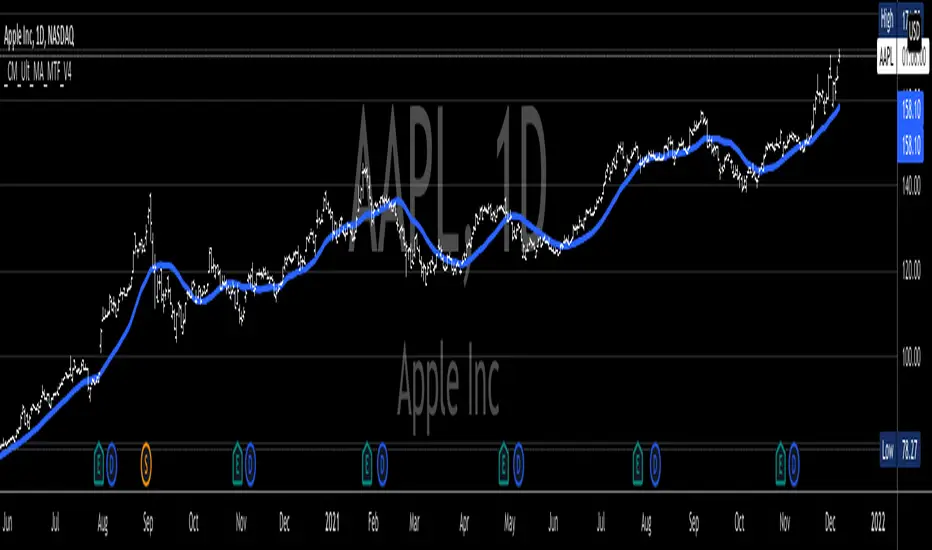
_CM_Ultimate_MA_MTF_V4***For a Detailed Video Overview Showing all of the Settings...
Click HERE to View Video
New _CM_Ultimate_MA_MTF_V4 - Update - 08-24-2021
Thanks to @SKTennis for help with code
Added Ability to Plot 1 or 2 Moving Averages - Fast MA & Slow MA
Added Ability to Plot Fast MA with Multi TimeFrame
Added Ability to Plot Slow MA with Multi TimeFrame
Added Ability to Color Fast MA Based on Slope of MA
Added Ability to Color Fast MA based on being Above/Below Slow MA
Added Ability to Plot 8 Types of Moving Averages
Simple, Exponential, Weighted, Hull, VWMA, RMA, TEMA, & Tilson T3
Added Ability to Set Alerts Based on:
Slope Change in the Fast MA Or Fast MA Crossing Above/Below Slow MA.
Added Ability to Plot "Fill" if Both Moving Averages are Turned ON
Added Ability to control Transparency of Fill
Added Alerts to Settings Pane.
Customized how Alerts work. Must keep Checked in Settings Pane, and When you go to Alerts Panel, Change Symbol to Indicator (_CM_Ultimate_MA_MTF_V4)
Customized Alerts to Show Symbol, TimeFrame, Closing Price, & Moving Average Signal Name in Alert
Alerts are Pre-Set to only Alert on Bar Close
See Video for Detailed Overview
New Updates Coming Soon!!!
***Please Post Feedback and Any Feature Requests in the Comments Section Below***
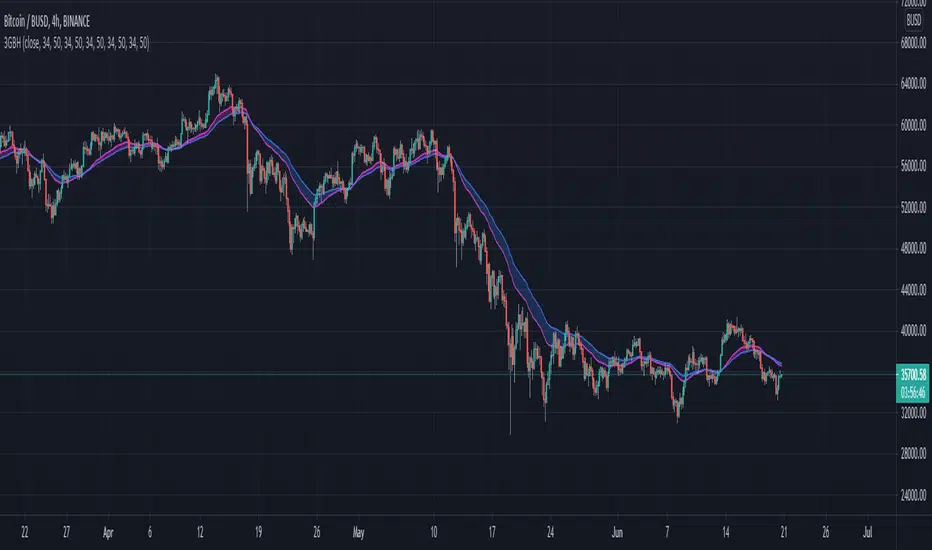
3GBH - Multiple MA'sIncluded in this indicator:
- Fast/Slow EMA's
- Fast/Slow SMA's
- Fast/Slow WMA's
- Fast/Slow HMA's
- Fast/Slow RMA's
-----
Use of of the type of Moving Averages.
Or use them all.
-----
User-friendly.
You can change all the inputs, they are labelled for ease-of-use.
You can toggle On/Off any or all of the options.
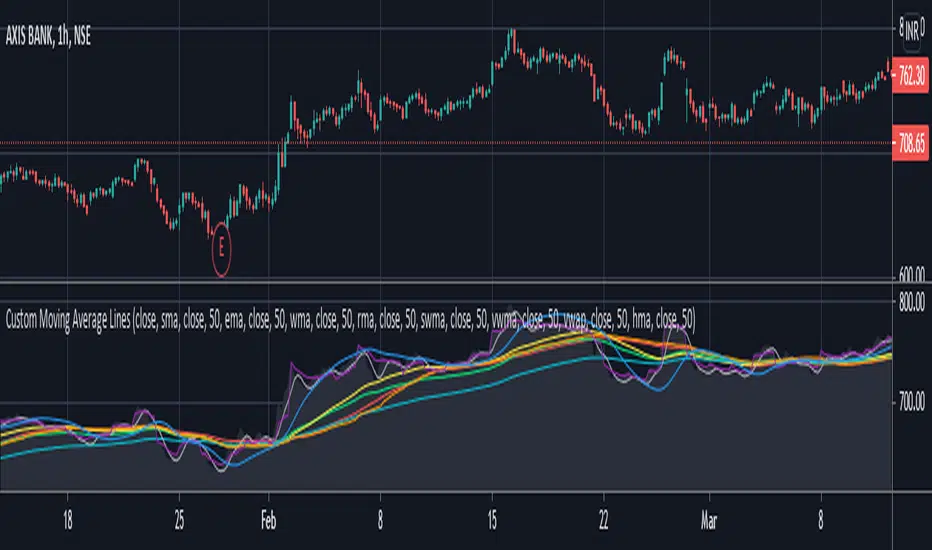
Custom Moving Average LinesHeylo!
This is a script for basic market trend analysis using moving average lines. It features eight lines with eight choices of moving averages and adjustable sources & time periods . The choice of moving averages are stated below:
1. Simple Moving Average (sma)
2. Exponential Moving Average (ema)
3. Weighted Moving Average (wma)
4. Relative Moving Average (rma)
5. Hull Moving Average (hma)
6. Sine-Weighted Moving Average (swma)
7. Volume Weighted Moving Average (vwma)
8. Volume Weighted Average Price (vwap)
Planning on including other formula based indicators soon. Let me know if there can be some improvements made / errors so I can fix it.
Cheers!
Customizable MA RibbonAll credits to @Violent (www.tradingview.com) for making the original code! I just updated it by adding new features and themes!
---------------------------------------------
Lemon's Customizable MA Ribbon:
---------------------------------------------
A series of moving averages of different lengths that create a ribbon-like indicator. Traders can determine trend strength by lookin at the distance between the moving averages and the overall balance of the colored lines. Price movements through the ribbon can also be used to identify trend changes.
------------
FEATURES
------------
MA TYPES: SMA , EMA , WMA, RMA, ALMA, VWMA, HMA
Editable length
Editable start
User defined number of plots to show (between 1 to 32 total plots)
Multiple color theme choices
A color smoothing option.
Thank you and happy trading!
with love,
-Lemon

LV Support&Resistancegives rough predictions on support and resistance levels by using rma and fibo numbers.
white color is the original rma250 value.
(Note: it is more easy to see them on logarithmic scale)

Customisable Moving Averages x5This is a Moving Averages pack with 5 lines.
This indicator is different from others because with it you can select the MA type used in calculations for each line.
Available MA types are (currently):
SMA
EMA
WMA
VWMA
RMA
HMA
Also configurable (for each line) are data source (open, close, hlc3, etc) and period.
MA, MATR, ChEx | All in One - 4CR CUPIn trade position setup, we always need to determine the market structure and manage the position sizing in a short period of decision time. Indicators such as moving average, initial stop loss and trailing stop loss are always helpful.
This indicator put all these handy tools into a single toolkit, which includes the following price action and risk management indicators:
MA - Moving Average
MATR - Moving Average less Average True Range
ChEx - Chandelier Exit
This script further enhances the setting so that you can easily customize the indicators.
For both the Moving Averages and the Moving Average less Average True Range , you can pick a type of moving average which suits your analysis style from a list of commonly used moving average formulations: namely, EMA , HMA , RMA, SMA and WMA , where EMA is selected as default.
The Moving Average less Average True Range , MATR, is usually applied as a reference to set the initial stop loss whenever opening a new position.
The abbreviation, MATR, is picked, so that this can serve as a handy reminder of a very good trading framework as elaborates as below:
M – Market Structure
A – Area of Value
T – Trigger
R – Risk Management (aka. Exit Strategy)

Multi Timeframe Moving Average [xdecow]This indicator plots a moving average of 4 different timeframes.
The types of averages available are: SMA, EMA, DEMA, VWMA, RMA, WMA.

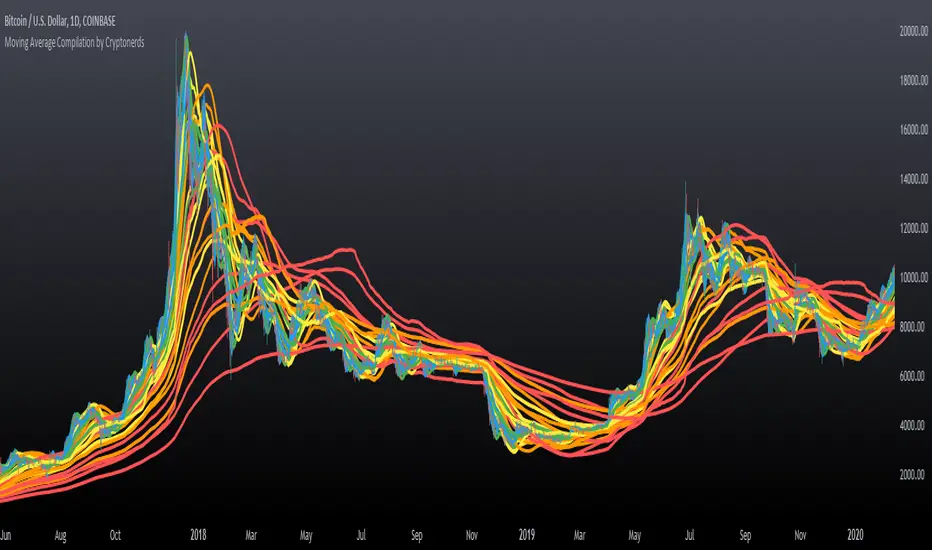
Moving Average Compilation by CryptonerdsThis script contains all commonly used types of moving averages in a single script. To our surprise, it turned out that there was no script available yet that contains multiple types of moving averages.
The following types of moving averages are included:
Simple Moving Averages (SMA)
Exponential Moving Averages (EMA)
Double Exponential Moving Averages (DEMA)
Display Triple Exponential Moving Averages (TEMA)
Display Weighted Moving Averages (WMA)
Display Hull Moving Averages (HMA)
Wilder's exponential moving averages (RMA)
Volume-Weighted Moving Averages (VWMA)
The user can configure what type of moving averages are displayed, including the length and up to five multiple moving averages per type. If you have any other request related to adding moving averages, please leave a comment in the section below.
If you've learned something new and found value, leave us a message to show your support!
MA Cross - Multi-Timeframe The MA cross is probably one of my favourite strategies because of its simplicity but it often gets overlooked for more complex strategies.
The original author of this script is ChartArt, I have just added some extra controls and functions which are outlined below. I would just like to add that this is my first published script, everything I have learned about coding has been from studying and tinkering with many of the publicly available scripts on TV so I would like thank all the authors who give out this knowledge so freely!
Updates
- Converted to v4
- Made some graphical changes and provided more control over plots
- Added RMA and VWMA
- Added alerts
Original script can be found here