zuperviewResourcesLibrary "zuperview"
ComputeMAValue(maType, series, period)
ComputeMAValue
@description Computes the moving average (MA) value based on the specified MA type.
Parameters:
maType (string) : (string) The type of moving average: "EMA", "SMA", "RMA", "WMA", "HMA", "VWMA", "LinReg".
series (float) : (float) The input price series (typically close).
period (simple int) : (int) The number of periods used for MA calculation.
Returns: (float) The computed MA value or `na` if maType is invalid.
ComputeATRValue(period)
ComputeATRValue
@description Computes the moving average (ATR) value based on the specified ATR type.
Parameters:
period (int) : (int) The number of periods used for MA calculation.
Returns: (float) The computed ATR value or `na` if maType is invalid.
Max(src, period)
Parameters:
src (float)
period (int)
Min(src, period)
Parameters:
src (float)
period (int)
ComputeRSIValue(src, period, smooth)
ComputeRSIValue
@description Computes the moving average (RSI) value based on the specified RSI type.
Parameters:
src (float) : (series) Input series (series float), which can be close (`close`), open (`open`), high (`high`), low (`low`), or any other price-based series.
period (int) : (int) The number of periods used for MA calculation.
smooth (int)
Returns: (float) The computed RSI value or `na` if maType is invalid.
ComputeSMMAValue(src, period)
ComputeSMMAValue
@description Computes the moving average (SMMA) value based on the specified SMMA type.
Parameters:
src (float) : (series) Input series (series float), which can be close (`close`), open (`open`), high (`high`), low (`low`), or any other price-based series.
period (int) : (int) The number of periods used for MA calculation.
Returns: (float) The computed SMMA value or `na` if maType is invalid.
ComputeStochasticValue(src, periodD, periodK, smoothingMethod, smoothingPeriod)
ComputeStochasticValue
@description Computes the moving average (SMMA) value based on the specified SMMA type.
Parameters:
src (float) : (series) Input series (series float), which can be close (`close`), open (`open`), high (`high`), low (`low`), or any other price-based series.
periodD (simple int) : (int) The number of periods used for MA calculation.
periodK (int) : (int) The number of periods used for MA calculation.
smoothingMethod (string) : (string) The type of moving average: "EMA", "SMA", "RMA", "WMA", "HMA", "VWMA", "LinReg".
smoothingPeriod (simple int) : (int) The number of periods used for MA calculation.
Returns: (float) The computed Stochastic(K, D) value or `na` if maType is invalid.
FindSwingsByNeighborhood(arraySwingTop, arraySwingBottom, neighborhood)
Find Swings By Neighborhood
@description Computes the moving average (SMMA) value based on the specified SMMA type.
Parameters:
arraySwingTop (array) : (array): An array to store detected swing highs.
arraySwingBottom (array) : (array): An array to store detected swing lows.
neighborhood (int) : (int): The number of bars to consider when identifying a swing point.
Returns: none
FindSwingsByOffset(arraySwingTop, arraySwingBottom, minSwingLength)
Find Swings By Offset
@description Identifies swing points based on a minimum swing length criteria.
Parameters:
arraySwingTop (array) : (array): An array to store detected swing highs.
arraySwingBottom (array) : (array): An array to store detected swing lows.
minSwingLength (float) : (float): The minimum price movement required to qualify as a swing point.
Returns: none
SwingPoint
Fields:
Key (series int)
IsTop (series bool)
Price (series float)
BarStart (series int)
BarEnd (series int)
TimeStart (series int)
TimeEnd (series int)
Sign (series int)
Label (series label)
Search in scripts for "rma"

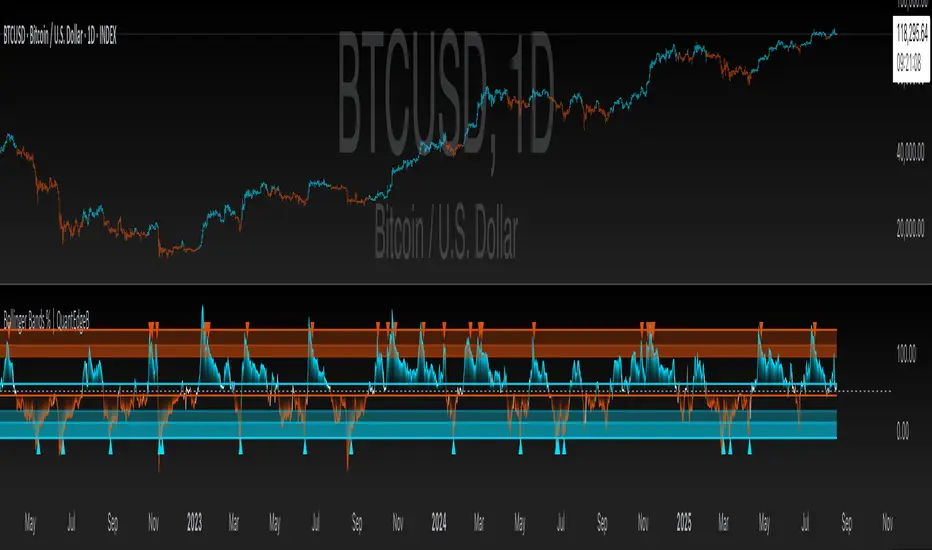
Bollinger Bands % | QuantEdgeB📊 Introducing Bollinger Bands % (BB%) by QuantEdgeB
🛠️ Overview
BB% | QuantEdgeB is a volatility-aware momentum tool that maps price within a Bollinger envelope onto a normalized scale. By letting you choose the base moving average (SMA, EMA, DEMA, TEMA, HMA, ALMA, EHMA, THMA, RMA, WMA, VWMA, T3, LSMA) and even Heikin-Ashi sources, it adapts to your style while keeping readings consistent across symbols and timeframes. Clear thresholds and color-coded visuals make it easy to spot emerging strength, fading moves, and potential mean-reversions.
✨ Key Features
• 🔹 Flexible Baseline
Pick from 12 MA types (plus Heikin-Ashi source option) to tailor responsiveness and smoothness.
• 🔹 Normalized Positioning
Price is expressed as a percentage of the band range, yielding an intuitive 0–100 style read (can exceed in extreme trends).
• 🔹 Actionable Thresholds
Default Long 55 / Short 45 levels provide simple, objective triggers.
• 🔹 Visual Clarity
Color-coded candles, shaded OB/OS zones, and adaptive color themes speed up decision-making.
• 🔹 Ready-to-Alert
Built-in alerts for long/short transitions.
📐 How It Works
1️⃣ Band Construction
A moving average (your choice) defines the midline; volatility (standard deviation) builds upper/lower bands.
2️⃣ Normalization
The indicator measures where price sits between the lower and upper band, scaling that into a bounded oscillator (BB%).
3️⃣ Signal Logic
• ✅ Long when BB% rises above 55 (strength toward the top of the envelope).
• ❌ Short when BB% falls below 45 (weakness toward the bottom).
4️⃣ OB/OS Context
Shaded regions above/below typical ranges highlight exhaustion and potential snap-backs.
⚙️ Custom Settings
• Base MA Type: SMA, EMA, DEMA, TEMA, HMA, ALMA, EHMA, THMA, RMA, WMA, VWMA, T3, LSMA
• Source Mode: Classic price or Heikin-Ashi (close/open/high/hlc3)
• Base Length: default 40
• Band Width: standard deviation-based (2× SD by default)
• Long / Short Thresholds: defaults 55 / 45
• Color Mode: Alpha, MultiEdge, TradingSuite, Premium, Fundamental, Classic, Warm, Cold, Strategy
• Candles & Labels: optional candle coloring and signal markers
👥 Ideal For
✅ Trend Followers — Ride strength as price compresses near the upper band.
✅ Swing/Mean-Reversion Traders — Fade extremes when BB% stretches into OB/OS zones.
✅ Multi-Timeframe Analysts — Compare band position consistently across periods.
✅ System Builders — Use BB% as a normalized feature for strategies and filters.
📌 Conclusion
BB% | QuantEdgeB delivers a clean, normalized read of price versus its volatility envelope—adaptable via rich MA/source options and easy to automate with thresholds and alerts.
🔹 Key Takeaways:
1️⃣ Normalized view of price inside the volatility bands
2️⃣ Flexible baseline (12+ MA choices) and Heikin-Ashi support
3️⃣ Straightforward 55/45 triggers with clear visual context
📌 Disclaimer: Past performance is not indicative of future results. No strategy guarantees success.
📌 Strategic Advice: Always backtest, tune parameters, and align with your risk profile before live trading.
Fabian Z-ScoreFabian Z-Score — % Distance & Z-Scores for SPX / DJI / XLU
What it does
This indicator measures how far three market proxies are from a moving average and standardizes those distances into z-scores so you can spot stretch/mean-reversion and relative out/under-performance.
Universe: S&P 500 (SPX), Dow Jones (DJI) and Utilities (XLU). You can change any of these in Inputs.
Anchor MA: user-selectable MA type (SMA/EMA/RMA/WMA/VWMA/HMA/LSMA/ALMA) and length (default 39; a popular weekly anchor).
Outputs
% from MA: 100 × (𝐶𝑙𝑜𝑠𝑒 − 𝑀𝐴) / 𝑀𝐴
Time-series Z: z-score of the last N % distances (default 39) → “how stretched vs its own history?”
Cross-sectional Z: z-score of each % distance within the trio on this bar → “who’s strongest vs the others right now?”
A compact mini table (top-right) shows the latest values for each symbol: % from MA, Z(ts) and Z(xsec).
Panels & Visualization
Toggle what you want to see in View:
Plot % distance — raw % above/below the MA (0% line shown).
Plot time-series Z — standardized stretch with ±Threshold guides (default ±2σ).
Plot cross-sectional Z — relative z across SPX, DJI, XLU (0 = at the trio’s mean).
Smoothing — optional light MA on the plotted series (set to 1 for none).
A price-panel Moving Average is drawn with your chosen type/length for visual context.
Colors: SPX = teal, DJI = orange, XLU = purple.
Alerts
Two built-in alert conditions (time-series Z only):
“Z(ts) crosses up +Thr” — any of the three crosses above +Threshold.
“Z(ts) crosses down -Thr” — any crosses below −Threshold.
When enabled, the chart background tints faint green (up cross) or red (down cross) on those bars.
How to use (ideas, not advice)
On weekly charts, a 39-length MA/Z lookback often captures major risk-on/off swings. (Fabian Timing)
Deep negative Z(ts) (e.g., ≤ −2σ or −3σ) frequently accompanies panic and mean-reversion setups.
High positive Z(ts) suggests over-extension; watch for momentum fades.
Cross-sectional Z helps rank leadership today:
Z(xsec) > 0 → stronger than the trio’s mean this bar; Z(xsec) < 0 → weaker.
Utilities (XLU) turning positive x-sec while the others are negative can hint at defensive rotation.
If all 3 are above 0, go long, if below 0 go cash.
Combine: look for extreme Z(ts) aligning with lead/lag Z(xsec) to time entries/exits or hedges.
Inputs (quick reference)
Symbols: SPX / DJI / XLU (editable).
MA type & length: SMA, EMA, RMA, WMA, VWMA, HMA, LSMA, ALMA; default EMA(39).
Z-score lookback (ts): default 39.
Smoothing on plots: default 1 (off).
Z threshold (±): default 2.0 (guide lines & alerts).

ADR/ATR Session No Probability Table by LKHere you go—clear, English docs you can drop into your script’s description or share with teammates.
ADR/ATR Session by LK — Overview
This indicator summarizes Average Daily Range (ADR) and Average True Range (ATR) for two horizons:
• Session H4 (e.g., 06:00–13:00 on a 4‑hour chart)
• Daily (D)
It shows:
• Current ADR/ATR values (using your chosen smoothing method)
• How much of ADR/ATR today/this bar has already been consumed (% of ADR/ATR)
• ADR/ATR as a percent of price
• Optional probability blocks: likelihood that %ADR will exceed user‑defined thresholds over a lookback window
• Optional on‑chart lines for the current H4 and Daily candles: Open, ADR High, ADR Low
⸻
What the metrics mean
• ADR (H4 / D): Moving average of the bar range (high - low).
• ATR (H4 / D): Moving average of True Range (max(hi-lo, |hi-close |, |lo-close |)).
• % of ADR (curr H4): (H4 range of the current H4 bar) / ADR(H4) × 100. Updates live even if the current time is outside the session.
• % of ADR (Daily): (today’s intra‑day range) / ADR(D) × 100.
• % of ATR (curr H4 / Daily): TR / ATR × 100 for that horizon.
• ADR % of Price / ATR % of Price: ADR or ATR divided by current price × 100 (a quick “volatility vs. price” gauge).
Session logic (H4): ADR/ATR(H4) only update on bars that fall inside the configured session window; outside the window the values hold steady (no recalculation “bleed”).
Daily range tracking: The indicator tracks today’s high/low in real‑time and resets at the day change.
⸻
Inputs (quick reference)
Core
• Length (ADR/ATR): smoothing length for ADR/ATR (default 21).
• Wait for Higher TF Bar Close: if true, updates ADR/ATR only after the higher‑TF bar closes when using request.security.
Timeframes
• Session Timeframe (H4): default 240.
• Daily Timeframe: default D.
Session time
• Session Timezone: “Chart” (default) or a fixed timezone.
• Session Start Hour, End Hour (minutes are fixed to 0 in this version).
Smoothing methods
• H4 ADR Method / H4 ATR Method: SMA/EMA/RMA/WMA.
• Daily ADR Method / Daily ATR Method: SMA/EMA/RMA/WMA.
Table appearance
• Table BG, Table Text, Table Font Size.
Lines (optional)
• Show current H4 segments, Show current Daily segments
• Line colors for Open / ADR High / ADR Low
• Line width
Probability
• H4 Probability Lookback (bars): number of H4 bars to examine (e.g., 300).
• Daily Probability Lookback (days): number of D bars (e.g., 180).
• ADR thresholds (%): CSV list of thresholds (e.g., 25,50,55,60,65,70,75,80,85,90,95,100,125,150).
The table will show the % of lookback bars where %ADR ≥ threshold.
Tip: If you want probabilities only for session H4 bars (not every H4 bar), ask and I can add a toggle to filter by inSess.
⸻
How to read the table
H4 block
• ADR (method) / ATR (method): the session‑aware averages.
• % of ADR (curr H4): live progress of this H4 bar toward the session ADR.
• ADR % of Price: ADR(H4) relative to price.
• % of ATR (curr H4) and ATR % of Price: same idea for ATR.
H4 Probability (lookback N bars)
• Rows like “≥ 80% ADR” show the fraction (in %) of the last N H4 bars that reached at least 80% of ADR(H4).
Daily block
• Mirrors the H4 block, but for Daily.
Daily Probability (lookback M days)
• Rows like “≥ 100% ADR” show the fraction of the last M daily bars whose daily range reached at least 100% of ADR(D).
⸻
Practical usage
• Use % of ADR (curr H4 / Daily) to judge exhaustion or room left in the day/session.
E.g., if Daily %ADR is already 95%, be cautious with momentum continuation trades.
• The probability tables give a quick historical context:
If “≥ 125% ADR” is ~18%, the market rarely stretches that far; your trade sizing/targets can reflect that.
• ADR/ATR % of Price helps normalize volatility between instruments.
⸻
Troubleshooting
• If probability rows are blank: ensure lookback windows are large enough (and that the chart has enough history).
• If ADR/ATR show … (NA): usually you don’t have enough bars for the chosen length/TF yet.
• If line segments are missing: verify you’re on a chart with visible current H4/D bars and the toggles are enabled.
⸻
Notes & customization ideas
• Add a toggle to count only session bars in H4 probability.
• Add separate thresholds for H4 vs Daily.
• Let users pick minutes for session start/end if needed.
• Add alerts when %ADR crosses specified thresholds.
If you want me to bundle any of the “ideas” above into the code, say the word and I’ll ship a clean patch.

ADR/ATR Session by LK## **Features**
1. **Custom ADR & ATR Calculation**
* Calculates **Average Daily Range (ADR)** and **Average True Range (ATR)** separately for:
* **Session timeframe** (default H4 / 06:00–13:00)
* **Daily timeframe**
* Independent smoothing method selection (**SMA, EMA, RMA, WMA**) for H4 ADR, H4 ATR, Daily ADR, and Daily ATR.
2. **Percentage Metrics**
* % of ADR / ATR covered by the **current H4 bar**.
* ADR / ATR expressed as a percentage of the **current price**.
* % of ADR already reached for the **current day**.
* % of Daily ATR vs current day’s True Range.
3. **Dynamic Chart Lines**
* Draws **3 lines for H4**: Session Open, ADR High, ADR Low.
* Draws **3 lines for Daily**: Daily Open, ADR High, ADR Low.
* Lines **extend to the right** so they stay visible across the chart.
* Colors and widths are fully customizable.
4. **Real-Time Data Table**
* Compact table displaying all ADR/ATR values and percentages.
* Adjustable table font size (**tiny, small, normal, large, huge**).
* Transparent background option for minimal chart obstruction.
5. **Flexible Session Settings**
* Select session start and end time in hours/minutes.
* Choose session timezone (chart timezone or major financial centers).
* Toggle H4 lines, Daily lines separately.
6. **Lookahead Control**
* Option to wait for higher-timeframe candle close before updating values (more accurate, less repainting).
---
## **How to Use**
### **1. Adding the Indicator**
* Copy and paste the Pine Script into TradingView’s Pine Editor.
* Click **“Add to chart”**.
* Make sure your chart supports the higher timeframes you choose (e.g., H4 and Daily).
### **2. Setting Your Session**
* **Session Start Hour** & **End Hour** → Defines the intraday session to measure ADR/ATR (default: 06:00–13:00).
* **Session Timezone** → Pick “Chart” or a major financial center (e.g., New York, London, Tokyo).
### **3. Choosing Smoothing Methods**
* For each ADR/ATR (H4 and Daily), choose:
* SMA (Simple)
* EMA (Exponential)
* RMA (Wilder’s smoothing)
* WMA (Weighted)
### **4. Adjusting Chart Display**
* **Show H4 Lines** → Displays session open and ADR High/Low for the current H4 session.
* **Show Daily Lines** → Displays daily open and ADR High/Low.
* Customize line colors and widths.
### **5. Reading the Table**
* **H4 Section**
* ADR / ATR values for the selected session.
* % of ADR/ATR covered by the **current H4 bar**.
* ADR/ATR as % of the current price.
* **Daily Section**
* ADR / ATR for the daily timeframe.
* % of ADR already covered by today’s range.
* ADR/ATR as % of price.
### **6. Pro Tips**
* Use **H4 ADR %** to gauge intraday exhaustion — if current range is near 100%, market may slow or reverse.
* Use **Daily ADR %** for swing trade context — if a day has moved beyond its ADR, expect lower continuation probability.
* Combine with support/resistance to identify high-probability reversal zones.

Ratio-Adjusted McClellan Summation Index RASI NASIRatio-Adjusted McClellan Summation Index (RASI NASI)
In Book "The Complete Guide to Market Breadth Indicators" Author Gregory L. Morris states
"It is the author’s opinion that the McClellan indicators, and in particular, the McClellan Summation Index, is the single best breadth indicator available. If you had to pick just one, this would be it."
What It Does: The Ratio-Adjusted McClellan Summation Index (RASI) is a market breadth indicator that tracks the cumulative strength of advancing versus declining issues for a user-selected exchange (NASDAQ, NYSE, or AMEX). Derived from the McClellan Oscillator, it calculates ratio-adjusted net advances, applies 19-day and 39-day EMAs, and sums the oscillator values to produce the RASI. This indicator helps traders assess market health, identify bullish or bearish trends, and detect potential reversals through divergences.
Key features:
Exchange Selection : Choose NASDAQ (USI:ADVN.NQ, USI:DECL.NQ), NYSE (USI:ADVN.NY, USI:DECL.NY), or AMEX (USI:ADVN.AM, USI:DECL.AM) data.
Trend-Based Coloring : RASI line displays user-defined colors (default: black for uptrend, red for downtrend) based on its direction.
Customizable Moving Average: Add a moving average (SMA, EMA, WMA, VWMA, or RMA) with user-defined length and color (default: EMA, 21, green).
Neutral Line at Zero: Marks the neutral level for trend interpretation.
Alerts: Six custom alert conditions for trend changes, MA crosses, and zero-line crosses.
How to Use
Add to Chart: Apply the indicator to any TradingView chart. Ensure access to advancing and declining issues data for the selected exchange.
Select Exchange: Choose NASDAQ, NYSE, or AMEX in the input settings.
Customize Settings: Adjust EMA lengths, RASI colors, MA type, length, and color to match your trading style.
Interpret the Indicator :
RASI Line: Black (default) indicates an uptrend (RASI rising); red indicates a downtrend (RASI falling).
Above Zero: Suggests bullish market breadth (more advancing issues).
Below Zero : Indicates bearish breadth (more declining issues).
MA Crosses: RASI crossing above its MA signals bullish momentum; crossing below signals bearish momentum.
Divergences: Compare RASI with the market index (e.g., NASDAQ Composite) to identify potential reversals.
Large Moves : A +3,600-point move from a low (e.g., -1,550 to +1,950) may signal a significant bull run.
Set Alerts:
Add the indicator to your chart, open the TradingView alert panel, and select from six conditions (see Alerts section).
Configure notifications (e.g., email, webhook, or popup) for each condition.
Settings
Market Selection:
Exchange: Select NASDAQ, NYSE, or AMEX for advancing/declining issues data.
EMA Settings:
19-day EMA Length: Period for the shorter EMA (default: 19).
39-day EMA Length: Period for the longer EMA (default: 39).
RASI Settings:
RASI Uptrend Color: Color for rising RASI (default: black).
RASI Downtrend Color: Color for falling RASI (default: red).
RASI MA Settings:
MA Type: Choose SMA, EMA, WMA, VWMA, or RMA (default: EMA).
MA Length: Set the MA period (default: 21).
MA Color: Color for the MA line (default: green).
Alerts
The indicator uses alertcondition() to create custom alerts. Available conditions:
RASI Trend Up: RASI starts rising (based on RASI > previous RASI, shown as black line).
RASI Trend Down: RASI starts falling (based on RASI ≤ previous RASI, shown as red line).
RASI Above MA: RASI crosses above its moving average.
RASI Below MA: RASI crosses below its moving average.
RASI Bullish: RASI crosses above zero (bullish market breadth).
RASI Bearish: RASI crosses below zero (bearish market breadth).
To set alerts, add the indicator to your chart, open the TradingView alert panel, and select the desired condition.
Notes
Data Requirements: Requires access to advancing/declining issues data (e.g., USI:ADVN.NQ, USI:DECL.NQ for NASDAQ). Some symbols may require a TradingView premium subscription.
Limitations: RASI is a medium- to long-term indicator and may lag in volatile or range-bound markets. Use alongside other technical tools for confirmation.
Data Reliability : Verify the selected exchange’s data accuracy, as inconsistencies can affect results.
Debugging: If no data appears, check symbol validity (e.g., try $ADVN/Q, $DECN/Q for NASDAQ) or contact TradingView support.
Credits
Based on the Ratio-Adjusted McClellan Summation Index methodology by McClellan Financial Publications. No external code was used; the implementation is original, inspired by standard market breadth concepts.
Disclaimer
This indicator is for informational purposes only and does not constitute financial advice. Past performance is not indicative of future results. Conduct your own research and combine with other tools for informed trading decisions.

ATR Plots + OverlayATR Plots + Overlay
This tool calculates and displays Average True Range (ATR)-based levels on your chart for any selected timeframe, giving traders a quick visual reference for expected price movement relative to the most recent bar’s open price. It plots guide levels above and below that open and shows how much of the typical ATR-based range has already been covered—all in one interactive table and on-chart overlay.
What It Does
ATR Calculation:
Uses true range data over a user-defined period (default 14), smoothed via RMA, SMA, EMA, or WMA, on the selected timeframe (e.g., 1h, 4h, daily) to calculate the ATR value.
Projected Levels:
Plots four reference levels relative to the open price of the most recent bar on the chosen timeframe:
+100% ATR: Open + ATR
+50% ATR: Open + 50% of ATR
−50% ATR: Open − 50% of ATR
−100% ATR: Open − ATR
Coverage %:
Tracks high and low prices for the current session on the selected timeframe and calculates what percentage of the ATR has already been covered:
Coverage % = (High − Low) ÷ ATR × 100
Interactive Table:
Shows the ATR value and current coverage percentage in a customizable table overlay. Position, color scheme, borders, transparency, and an optional empty top row are all adjustable via settings.
Customization Options
Table Settings:
Position the table (top/bottom × left/right).
Customize background color, text color, border color, and thickness.
Optionally add an empty top row for spacing.
Line Settings:
Choose color, line style (solid/dotted/dashed), and width.
Lines automatically update with each new bar on the selected timeframe, anchored to that bar’s open price.
General Inputs:
ATR length (number of bars).
Smoothing method (RMA, SMA, EMA, WMA).
Timeframe selection for ATR calculations (e.g., 15m, 1h, Daily).
How to Use It for Trading
Measure Volatility: Quickly gauge the expected price movement based on ATR for any timeframe.
Identify Overextension: Use the coverage % to see how much of the expected ATR range is already consumed.
Plan Entries & Exits: Align trade targets and stops with ATR levels for more objective planning.
Visual Reference: Horizontal guide lines and table update automatically as new bars form, keeping information clear and actionable.
Ideal For
Intraday traders using ATR levels to frame trades.
Swing traders wanting ATR-based reference points for larger timeframes.
Anyone seeking a volatility-based framework for planning stops, targets, or identifying overextended conditions.

ADR Plots + OverlayADR Plots + Overlay
This tool calculates and displays Average Daily Range (ADR) levels on your chart, giving traders a quick visual reference for expected daily price movement. It plots guide levels above and below the daily open and shows how much of the day's typical range has already been covered—all in one interactive table and on-chart overlay.
What It Does
ADR Calculation:
Uses daily high-low differences over a user-defined period (default 14 days), smoothed via RMA, SMA, EMA, or WMA to calculate the average daily range.
Projected Levels:
Plots four reference levels relative to the current day's open price:
+100% ADR: Open + ADR
+50% ADR: Open + 50% of ADR
−50% ADR: Open − 50% of ADR
−100% ADR: Open − ADR
Coverage %:
Tracks intraday high and low prices to calculate what percentage of the ADR has already been covered for the current session:
Coverage % = (High − Low) ÷ ADR × 100
Interactive Table:
Shows the ADR value and today's ADR coverage percentage in a customizable table overlay. The table position, colors, border, transparency, and an optional empty top row can all be adjusted via settings.
Customization Options
Table Settings:
Position the table (top/bottom × left/right).
Change background color, text color, border color and thickness.
Toggle an empty top row for spacing.
Line Settings:
Choose color, line style (solid/dotted/dashed), and width.
Lines automatically reposition each day based on that day's open price and ADR calculation.
General Inputs:
ADR length (number of days).
Smoothing method (RMA, SMA, EMA, WMA).
How to Use It for Trading
Measure Daily Movement: Instantly know the expected daily price range based on historical volatility.
Identify Overextension: Use the coverage % to see if the market has already moved close to or beyond its typical daily range.
Plan Entries & Exits: Align trade targets and stops with ADR levels for more objective intraday planning.
Visual Reference: Horizontal guide lines and table update automatically as new data comes in, helping traders stay informed without manual calculations.
Ideal For
Intraday traders tracking daily volatility limits.
Swing traders wanting a quick reference for expected price movement per day.
Anyone seeking a volatility-based framework for planning targets, stops, or identifying extended market conditions.

Ultimate ATR Extreme DetectorUltimate ATR Extreme Detector
Professional Volatility Analysis Tool for Strategic Trading
Discover Market Turning Points with Precision
Key Features
Smart Extremum Detection: Identifies when ATR reaches its highest or lowest point in your specified lookback period
Quad Visual Alert System:
▲ Green bottom triangles for low volatility signals
▼ Red top triangles for high volatility signals
Background color highlighting for instant state recognition
Status panel showing current volatility extremes
Dual Alert Modes:
TradingView native alerts ("ATR Low/High Signal")
Visual chart alerts with period details (e.g., "Alert: ATR Low (50 bars)")
4 Calculation Methods: RMA (Wilder's), SMA, EMA, and WMA
Fully Customizable:
Adjustable ATR period (default: 14)
Variable lookback window (default: 50)
Toggle features on/off via intuitive input settings
How It Works
The indicator scans volatility extremes using proprietary logic:
Calculates True Range using selected method (RMA/SMA/EMA/WMA)
Compares current ATR value against historical data
Flags critical moments when:
Volatility contracts to N-period lows (prepare for breakouts)
Volatility expands to N-period highs (watch for trend exhaustion)
Strategic Applications
markdown
复制
| SIGNAL | MARKET CONDITION | TRADING IMPLICATION |
|------------------|-----------------------|--------------------------------|
| Low Volatility | Contraction/Consolidation | Anticipate breakout moves |
| High Volatility | Expansion/Climax | Prepare for reversals or pauses |
Position Sizing: Use ATR values to determine optimal stop distances
Entry Timing: Combine with price action at key support/resistance
Risk Management: Adjust stops dynamically based on volatility regime
Optimization Guide
Day Trading: Short lookback (20-30 periods)
Swing Trading: Medium lookback (50-100 periods)
Position Trading: Long lookback (100-200 periods)
Volatility Analysis: Compare multiple timeframes simultaneously
Professional Setup Recommendations
Combine with:
Breakout Confirmation: Volume spikes, chart patterns
Reversal Signals: RSI divergence, candlestick reversals
Volatility Filters: Bollinger Band contraction, Keltner Channel breakout
Compatibility: Works flawlessly across FX, stocks, crypto, and commodities on all timeframes.
Why Traders Choose This Indicator
"Transforms complex volatility analysis into clear, actionable visual cues – the essential tool for breakout traders and risk managers alike."
Install Now to:
Spot consolidation before big moves
Identify exhaustion at trend extremes
Automate volatility-based position sizing
Receive instant alerts at critical volatility turns
Master market rhythms with professional-grade volatility intelligence!

Auto Intelligence Selective Moving Average(AI/MA)# 🤖 Auto Intelligence Moving Average Strategy (AI/MA)
**AI/MA** is a state-adaptive moving average crossover strategy designed to **maximize returns from golden cross / death cross logic** by intelligently switching between different MA types and parameters based on market conditions.
---
## 🎯 Objective
To build a moving average crossover strategy that:
- **Adapts dynamically** to market regimes (trend vs range, rising vs falling)
- **Switches intelligently** between SMA, EMA, RMA, and HMA
- **Maximizes cumulative return** under realistic backtesting
---
## 🧪 materials amd methods
- **MA Types Considered**: SMA, EMA, RMA, HMA
- **Parameter Ranges**: Periods from 5 to 40
- **Market Conditions Classification**:
- Based on the slope of a central SMA(20) line
- And the relative position of price to the central line
- Resulting in 4 regimes: A (Bull), B (Pullback), C (Rebound), D (Bear)
- **Optimization Dataset**:
- **Bybit BTCUSDT.P**
- **1-hour candles**
- **2024 full-year**
- **Search Process**:
- **Random search**: 200 parameter combinations
- Evaluated by:
- `Cumulative PnL`
- `Sharpe Ratio`
- `Max Drawdown`
- `R² of linear regression on cumulative PnL`
- **Implementation**:
- Optimization performed in **Python (Pandas + Matplotlib + Optuna-like logic)**
- Final parameters ported to **Pine Script (v5)** for TradingView backtesting
---
## 📈 Performance Highlights (on optimization set)
| Timeframe | Return (%) | Notes |
|-----------|------------|----------------------------|
| 6H | +1731% | Strongest performance |
| 1D | +1691% | Excellent trend capture |
| 12H | +1438% | Balance of trend/range |
| 5min | +27.3% | Even survives scalping |
| 1min | +9.34% | Robust against noise |
- Leverage: 100x
- Position size: 100%
- Fees: 0.055%
- Margin calls: **none** 🎯
---
## 🛠 Technology Stack
- `Python` for data handling and optimization
- `Pine Script v5` for implementation and visualization
- Fully state-aware strategy, modular and extendable
---
## ✨ Final Words
This strategy is **not curve-fitted**, **not over-parameterized**, and has been validated across multiple timeframes. If you're a fan of dynamic, intelligent technical systems, feel free to use and expand it.
💡 The future of simple-yet-smart trading begins here.

LMAsLibrary "LMAs"
Credits
Thank you to @QuantraSystems for dynamic calculations.
Introduction
This lightweight library offers dynamic implementations of popular moving averages that adapt their length automatically as new bars are added to the chart.
Each function is built on a dynamic length formula:
len = math.min(maxLength, bar_index + 1)
This approach ensures that calculations begin as early as the first bar, allowing for smoother initialization and more consistent behavior across all timeframes. It’s especially useful in custom scripts that run from bar 0 or when historical data is limited.
Usage
You can use this library as a drop-in replacement for standard moving averages. It provides more flexibility and stability in live or backtesting environments where fixed-length indicators may delay or fail to initialize properly.
Why Use This?
• Works from the very first bar
• Avoids na values during early bars
• Great for real-time indicators, strategies, and bar-replay
• Clean and efficient code with dynamic behavior
How to Use
Import the library into your script and call any of the included functions just like you would with their native counterparts.
Summary
A lightweight Pine Script™ library offering dynamic moving averages that work seamlessly from the very first bar. Ideal for strategies and indicators requiring robust initialization and adaptive behavior.
SMA(sourceData, maxLength)
Dynamic SMA
Parameters:
sourceData (float)
maxLength (int)
EMA(src, length)
Dynamic EMA
Parameters:
src (float)
length (int)
DEMA(src, length)
Dynamic DEMA
Parameters:
src (float)
length (int)
TEMA(src, length)
Dynamic TEMA
Parameters:
src (float)
length (int)
WMA(src, length)
Dynamic WMA
Parameters:
src (float)
length (int)
HMA(src, length)
Dynamic HMA
Parameters:
src (float)
length (int)
VWMA(src, volsrc, length)
Dynamic VWMA
Parameters:
src (float)
volsrc (float)
length (int)
SMMA(src, length)
Dynamic SMMA
Parameters:
src (float)
length (int)
LSMA(src, length, offset)
Dynamic LSMA
Parameters:
src (float)
length (int)
offset (int)
RMA(src, length)
Dynamic RMA
Parameters:
src (float)
length (int)
ALMA(src, length, offset_sigma, sigma)
Dynamic ALMA
Parameters:
src (float)
length (int)
offset_sigma (float)
sigma (float)
ZLSMA(src, length)
Dynamic ZLSMA
Parameters:
src (float)
length (int)
FRAMA(src, length)
Parameters:
src (float)
length (int)
KAMA(src, length)
Dynamic KAMA
Parameters:
src (float)
length (int)
JMA(src, length, phase)
Dynamic JMA
Parameters:
src (float)
length (int)
phase (float)
T3(src, length, volumeFactor)
Dynamic T3
Parameters:
src (float)
length (int)
volumeFactor (float)

AsturRiskPanelIndicator Summary
ATR Engine
Length & Smoothing: Choose how many bars to use (default 14) and the smoothing method (RMA/SMA/EMA/WMA).
Median ATR: Computes a rolling median of ATR over a user-defined look-back (default 14) to derive a “scalp” target.
Scalp Target
Automatically set at ½ × median ATR, snapped to the nearest tick.
Optional rounding to whole points for simplicity.
Stop Calculation
ATR Multiplier: Scales current ATR by a user input (default 1.5) to produce your stop distance in points (and ticks when appropriate).
Distortion Handling: Switches between point-only and point + tick displays based on contract specifications.
Risk & Sizing
Risk % of account per trade (default 2 %).
Calculates dollar risk per contract and optimal contract count.
Displays all metrics (scalp, stop, risk/contract, max contracts, max risk, account size) in a customizable on-chart table.
ATR-Based Stop Placement Guidelines
Trade Context ATR Multiplier Notes
Tight Range Entry 1.0 × ATR High-conviction, precise entries. Expect more shake-outs.
Standard Trend Entry 1.5 × ATR Balanced for H2/L2, MTR, DT/DB entries.
Breakouts/Microchannels 2.0 × ATR Wide stops through chop—Brooks-style breathing room.
How to Use
Select ATR Settings
Pick an ATR length (e.g. 14) and smoothing (RMA for stability).
Adjust the median length if you want a faster/slower scalp line.
Align Multiplier with Your Setup
For tight-range entries, set ATR Multiplier ≈ 1.0.
For standard trend trades, leave at 1.5.
For breakout/pullback setups, increase to 2.0 or more.
Customize Risk Parameters
Enter your account size and desired risk % per trade (e.g. 2 %).
The table auto-calculates how many contracts you can take.
Read the On-Chart Table
Scalp shows your intraday target.
Stop gives Brooks-style stop distance in points (and ticks).
Risk/Contract is the dollar risk per contract.
Max Contracts tells you maximum position size.
Max Risk confirms total dollar exposure.
Visual Confirmation
Place your entry, then eyeball the scalp and stop levels against chart structure (e.g. swing highs/lows).
Adjust the ATR multiplier if market context shifts (e.g. volatility spikes).
By blending this sizing panel with contextual ATR multipliers, you’ll consistently give your trades the right amount of “breathing room” while keeping risk in check.

Topological Market Stress (TMS) - Quantum FabricTopological Market Stress (TMS) - Quantum Fabric
What Stresses The Market?
Topological Market Stress (TMS) represents a revolutionary fusion of algebraic topology and quantum field theory applied to financial markets. Unlike traditional indicators that analyze price movements linearly, TMS examines the underlying topological structure of market data—detecting when the very fabric of market relationships begins to tear, warp, or collapse.
Drawing inspiration from the ethereal beauty of quantum field visualizations and the mathematical elegance of topological spaces, this indicator transforms complex mathematical concepts into an intuitive, visually stunning interface that reveals hidden market dynamics invisible to conventional analysis.
Theoretical Foundation: Topology Meets Markets
Topological Holes in Market Structure
In algebraic topology, a "hole" represents a fundamental structural break—a place where the normal connectivity of space fails. In markets, these topological holes manifest as:
Correlation Breakdown: When traditional price-volume relationships collapse
Volatility Clustering Failure: When volatility patterns lose their predictive power
Microstructure Stress: When market efficiency mechanisms begin to fail
The Mathematics of Market Topology
TMS constructs a topological space from market data using three key components:
1. Correlation Topology
ρ(P,V) = correlation(price, volume, period)
Hole Formation = 1 - |ρ(P,V)|
When price and volume decorrelate, topological holes begin forming.
2. Volatility Clustering Topology
σ(t) = volatility at time t
Clustering = correlation(σ(t), σ(t-1), period)
Breakdown = 1 - |Clustering|
Volatility clustering breakdown indicates structural instability.
3. Market Efficiency Topology
Efficiency = |price - EMA(price)| / ATR
Measures how far price deviates from its efficient trajectory.
Multi-Scale Topological Analysis
Markets exist across multiple temporal scales simultaneously. TMS analyzes topology at three distinct scales:
Micro Scale (3-15 periods): Immediate structural changes, market microstructure stress
Meso Scale (10-50 periods): Trend-level topology, medium-term structural shifts
Macro Scale (50-200 periods): Long-term structural topology, regime-level changes
The final stress metric combines all scales:
Combined Stress = 0.3×Micro + 0.4×Meso + 0.3×Macro
How TMS Works
1. Topological Space Construction
Each market moment is embedded in a multi-dimensional topological space where:
- Price efficiency forms one dimension
- Correlation breakdown forms another
- Volatility clustering breakdown forms the third
2. Hole Detection Algorithm
The indicator continuously scans this topological space for:
Hole Formation: When stress exceeds the formation threshold
Hole Persistence: How long structural breaks maintain
Hole Collapse: Sudden topology restoration (regime shifts)
3. Quantum Visualization Engine
The visualization system translates topological mathematics into intuitive quantum field representations:
Stress Waves: Main line showing topological stress intensity
Quantum Glow: Surrounding field indicating stress energy
Fabric Integrity: Background showing structural health
Multi-Scale Rings: Orbital representations of different timeframes
4. Signal Generation
Stable Topology (✨): Normal market structure, standard trading conditions
Stressed Topology (⚡): Increased structural tension, heightened volatility expected
Topological Collapse (🕳️): Major structural break, regime shift in progress
Critical Stress (🌋): Extreme conditions, maximum caution required
Inputs & Parameters
🕳️ Topological Parameters
Analysis Window (20-200, default: 50)
Primary period for topological analysis
20-30: High-frequency scalping, rapid structure detection
50: Balanced approach, recommended for most markets
100-200: Long-term position trading, major structural shifts only
Hole Formation Threshold (0.1-0.9, default: 0.3)
Sensitivity for detecting topological holes
0.1-0.2: Very sensitive, detects minor structural stress
0.3: Balanced, optimal for most market conditions
0.5-0.9: Conservative, only major structural breaks
Density Calculation Radius (0.1-2.0, default: 0.5)
Radius for local density estimation in topological space
0.1-0.3: Fine-grained analysis, sensitive to local changes
0.5: Standard approach, balanced sensitivity
1.0-2.0: Broad analysis, focuses on major structural features
Collapse Detection (0.5-0.95, default: 0.7)
Threshold for detecting sudden topology restoration
0.5-0.6: Very sensitive to regime changes
0.7: Balanced, reliable collapse detection
0.8-0.95: Conservative, only major regime shifts
📊 Multi-Scale Analysis
Enable Multi-Scale (default: true)
- Analyzes topology across multiple timeframes simultaneously
- Provides deeper insight into market structure at different scales
- Essential for understanding cross-timeframe topology interactions
Micro Scale Period (3-15, default: 5)
Fast scale for immediate topology changes
3-5: Ultra-fast, tick/minute data analysis
5-8: Fast, 5m-15m chart optimization
10-15: Medium-fast, 30m-1H chart focus
Meso Scale Period (10-50, default: 20)
Medium scale for trend topology analysis
10-15: Short trend structures
20-25: Medium trend structures (recommended)
30-50: Long trend structures
Macro Scale Period (50-200, default: 100)
Slow scale for structural topology
50-75: Medium-term structural analysis
100: Long-term structure (recommended)
150-200: Very long-term structural patterns
⚙️ Signal Processing
Smoothing Method (SMA/EMA/RMA/WMA, default: EMA) Method for smoothing stress signals
SMA: Simple average, stable but slower
EMA: Exponential, responsive and recommended
RMA: Running average, very smooth
WMA: Weighted average, balanced approach
Smoothing Period (1-10, default: 3)
Period for signal smoothing
1-2: Minimal smoothing, noisy but fast
3-5: Balanced, recommended for most applications
6-10: Heavy smoothing, slow but very stable
Normalization (Fixed/Adaptive/Rolling, default: Adaptive)
Method for normalizing stress values
Fixed: Static 0-1 range normalization
Adaptive: Dynamic range adjustment (recommended)
Rolling: Rolling window normalization
🎨 Quantum Visualization
Fabric Style Options:
Quantum Field: Flowing energy visualization with smooth gradients
Topological Mesh: Mathematical topology with stepped lines
Phase Space: Dynamical systems view with circular markers
Minimal: Clean, simple display with reduced visual elements
Color Scheme Options:
Quantum Gradient: Deep space blue → Quantum red progression
Thermal: Black → Hot orange thermal imaging style
Spectral: Purple → Gold full spectrum colors
Monochrome: Dark gray → Light gray elegant simplicity
Multi-Scale Rings (default: true)
- Display orbital rings for different time scales
- Visualizes how topology changes across timeframes
- Provides immediate visual feedback on cross-scale dynamics
Glow Intensity (0.0-1.0, default: 0.6)
Controls the quantum glow effect intensity
0.0: No glow, pure line display
0.6: Balanced, recommended setting
1.0: Maximum glow, full quantum field effect
📋 Dashboard & Alerts
Show Dashboard (default: true)
Real-time topology status display
Current market state and trading recommendations
Stress level visualization and fabric integrity status
Show Theory Guide (default: true)
Educational panel explaining topological concepts
Dashboard interpretation guide
Trading strategy recommendations
Enable Alerts (default: true)
Extreme stress detection alerts
Topological collapse notifications
Hole formation and recovery signals
Visual Logic & Interpretation
Main Visualization Elements
Quantum Stress Line
Primary indicator showing topological stress intensity
Color intensity reflects current market state
Line style varies based on selected fabric style
Glow effect indicates stress energy field
Equilibrium Line
Silver line showing average stress level
Reference point for normal market conditions
Helps identify when stress is elevated or suppressed
Upper/Lower Bounds
Red upper bound: High stress threshold
Green lower bound: Low stress threshold
Quantum fabric fill between bounds shows stress field
Multi-Scale Rings
Aqua circles : Micro-scale topology (immediate changes)
Orange circles: Meso-scale topology (trend-level changes)
Provides cross-timeframe topology visualization
Dashboard Information
Topology State Icons:
✨ STABLE: Normal market structure, standard trading conditions
⚡ STRESSED: Increased structural tension, monitor closely
🕳️ COLLAPSE: Major structural break, regime shift occurring
🌋 CRITICAL: Extreme conditions, reduce risk exposure
Stress Bar Visualization:
Visual representation of current stress level (0-100%)
Color-coded based on current topology state
Real-time percentage display
Fabric Integrity Dots:
●●●●● Intact: Strong market structure (0-30% stress)
●●●○○ Stressed: Weakening structure (30-70% stress)
●○○○○ Fractured: Breaking down structure (70-100% stress)
Action Recommendations:
✅ TRADE: Normal conditions, standard strategies apply
⚠️ WATCH: Monitor closely, increased vigilance required
🔄 ADAPT: Change strategy, regime shift in progress
🛑 REDUCE: Lower risk exposure, extreme conditions
Trading Strategies
In Stable Topology (✨ STABLE)
- Normal trading conditions apply
- Use standard technical analysis
- Regular position sizing appropriate
- Both trend-following and mean-reversion strategies viable
In Stressed Topology (⚡ STRESSED)
- Increased volatility expected
- Widen stop losses to account for higher volatility
- Reduce position sizes slightly
- Focus on high-probability setups
- Monitor for potential regime change
During Topological Collapse (🕳️ COLLAPSE)
- Major regime shift in progress
- Adapt strategy immediately to new market character
- Consider closing positions that rely on previous regime
- Wait for new topology to stabilize before major trades
- Opportunity for contrarian plays if collapse is extreme
In Critical Stress (🌋 CRITICAL)
- Extreme market conditions
- Significantly reduce risk exposure
- Avoid new positions until stress subsides
- Focus on capital preservation
- Consider hedging existing positions
Advanced Techniques
Multi-Timeframe Topology Analysis
- Use higher timeframe TMS for regime context
- Use lower timeframe TMS for precise entry timing
- Alignment across timeframes = highest probability trades
Topology Divergence Trading
- Most powerful at regime boundaries
- Price makes new high/low but topology stress decreases
- Early warning of potential reversals
- Combine with key support/resistance levels
Stress Persistence Analysis
- Long periods of stable topology often precede major moves
- Extended stress periods often resolve in regime changes
- Use persistence tracking for position sizing decisions
Originality & Innovation
TMS represents a genuine breakthrough in applying advanced mathematics to market analysis:
True Topological Analysis: Not a simplified proxy but actual topological space construction and hole detection using correlation breakdown, volatility clustering analysis, and market efficiency measurement.
Quantum Aesthetic: Transforms complex topology mathematics into an intuitive, visually stunning interface inspired by quantum field theory visualizations.
Multi-Scale Architecture: Simultaneous analysis across micro, meso, and macro timeframes provides unprecedented insight into market structure dynamics.
Regime Detection: Identifies fundamental market character changes before they become obvious in price action, providing early warning of structural shifts.
Practical Application: Clear, actionable signals derived from advanced mathematical concepts, making theoretical topology accessible to practical traders.
This is not a combination of existing indicators or a cosmetic enhancement of standard tools. It represents a fundamental reimagining of how we measure, visualize, and interpret market dynamics through the lens of algebraic topology and quantum field theory.
Best Practices
Start with defaults: Parameters are optimized for broad market applicability
Match timeframe: Adjust scales based on your trading timeframe
Confirm with price action: TMS shows market character, not direction
Respect topology changes: Reduce risk during regime transitions
Use appropriate strategies: Adapt approach based on current topology state
Monitor persistence: Track how long topology states maintain
Cross-timeframe analysis: Align multiple timeframes for highest probability trades
Alerts Available
Extreme Topological Stress: Market fabric under severe deformation
Topological Collapse Detected: Regime shift in progress
Topological Hole Forming: Market structure breakdown detected
Topology Stabilizing: Market structure recovering to normal
Chart Requirements
Recommended Markets: All liquid markets (forex, stocks, crypto, futures)
Optimal Timeframes: 5m to Daily (adaptable to any timeframe)
Minimum History: 200 bars for proper topology construction
Best Performance: Markets with clear regime characteristics
Academic Foundation
This indicator draws from cutting-edge research in:
- Algebraic topology and persistent homology
- Quantum field theory visualization techniques
- Market microstructure analysis
- Multi-scale dynamical systems theory
- Correlation topology and network analysis
Disclaimer
This indicator is for educational and research purposes only. It does not constitute financial advice or provide direct buy/sell signals. Topological analysis reveals market structure characteristics, not future price direction. Always use proper risk management and combine with your own analysis. Past performance does not guarantee future results.
See markets through the lens of topology. Trade the structure, not the noise.
Bringing advanced mathematics to practical trading through quantum-inspired visualization.
Trade with insight. Trade with structure.
— Dskyz , for DAFE Trading Systems

Stochastic RainbowThe Stochastic Rainbow indicator is a multi-layered momentum oscillator designed to provide a comprehensive view of market dynamics by combining multiple stochastic oscillators of varying periods. This approach allows traders to analyze both short-term and long-term momentum within a single visual framework, enhancing decision-making for entries and exits.
🔧 Indicator Settings and Customization
Select from various moving average methods (e.g., SMA, EMA, DEMA, TEMA, WMA, VWMA, RMA, T3) to smooth the stochastic lines. Different methods can affect the responsiveness of the indicator.
The indicator computes five sets of stochastic oscillators with Fibonacci values.
Each %K line is smoothed using the selected moving average type, and a corresponding %D line is plotted for each %K.
🎨 Visual Interpretation
The Stochastic Rainbow indicator plots multiple %K and %D lines, each with distinct colors for easy differentiation.
Additionally, horizontal dotted lines are drawn at levels 80 (Upper Band), 50 (Midline), and 20 (Lower Band) to indicate overbought, neutral, and oversold conditions, respectively.
📈 Trading Strategies Using Stochastic Rainbow
The multi-layered structure of the Stochastic Rainbow allows for nuanced analysis.
Trend Confirmation:
When all %K lines are above 50 and aligned in ascending order (short-term above long-term), it suggests a strong uptrend.
Conversely, when all %K lines are below 50 and aligned in descending order, it indicates a strong downtrend.
Overbought/Oversold Conditions:
If the shorter-term %K lines (e.g., %K 5,3 and %K 8,3) enter the overbought zone (>80) while longer-term lines remain below, it may signal a potential reversal.
Similarly, if shorter-term lines enter the oversold zone (<20) while longer-term lines remain above, it could indicate an upcoming bullish reversal.
Crossovers:
A bullish signal occurs when a %K line crosses above its corresponding %D line.
A bearish signal occurs when a %K line crosses below its corresponding %D line.
Divergence Analysis:
If price makes a new high while the %K lines do not, it may indicate bearish divergence and a potential reversal.
If price makes a new low while the %K lines do not, it may indicate bullish divergence and a potential reversal.
⚙️ Adjusting Settings for Optimal Use
The Stochastic Rainbow's flexibility allows traders to adjust settings to match their trading style and the specific asset's behavior:
Short-Term Trading: Use shorter periods (e.g., 5 for %K) and more responsive moving averages (e.g., WMA, VWMA, EMA, DEMA, TEMA, HMA) to capture quick market movements.
Long-Term Trading: Opt for longer periods (e.g., 55 for %K) and smoother moving averages (e.g., SMA, RMA, T3) to filter out noise and focus on broader trends.
Volatile Markets: Consider using the T3 moving average for its smoothing capabilities, helping to reduce false signals in choppy markets.
By experimenting with different settings, traders can fine-tune the indicator to better suit their analysis and improve decision-making.

Linear Regression Volume | Lyro RSLinear Regression Volume | Lyro RS
⚠️Disclaimer⚠️
Always combine this indicator with other forms of analysis and risk management. Please do your own research before making any trading decisions.
The LR Volume | 𝓛𝔂𝓻𝓸 𝓡𝓢 indicator blends linear regression with volume-adjusted moving average s to dynamically outline price equilibrium and trend intensity. By integrating volume into its regression model, it highlights meaningful price movement relative to trading activity.
📌 How It Works:
Volume-Weighted Regression Baseline
Price is filtered through one of four volume-adjusted moving averages (SMA, RMA, HMA, ALMA) before being passed through a linear regression model, forming a dynamic fair value line.
Deviation Bands
The indicator plots 1x, 2x, and 3x standard deviation zones above and below the baseline, helping identify potential extremes, volatility spikes, and mean reversion areas.
Slope-Based Color Logic
The baseline and fill areas are dynamically colored:
- 🟢 Green for positive slope (uptrend)
- 🔴 Red for negative slope (downtrend)
- ⚪ Gray for neutral movement
⚙️ Inputs & Options:
Regression Length – Controls how many bars are used in the moving average and regression calculation.
Deviation Multiplier – Adjusts the width of the bands surrounding the regression baseline.
MA Type – Choose from 4 types:
SMA (Simple Moving Average)
RMA (Relative Moving Average)
HMA (Hull Moving Average)
ALMA (Arnaud Legoux Moving Average)
Band Colors – Customizable upper/lower band colors to match your visual style.
🔔 Alerts:
Long Signal – Triggers when the regression slope turns positive.
Short Signal – Triggers when the regression slope turns negative.

CAN INDICATORCAN Moving Averages Indicator - Feature Guide
1. Multiple Moving Averages (20 MAs)
- Supports up to 20 individual moving averages
- Each MA can be independently configured:
- Enable/Disable toggle
- Length (period) setting
- Type selection (SMA, EMA, DEMA, VWMA, RMA, WMA)
- Color customization
- Individual timeframe settings when global timeframe is disabled
Pre-configured MA Settings:
1. MA1-8: SMA type
- Lengths: 20, 50, 100, 200, 365, 489, 600, 1460
2. MA9-20: EMA type
- Lengths: 30, 60, 120, 240, 300, 400, 500, 700, 800, 900, 1000, 2000
2. Global Timeframe Settings
Location: Global Settings group
Features:
- Use Global Timeframe: Toggle to use one timeframe for all MAs
- Global Timeframe: Select the timeframe to apply globally
3. Label Display Options
Location: Main Inputs section
Controls:
- Show MA Type: Display MA type (SMA, EMA, etc.)
- Show MA Length: Display period length
- Show Resolution: Display timeframe
- Label Offset: Adjust label position
4. Cross Alerts System
Location: Cross Alerts group
Features:
1. Price Crosses:
- Alerts when price crosses any selected MA
- Select MA to monitor (1-20)
- Triggers on crossover/crossunder
2. MA Crosses:
- Alerts when one MA crosses another
- Select fast MA (1-20)
- Select slow MA (1-20)
- Triggers on crossover/crossunder
5. Relative Strength (RS) Analysis
Location: Relative Strength group
Features:
- Select any MA to monitor (1-20)
- Compares MA to its own average
- Adjustable RS Length (default 14)
- Visual feedback via background color:
- Green: MA above its average (uptrend)
- Red: MA below its average (downtrend)
- Customizable colors and transparency
6. Moving Average Types Available
1. **SMA** (Simple Moving Average)
- Equal weight to all prices
2. **EMA** (Exponential Moving Average)
- More weight to recent prices
3. **DEMA** (Double Exponential Moving Average)
- Reduced lag compared to EMA
4. **VWMA** (Volume Weighted Moving Average)
- Incorporates volume data
5. **RMA** (Running Moving Average)
- Smoother than EMA
6. **WMA** (Weighted Moving Average)
- Linear weight distribution
Usage Tips
1. **For Trend Following:**
- Enable longer-period MAs (MA4-MA8)
- Use cross alerts between long-term MAs
- Monitor RS for trend strength
2. **For Short-term Trading:**
- Focus on shorter-period MAs (MA1-MA3, MA9-MA11)
- Enable price cross alerts
- Use multiple timeframe analysis
3. **For Multiple Timeframe Analysis:**
- Disable global timeframe
- Set different timeframes for each MA
- Compare MA relationships across timeframes
4. **For Performance:**
- Disable unused MAs
- Limit active alerts to necessary pairs
- Use RS selectively on key MAs

Stochastic Overlay - Regression Channel (Zeiierman)█ Overview
The Stochastic Overlay – Regression Channel (Zeiierman) is a next-generation visualization tool that transforms the traditional Stochastic Oscillator into a dynamic price-based overlay.
Instead of leaving momentum trapped in a lower subwindow, this indicator projects the Stochastic oscialltor directly onto price itself — allowing traders to visually interpret momentum, overbought/oversold conditions, and market strength without ever taking their eyes off price action.
⚪ In simple terms:
▸ The Bands = The Stochastic Oscillator — but on price.
▸ The Midline = Stochastic 50 level
▸ Upper Band = Stochastic Overbought Threshold
▸ Lower Band = Stochastic Oversold Threshold
When the price moves above the midline → it’s the same as the oscillator moving above 50
When the price breaks above the upper band → it’s the same as Stochastic entering overbought.
When the price reaches the lower band →, think of it like Stochastic being oversold.
This makes market conditions visually intuitive. You’re literally watching the oscillator live on the price chart.
█ How It Works
The indicator layers 3 distinct technical elements into one clean view:
⚪ Stochastic Momentum Engine
Tracks overbought/oversold conditions and directional strength using:
%K Line → Momentum of price
%D Line → Smoothing filter of %K
Overbought/Oversold Bands → Highlight potential reversal zones
⚪ Volatility Adaptive Bands
Dynamic bands plotted above and below price using:
ATR * Stochastic Scaling → Creates wider bands during volatile periods & tighter bands in calm conditions
Basis → Moving average centerline (EMA, SMA, WMA, HMA, RMA selectable)
This means:
→ In strong trends: Bands expand
→ In consolidations: Bands contract
⚪ Regression Channel
Projects trend direction with different models:
Logarithmic → Captures non-linear growth (perfect for crypto or exponential stocks)
Linear → Classic regression fit
Adaptive → Dynamically adjusts sensitivity
Leading → Projects trend further ahead (aggressive mode)
Channels include:
Midline → Fair value trend
Upper/Lower Bounds → Deviation-based support/resistance
⚪ Heatmap - Bull & Bear Power Strength
Visual heatmeter showing:
% dominance of bulls vs bears (based on close > or < Band Basis)
Automatic normalization regardless of timeframe
Table display on-chart for quick visual insight
Dynamic highlighting when extreme levels are reached
⚪ Trend Candlestick Coloring
Bars auto-color based on trend filter:
Above Basis → Bullish Color
Below Basis → Bearish Color
█ How to Use
⚪ Trend Trading
→ Use Band direction + Regression Channel to identify trend alignment
→ Longs favored when price holds above the Basis
→ Shorts favored when price stays below the Basis
→ Use the Bull & Bear heatmap to asses if the bulls or the bears are in control.
⚪ Mean Reversion
→ Look for price to interact with Upper or Lower Band extremes
→ Stochastic reaching OB/OS zones further supports reversals
⚪ Momentum Confirmation
→ Crossovers between %K and %D can confirm continuation or divergence signals
→ Especially powerful when happening at band boundaries
⚪ Strength Heatmap
→ Quickly visualize current buyer vs seller control
→ Sharp spikes in Bull Power = Aggressive buying
→ Sharp spikes in Bear Power = Heavy selling pressure
█ Why It Useful
This is not a typical Stochastic or regression tool. The tool is designed for traders who want to:
React dynamically to price volatility
Map momentum into volatility context
Use adaptive regression channels across trend styles
Visualize bull vs bear power in real-time
Follow trends with built-in reversal logic
█ Settings
Stochastic Settings
Stochastic Length → Period of calculation. Higher = smoother, Lower = faster signals.
%K Smoothing → Smooths the Stochastic line itself.
%D Smoothing → Smooths the moving average of %K for slower signals.
Stochastic Band
Band Length → Length of the Moving Average Basis.
Volatility Multiplier → Controls band width via ATR scaling.
Band Type → Choose MA type (EMA, SMA, WMA, HMA, RMA).
Regression Channel
Regression Type → Logarithmic / Linear / Adaptive / Leading.
Regression Length → Number of bars for regression calculation.
Heatmap Settings
Heatmap Length → Number of bars to calculate bull/bear dominance.
-----------------
Disclaimer
The content provided in my scripts, indicators, ideas, algorithms, and systems is for educational and informational purposes only. It does not constitute financial advice, investment recommendations, or a solicitation to buy or sell any financial instruments. I will not accept liability for any loss or damage, including without limitation any loss of profit, which may arise directly or indirectly from the use of or reliance on such information.
All investments involve risk, and the past performance of a security, industry, sector, market, financial product, trading strategy, backtest, or individual's trading does not guarantee future results or returns. Investors are fully responsible for any investment decisions they make. Such decisions should be based solely on an evaluation of their financial circumstances, investment objectives, risk tolerance, and liquidity needs.

Adaptable Relative Momentum Index [ParadoxAlgo]The Adaptable Relative Momentum Index (RMI) by ParadoxAlgo is an advanced momentum-based indicator that builds upon the well-known RSI (Relative Strength Index) concept by introducing a customizable momentum length. This indicator measures price momentum over a specified number of periods and applies a Rolling Moving Average (RMA) to both the positive and negative price changes. The result is a versatile tool that can help traders gauge the strength of a trend, pinpoint overbought/oversold levels, and potentially identify breakout opportunities.
⸻
Smart Configuration Feature
What sets this version of the RMI apart is ParadoxAlgo’s exclusive “Smart Configuration” functionality. Instead of manually adjusting parameters, traders can simply select their Asset Class (e.g., Stocks, Forex, Futures/Indices, Crypto, Commodities) and Trading Style (e.g., Scalping, Day Trading, Swing Trading, Short-Term Investing, Long-Term Investing). Based on these selections, the indicator automatically optimizes its core parameters:
• Length – The period over which the price changes are smoothed.
• Momentum Length – The number of bars used to calculate the price change.
By automating this process, users save time on tedious trial-and-error adjustments, ensuring that the RMI’s settings are tailored to the characteristics of specific markets and personal trading horizons.
⸻
Key Features & Benefits
1. Momentum-Based Insights
• Uses RMA to smooth price movements, helping identify shifts in market momentum more clearly than a basic RSI.
• Enhanced adaptability for a wide range of asset classes and time horizons.
2. Simple Yet Powerful Configuration
• Smart Configuration automatically sets optimal parameter values for each combination of asset class and trading style.
• Eliminates guesswork and manual recalibration when switching between markets or timeframes.
3. Overbought & Oversold Visualization
• Integrated highlight zones mark potential overbought and oversold extremes (default at 80 and 20).
• Optional breakout highlighting draws attention to times when the indicator crosses these key thresholds, helping spot possible entry or exit signals.
4. Intuitive Design & Ease of Use
• Clean plotting and color-coded signal lines make it easy to interpret bullish or bearish shifts in momentum.
• Straightforward dropdown menus keep the interface user-friendly, even for novice traders.
⸻
Practical Applications
• Early Trend Detection: Spot emerging trends when the RMI transitions from oversold to higher levels or vice versa.
• Breakout Confirmation: Confirm potential breakout trades by tracking overbought/oversold breakouts alongside other technical signals.
• Support/Resistance Confluence: Combine RMI signals with horizontal support/resistance levels to reinforce trade decisions.
• Trade Timing: Quickly gauge when momentum could be shifting, helping you time entries and exits more effectively.
⸻
Disclaimer
As with any technical indicator, the Adaptable Relative Momentum Index should be used as part of a broader trading strategy that includes risk management, fundamental analysis, and other forms of technical confirmation. Past performance does not guarantee future results.
⸻
Enjoy using the Adaptable RMI and experience a more streamlined, flexible approach to momentum analysis. Feel free to explore different asset classes and trading styles to discover which configurations resonate best with your unique trading preferences.

Chonky ATR Levels 2.0Show ATR based high/low projections.
Choose a custom ATR calculation in the indicator's settings.
The default is a 20day RMA based ATR.
----------How projections are calculated----------
To project the ATR High, the ATR value is added to the low of the current candle that matches the ATR's timeframe.
To project the ATR Low, the ATR value is subtracted from the high of the current candle that matches the ATR's timeframe.
Example:
If a 20day RMA ATR is used:
- the ATR High will be the current day's low + the ATR value.
- the ATR Low will be the current day's high - the ATR value.
*However*, if the price action exceeds either ATR projection, the opposite ATR level will be fixed to the extreme of the period.
See the AUDUSD screenshot above for an example.
The ATR Low was exceeded, so the ATR High projection is capped at the high of day.
If the ATR High is exceeded, the ATR Low would be capped at the low of day.

Weighted Relative Strength Index [SeerQuant]Weighted Relative Strength Index (WRSI)
The Weighted Relative Strength Index (WRSI) is an advanced momentum oscillator that enhances the traditional RSI by incorporating customizable weighting methods and moving average smoothing. With dynamic threshold logic, color-coded visuals, and optional candle coloring, the WRSI provides traders with a versatile tool for identifying trends, overbought/oversold conditions, and momentum shifts.
⚙️ How It Works
1. Weighted Momentum Calculation
The indicator calculates price changes (delta) and applies a user-defined weighting method (e.g., Volume, Momentum, Volatility, or Reversion Factor) to emphasize specific market dynamics.
2. Custom Moving Average Integration
Weighted upward and downward price movements are smoothed using a selectable moving average type (e.g., SMA, EMA, TEMA, etc.), producing a weighted RSI that blends momentum and trend data.
3. Smoothed RSI Output
An additional moving average is applied to the weighted RSI for a smoothed version, offering a clearer view of momentum trends.
4. Threshold Logic
Bullish (Uptrend): WRSI exceeds the upper neutral zone boundary (50 + Neutral Zone).
Bearish (Downtrend): WRSI falls below the lower neutral zone boundary (50 - Neutral Zone).
Neutral: WRSI remains within the neutral zone.
Extreme overbought (90+) and oversold (20-) levels are marked with X’s for quick identification.
5. Dynamic Visual Representation
A color-coded line reflects the WRSI, adjusting hues based on trend direction.
Gradient fills highlight overbought/oversold zones and neutral areas.
Optional candle coloring ties price action to WRSI or smoothed RSI values.
A histogram-style fill between the WRSI and midline enhances trend strength visibility.
✨ Customizable Settings
Calculation Settings:
Calculation Source: Select the price source (default: close).
Calculation Length: Set the lookback period for RSI calculation (default: 14).
Moving Average Type: Choose from SMA, EMA, RMA, WMA, VWMA, LSMA, HMA, ALMA, DEMA, or TEMA (default: RMA).
Moving Average Length: Adjust the smoothing period for the weighted RSI (default: 8).
Neutral Zone Range: Define the width of the neutral zone around the midline (default: 5).
RSI Weighting Method:
Volume: Weights by trading volume.
Momentum: Weights by absolute price momentum.
Volatility: Weights by standard deviation.
Reversion Factor: Weights inversely to variance for mean-reversion emphasis (default: Momentum).
Style Settings:
Colour Choice: Pick from predefined schemes: Default, Modern, Cool, or Monochrome (default: Default).
Use Custom Colors?: Toggle to use custom bull, bear, and neutral colors (default: false).
Bull/Bear/Neutral Colors: Set custom colors when enabled (default: green/red/gray).
Candle Color Mode: Color candles based on WRSI or smoothed RSI (default: RSI).
Color Candles?: Enable/disable candle coloring (default: false).
🚀 Features and Benefits
Weighted Momentum Analysis: Enhances RSI with dynamic weighting for deeper market insights.
Flexible Smoothing: Multiple MA types and adjustable lengths adapt to various trading styles.
Visual Intuition: Color-coded outputs, gradient fills, and optional candle coloring simplify trend analysis.
Customizable Thresholds: Neutral zone and extreme levels cater to individual strategies.
Overbought/Oversold Signals: Clear markers for extreme conditions improve decision-making.
📜 Disclaimer
This indicator is for educational purposes only and does not constitute financial advice. Past performance does not guarantee future results. Always consult a licensed financial advisor before making trading decisions. Use at your own risk.

TALibrary "TA"
Technical analysis library that provides convenience functions and overrides for tradingview's own ta.* functions in order to work around various limitations.
sma(src, length)
Override for ta.sma that allows you to provide series values
Parameters:
src (float) : The source values to process
length (int) : The length of the source to evaluate for the moving average
Returns: float The moving average
ema(src, length)
Override for ta.ema that allows you to provide series values
Parameters:
src (float) : The source values to process
length (int) : The length of the source to evaluate for the moving average
Returns: float The moving average
rma(src, length)
Override for ta.rma that allows you to provide series values
Parameters:
src (float) : The source values to process
length (int) : The length of the source to evaluate for the moving average
Returns: float The moving average
wma(src, length)
Override for ta.wma that allows you to provide series values
Parameters:
src (float) : The source values to process
length (int) : The length of the source to evaluate for the moving average
Returns: float The moving average
vwma(src, length)
Override for ta.vwma that allows you to provide series values
Parameters:
src (float) : The source values to process
length (int) : The length of the source to evaluate for the moving average
Returns: float The moving average
ma(src, length, maType)
Provide the requested moving average
Parameters:
src (float) : The source values to process
length (int) : The length of the source to evaluate for the moving average
maType (string) : The type of moving average to return: SMA (default), EMA, SMMA (RMA), WMA, VWMA
Returns: float The moving average
EMA & Bollinger BandsThis indicator combines three main functionalities into a single script:
1. Exponential Moving Average (EMA):
- Purpose: Calculates and plots the EMA of a chosen price source.
- Inputs:
- EMA Length: The period for the EMA calculation.
- EMA Source: The price series (such as close) used for the EMA.
- EMA Offset: Allows shifting the EMA line left or right on the chart.
- Output: A blue-colored EMA line plotted on the chart.
2. Smoothing MA on EMA:
- Purpose: Applies a secondary moving average (MA) on the previously calculated EMA. There is also an option to overlay Bollinger Bands on this smoothed MA.
- Inputs:
- Smoothing MA Type: Options include "None", "SMA", "SMA + Bollinger Bands", "EMA", "SMMA (RMA)", "WMA", and "VWMA".
- Selecting "None" disables this feature.
- Choosing "SMA + Bollinger Bands" will additionally plot Bollinger Bands around the smoothed MA.
- Smoothing MA Length: The period used to calculate the smoothing MA.
- BB StdDev for Smoothing MA: The standard deviation multiplier for the Bollinger Bands (applies only when "SMA + Bollinger Bands" is selected).
- Calculation Details:
- The chosen MA type is applied to the EMA value.
- If Bollinger Bands are enabled, the script computes the standard deviation of the EMA over the smoothing period, multiplies it by the specified multiplier, and then plots an upper and lower band around the smoothing MA.
- Output:
- A yellow-colored smoothing MA line.
- Optionally, green-colored upper and lower Bollinger Bands with a filled background if the "SMA + Bollinger Bands" option is selected.
3. Bollinger Bands on Price:
- Purpose: Independently calculates and plots traditional Bollinger Bands based on a moving average of a selected price source.
- Inputs:
- BB Length: The period for calculating the moving average that serves as the basis of the Bollinger Bands.
- BB Basis MA Type: The type of moving average to use (options include SMA, EMA, SMMA (RMA), WMA, and VWMA).
- BB Source: The price series (such as close) used for the Bollinger Bands calculation.
- BB StdDev: The multiplier for the standard deviation used to calculate the upper and lower bands.
- BB Offset: Allows shifting the Bollinger Bands left or right on the chart.
- Calculation Details:
- The script computes a basis line using the selected MA type on the chosen price source.
- The standard deviation of the price over the specified period is then multiplied by the provided multiplier to determine the distance for the upper and lower bands.
- Output:
- A basis line (typically drawn in a blue tone), an upper band (red), and a lower band (teal).
- The area between the upper and lower bands is filled with a semi-transparent blue background for easier visualization.
---
How It Works Together
- Integration:
The script is divided into clearly labeled sections for each functionality. All parts are drawn on the same chart (overlay mode enabled), providing a comprehensive view of market trends.
- Customization:
Users can adjust parameters for the EMA, the smoothing MA (and its optional Bollinger Bands), as well as the traditional Bollinger Bands independently. This allows for flexible customization depending on the trader's strategy or visual preference.
- Utility:
Combining these three analyses into one indicator enables traders to view:
- The immediate trend via the EMA.
- A secondary smoothed trend that might help reduce noise.
- A volatility measure through Bollinger Bands on both the price and the smoothed EMA.
---
This combined indicator is useful for technical analysis by providing both trend-following (EMA and smoothing MA) and volatility indicators (Bollinger Bands) in one streamlined tool.

Internal Bar StrengthShort Description:
This indicator calculates the Internal Bar Strength (IBS) for each bar, which measures the close price’s relative position within that bar’s high-low range, and then optionally smooths that value with a selected moving average.
What Does It Measure?
Internal Bar Strength (IBS):
The IBS formula is (close-low)/(high-low)
. This ratio indicates where the closing price lies within a bar’s trading range:
A value near 0 means the close is near the bar’s low.
A value near 1 means the close is near the bar’s high.
A value of 0.5 means the close is exactly in the middle of the bar’s range.
Smoothing (Moving Averages):
You can choose to smooth the IBS value with one of five different moving average types: RMA, SMA, EMA, WMA, or VWMA. The default length for smoothing is 10, but this can be adjusted for more or less sensitivity.
Key Features
Multiple MA Options:
RMA: Also known as the Wilder’s moving average, it reacts slightly slower to changes than EMA.
SMA: Simple moving average, straightforward average of the last n values.
EMA: Exponential moving average, places more weight on recent data.
WMA: Weighted moving average, linear weighting from oldest to newest data.
VWMA: Volume-weighted moving average, weights price by trading volume.
Color Coding:
Green when IBS is greater than 0.5.
Red when IBS is less than or equal to 0.5.
