Absolute Strength Index [ASI] (Zeiierman)█ Overview
The Absolute Strength Index (ASI) is a next-generation oscillator designed to measure the strength and direction of price movements by leveraging percentile-based normalization of historical returns. Developed by Zeiierman, this indicator offers a highly visual and intuitive approach to identifying market conditions, trend strength, and divergence opportunities.
By dynamically scaling price returns into a bounded oscillator (-10 to +10), the ASI helps traders spot overbought/oversold conditions, trend reversals, and momentum changes with enhanced precision. It also incorporates advanced features like divergence detection and adaptive signal smoothing for versatile trading applications.
█ How It Works
The ASI's core calculation methodology revolves around analyzing historical price returns, classifying them into top and bottom percentiles, and normalizing the current price movement within this framework. Here's a breakdown of its key components:
⚪ Returns Lookback
The ASI evaluates historical price returns over a user-defined period (Returns Lookback) to measure recent price behavior. This lookback window determines the sensitivity of the oscillator:
Shorter Lookback: Higher responsiveness to recent price movements, suitable for scalping or high-volatility assets.
Longer Lookback: Smoother oscillator behavior is ideal for identifying larger trends and avoiding false signals.
⚪ Percentile-Based Thresholds
The ASI categorizes returns into two groups:
Top Percentile (Winners): The upper X% of returns, representing the strongest upward price moves.
Bottom Percentile (Losers): The lower X% of returns, capturing the sharpest downward movements.
This percentile-based normalization ensures the ASI adapts to market conditions, filtering noise and emphasizing significant price changes.
⚪ Oscillator Normalization
The ASI normalizes current returns relative to the top and bottom thresholds:
Values range from -10 to +10, where:
+10 represents extreme bullish strength (above the top percentile threshold).
-10 indicates extreme bearish weakness (below the bottom percentile threshold).
⚪ Signal Line Smoothing
A signal line is optionally applied to the ASI using a variety of moving averages:
Options: SMA, EMA, WMA, RMA, or HMA.
Effect: Smooths the ASI to filter out noise, with shorter lengths offering higher responsiveness and longer lengths providing stability.
⚪ Divergence Detection
One of ASI's standout features is its ability to detect and highlight bullish and bearish divergences:
Bullish Divergence: The ASI forms higher lows while the price forms lower lows, signaling potential upward reversals.
Bearish Divergence: The ASI forms lower highs while the price forms higher highs, indicating potential downward reversals.
█ Key Differences from RSI
Dynamic Adaptability: ASI adjusts to market conditions through percentile-based scaling, while RSI uses static thresholds.
█ How to Use ASI
⚪ Trend Identification
Bullish Strength: ASI above zero suggests upward momentum, suitable for trend-following trades.
Bearish Weakness: ASI below zero signals downward momentum, ideal for short trades or exits from long positions.
⚪ Overbought/Oversold Levels
Overbought Zone: ASI in the +8 to +10 range indicates potential exhaustion of bullish momentum.
Oversold Zone: ASI in the -8 to -10 range points to potential reversal opportunities.
⚪ Divergence Signals
Look for bullish or bearish divergence labels to anticipate trend reversals before they occur.
⚪ Signal Line Crossovers
A crossover between the ASI and its signal line (e.g., EMA or SMA) can indicate a shift in momentum:
Bullish Crossover: ASI crosses above the signal line, signaling potential upside.
Bearish Crossover: ASI crosses below the signal line, suggesting downside momentum.
█ Settings Explained
⚪ Absolute Strength Index
Returns Lookback: Sets the sensitivity of the oscillator. Shorter periods detect short-term changes, while longer periods focus on broader trends.
Top/Bottom Percentiles: Adjust thresholds for defining winners and losers. Narrower percentiles increase sensitivity to outliers.
Signal Line Type: Choose from SMA, EMA, WMA, RMA, or HMA for smoothing.
Signal Line Length: Fine-tune the responsiveness of the signal line.
⚪ Divergence
Divergence Lookback: Adjusts the period for detecting divergence. Use longer lookbacks to reduce noise.
-----------------
Disclaimer
The information contained in my Scripts/Indicators/Ideas/Algos/Systems does not constitute financial advice or a solicitation to buy or sell any securities of any type. I will not accept liability for any loss or damage, including without limitation any loss of profit, which may arise directly or indirectly from the use of or reliance on such information.
All investments involve risk, and the past performance of a security, industry, sector, market, financial product, trading strategy, backtest, or individual's trading does not guarantee future results or returns. Investors are fully responsible for any investment decisions they make. Such decisions should be based solely on an evaluation of their financial circumstances, investment objectives, risk tolerance, and liquidity needs.
My Scripts/Indicators/Ideas/Algos/Systems are only for educational purposes!
Search in scripts for "rma"

Dynamic Display for Max/Min MA Types with Fake-Out FilterDynamic Moving Average Max/Min Indicator with Step Line Break
**** select the setting to STEP LINE BREAK****
This indicator provides a powerful way to identify dynamic entry and stop-loss levels for both long and short trades. It calculates the maximum and minimum values of a selected moving average (MA) over a specified lookback period, adapting dynamically to market conditions. It features options for various MA types, including SMA, EMA, HMA, RMA, and DEMA, to suit different trading strategies and styles.
How It Works
1. Moving Average Selection: Choose the type of moving average (SMA, EMA, HMA, RMA, or DEMA) and its period (e.g., HMA 13).
2. Max/Min Calculation: The indicator calculates the highest and lowest values of the selected moving average over a specified lookback period (e.g., 5 candles).
3. Dynamic Plotting:
• Bullish Market: When the price breaks the Max MA level, the Min level is plotted, trailing upward as a potential stop-loss for long trades.
• Bearish Market: When the price breaks the Min MA level, the Max level is plotted, trailing downward as a potential stop-loss for short trades.
4. Fake-Out Filter: If a candle breaks the Max/Min level but closes within the range (indicating a fake-out), the plots do not switch. This can cause repainting during volatile conditions, so use caution in high-wick markets.
Features
• Customizable Inputs: Adjust MA type, period, lookback, and timeframe to suit your trading strategy.
• Multi-Timeframe Flexibility: Works on all timeframes, from micro-scalping on the 1-minute chart to swing trading on higher timeframes.
• Trend Confirmation: Provides clear indications of when to enter or exit based on dynamic levels.
• Risk Management: Highlights stop-loss levels that trail the trend, helping to lock in profits or limit losses.
Advantages
1. Clear Entry/Exit Points: Provides actionable signals for both long and short trades, with defined stop-loss locations.
2. Customizable for Any Style: Tailor the indicator to your product, timeframe, and trading approach (scalping or swing trading).
3. Trend-Focused Guidance: Helps avoid counter-trend trades by showing the dominant trend direction.
4. Adaptive to Market Conditions: The dynamic nature of the indicator allows it to respond to both trending and consolidating markets.
Limitations
1. Repainting During Fake-Outs: The indicator can repaint during volatile periods with long wicks, as it filters for fake-out candles. This may create noise in certain market conditions.
2. Optimization Required: The ideal settings for MA type, period, and lookback are dependent on the market profile and need to be fine-tuned by the trader.
3. Less Effective in Consolidation: In sideways or choppy markets, the indicator may produce less reliable signals unless adjusted for lower sensitivity.
Trading Tips
• Use this indicator to focus on trending markets, avoiding trades against the prevailing trend. For example, during an uptrend, only take long trades and avoid shorts.
• Consider having two configurations: one for trending markets and one for consolidating markets, switching between them as needed.
• Pair this indicator with volume analysis, price action, or other complementary tools to increase accuracy and reduce noise.
This indicator is designed to be both an entry and risk management tool, enabling traders to make informed decisions while keeping risks in check.

Uptrick: Arbitrage OpportunityINTRODUCTION
This script, titled Uptrick: Arbitrage Monitor, is a Pine Script™ indicator that aims to help traders quickly visualize potential arbitrage scenarios across multiple cryptocurrency exchanges. Arbitrage, in general, involves taking advantage of price differences for the same asset across different trading platforms. By comparing market prices of the same symbol on two user-selected exchanges, as well as scanning a broader list of exchanges, this script attempts to signal areas where you might want to buy on one exchange and sell on another. It includes various graphical tools, calculations, and an optional Automated Detection signal feature, allowing users to incorporate more advanced data scanning into their trading decisions. Keep in mind that transaction fees must also be considered in real-world scenarios. These fees can negate potential profits and, in some cases, result in a net loss.
PURPOSE
The primary purpose of this indicator is to show potential percentage differences between the same cryptocurrency trading pairs on two different exchanges. This difference is displayed numerically, visually as a line chart, and it is also tested against user-defined thresholds. With the threshold in place, buy and sell signals can be generated. The script allows you to quickly gauge how significant a spread is between two exchanges and whether that spread surpasses a specified threshold. This is particularly useful for arbitrage trading, where an asset is bought at a lower price on one exchange and sold at a higher price on another, capitalizing on price discrepancies. By identifying these opportunities, traders can potentially secure profits across different markets.
WHY IT WAS MADE
This script was developed to help traders who frequently look for arbitrage opportunities in the fast-paced cryptocurrency market. Cryptocurrencies sometimes experience quick price divergences across different exchanges. By having an automated approach that compares and displays prices, traders can spend less time manually tracking price discrepancies and more time focusing on actual trading strategies. The script was also made with user customization in mind, allowing you to toggle an optional Automated-based approach and choose different moving average methods to smooth out the displayed price difference.
WHAT ARBITRAGE IS
Arbitrage is the practice of buying an asset on one market (or exchange) at a lower price and simultaneously selling it on another market where the price is higher, thus profiting from the price difference. In cryptocurrency markets, these price differentials can occur across multiple exchanges due to varying liquidity, trading volume, geographic factors, or market inefficiencies. Though sometimes small, these differences can be exploited for profit when approached methodically.
EXPLANATION OF INPUTS
The script includes a variety of user inputs that help tailor the indicator to your specific needs:
1. Compared Symbol 1: This is the primary symbol you want to track (for example, BTCUSDT). Make sure it's written in all capital and make sure that it's price from that exchange is available on Tradingview.
2. Compare Exchange 1: The first exchange on which the script will request pricing data for the chosen symbol.
3. Compared to Exchange: The second exchange, used for the comparison.
4. Opportunity Threshold (%): A percentage threshold that, when exceeded by the price difference, can trigger buy or sell signals.
5. Plot Style?: Allows you to choose between plotting the raw difference line or a moving average of that difference.
6. MA Type: Select among SMA, EMA, WMA, RMA, or HMA for your moving average calculation.
7. MA Length: The lookback period for the selected moving average.
8. Plot Buy/Sell Signals?: Enables or disables the plotting of arrows signaling potential buy or sell zones based on threshold crossovers.
9. Automated Detection?: Toggles an additional multi-exchange data scan feature that calculates the highest and lowest prices for the specified symbol across a predefined list of exchanges.
CALCULATIONS
At its core, the script calculates price1 and price2 using the request.security function to fetch close prices from two selected exchanges. The difference is measured as (price1 - price2) / price2 * 100. This results in a percentage that indicates how much higher or lower price1 is relative to price2. Additionally, the script calculates a slope for this difference, which helps color the line depending on whether it is trending up or down. If you choose the moving average option, the script will replace the raw difference data with one of several moving average calculations (SMA, EMA, WMA, RMA, or HMA).
The script also includes an iterative scan of up to 15 different exchanges for Automated detection, collecting the highest and lowest price across all those exchanges. If the Automated option is enabled, it compiles a potential recommendation: buy at the cheapest exchange price and sell at the most expensive one. The difference across all exchanges (allExDiffPercent) is calculated using (highestPriceAll - lowestPriceAll) / lowestPriceAll * 100.
WHAT AUTOMATED DETECTION SIGNAL DOES
If enabled, the Automated detection feature scans all 15 supported exchanges for the specified symbol. It then identifies the exchange with the highest price and the exchange with the lowest price. The script displays a recommended action: buy on the lowest-exchange price and sell on the highest-exchange price. While called “Automated,” it is essentially a multi-exchange data query that automates a portion of research by consolidating different price points. It does not replace thorough analysis or guaranteed execution; it simply provides an overview of potential extremes.
WHAT ALL-EX-DIFF IS
The variable allExDiffPercent is used to show the overall difference between the highest price and the lowest price found among the 15 pre-chosen exchanges. This figure can be useful for anyone wanting a big-picture view of how large the arbitrage spread might be across the broader market.
SIGNALS AND HOW THEY ARE GENERATED
The script provides two main modes of signal generation:
1. Raw Difference Mode: If the user chooses “Use Normal Line,” the script compares the percentage difference of the two selected exchanges (price1 and price2) to the user-defined threshold. When the difference crosses under the positive threshold, a sell signal is displayed (red arrow). Conversely, when the difference crosses above the negative threshold, a buy signal is displayed (green arrow).
2. Moving Average Mode: If the user selects “Use Moving Average,” the script instead references the moving average values (maValue). The signals fire under similar conditions but use the average line to gauge whether the threshold has been crossed.
HOW TO USE THE INDICATOR
1. Add the script to your chart in TradingView.
2. In the script’s settings panel, configure the symbol you wish to compare (for example, BTCUSDT), choose the two exchanges you want to evaluate, and set your desired threshold.
3. Optionally, pick a moving average type and length if you prefer a smoother representation of the difference.
4. Enable or disable buy/sell signals according to your preference.
5. If you’d like to see potential extremes among a broader list of exchanges, enable Automated Detection. Keep in mind that this feature runs additional security requests, so it might slow down performance on weaker devices or if you already have many scripts running.
EXCHANGES TO USE
The script currently supports up to 15 exchanges: BYBIT, BINANCE, MEXC, BLOFIN, BITGET, OKX, KUCOIN, COINBASE, COINEX, PHEMEX, POLONIEX, GATEIO, BITSTAMP, and KRAKEN. You can choose any two of these for direct comparison, and if you enable the Automated detection, it will attempt to query them all to find extremes in real time.
VISUALS
The exchanges and current prices & differences are all plotted in the table while the colored line represents the difference in the price. The two thresholds colored red are where signals are generated. A cross below the upper threshold is a sell signal and a cross above the lower threshold is a buy signal. In the line at the bottom, purple is a negative slope and aqua is a positive slope.
LIMITATIONS AND POTENTIAL PROBLEMS
If you enable too many visual elements such as signals, additional lines, and the Automated-based scanning table, you may find that your chart becomes cluttered, or text might overlap. One workaround is to remove and reapply the indicator to refresh its display. You may also want to reduce the number of displayed table rows by disabling some features if your chart becomes too crowded. Sometimes there might be an error that the price of an asset is not available on an exchange, to fix this, go and select another exchange to compare it to, or if it happens in Automated detection, choose a different asset, ideally more widely spread.
UNIQUENESS
This indicator stands out due to its multifaceted approach: it doesn’t just look at two exchanges but optionally scans up to 15 exchanges in real time, presenting users with a much broader view of the market. The dual-mode system (raw difference vs. moving average) allows for both immediate, unfiltered signals and smoother, noise-reduced signals depending on user preference. By default, it introduces dynamic visual cues through color changes when the slope of the difference transitions upward or downward. The optional Automated detection, while not a deep learning system, adds a functional intelligence layer by collating extreme price points from multiple exchanges in one place, thereby streamlining the manual research process. This combination of features gives the script a unique edge in the TradingView ecosystem, catering equally to novices wanting a straightforward approach and to advanced users looking for an aggregated multi-exchange analysis.
CONCLUSION
Uptrick: Arbitrage Monitor is a versatile and customizable Pine Script™ indicator that highlights price differences for a specified symbol between two user-selected exchanges. Through signals, threshold-based alerts, and optional Automated detection across multiple exchanges, it aims to support traders in identifying potential arbitrage opportunities quickly and efficiently. This script makes no guarantees of profitability but can serve as a valuable tool to add to your trading toolkit. Always use caution when implementing arbitrage strategies, and be mindful of market risks, exchange fees, and latency.
ADDITIONAL DISCLOSURES
This script is provided for educational and informational purposes only. It does not constitute financial advice or a guarantee of performance. Users are encouraged to conduct thorough research and consider the inherent risks of arbitrage trading. Market conditions can change rapidly, and orders may fail to execute at desired prices, especially when large price discrepancies attract competition from other traders.

Golden & Death Cross with Re-Activation [By Oberlunar]🎄 Merry Christmas to All Traders! 🎄
Let me introduce you to a practical and customizable classic tool: the Golden & Death Cross with Re-Activation. This script is designed to help you navigate the markets with precision and adaptability.
Why Is This Script Important?
1. Customizable Moving Averages
You can choose from SMA, EMA, WMA, HMA, or RMA for both moving averages. This flexibility allows you to tailor the strategy to fit different markets and trading styles.
2. Smart Signal Handling
The script generates Golden Cross (LONG) and Death Cross (SHORT) signals while deactivating them automatically when the moving averages start to converge, avoiding unnecessary noise.
3. Reactivation Based on Distance Threshold
With the treshold parameter, signals are reactivated only when the moving averages move apart sufficiently, ensuring that the signals remain meaningful and not just random market noise.
What Are These Moving Averages?
SMA (Simple Moving Average),
EMA (Exponential Moving Average),
WMA (Weighted Moving Average),
HMA (Hull Moving Average),
RMA (Relative Moving Average)
Community Input
We invite you to test this script on various markets (forex, stocks, crypto) and share your insights:
Which moving average combination works best for EUR/USD?
How about BTC/USD?
Does the treshold make a noticeable difference?
Let us know in the comments!
Example Settings
MA 1 Type: HMA, Length: 21
MA 2 Type: HMA, Length: 200
Reactivation Threshold: 0.5
Experiment with it, and let us know your findings.
Wishing you a calm holiday season and a profitable new year ahead! 🎁
🎄 Merry Christmas and Happy Trading! 🎄

RSI Divergence + Sweep + Signal + Alerts Toolkit [TrendX_]The RSI Toolkit is a powerful set of tools designed to enhance the functionality of the traditional Relative Strength Index (RSI) indicator. By integrating advanced features such as Moving Averages, Divergences, and Sweeps, it helps traders identify key market dynamics, potential reversals, and newly-approach trading stragies.
The toolkit expands on standard RSI usage by incorporating features from smart money concepts (Just try to be creative 🤣 Hope you like it), providing a deeper understanding of momentum, liquidity sweeps, and trend reversals. It is suitable for RSI traders who want to make more informed and effective trading decisions.
💎 FEATURES
RSI Moving Average
The RSI Moving Average (RSI MA) is the moving average of the RSI itself. It can be customized to use various types of moving averages, including Simple Moving Average (SMA), Exponential Moving Average (EMA), Relative Moving Average (RMA), and Volume-Weighted Moving Average (VWMA).
The RSI MA smooths out the RSI fluctuations, making it easier to identify trends and crossovers. It helps traders spot momentum shifts and potential entry/exit points by observing when the RSI crosses above or below its moving average.
RSI Divergence
RSI Divergence identifies discrepancies between price action and RSI momentum. There are two types of divergences: Regular Divergence - Indicates a potential trend reversal; Hidden Divergence - Suggests the continuation of the current trend.
Divergence is a critical signal for spotting weakness or strength in a trend. Regular divergence highlights potential trend reversals, while hidden divergence confirms trend continuation, offering traders valuable insights into market momentum and possible trade setups.
RSI Sweep
RSI Sweep detects moments when the RSI removes liquidity from a trend structure by sweeping above or below the price at key momentum level crossing. These sweeps are overlaid on the RSI chart for easier visualized.
RSI Sweeps are significant because they indicate potential turning points in the market. When RSI sweeps occur: In an uptrend - they suggest buyers' momentum has peaked, possibly leading to a reversal; In a downtrend - they indicate sellers’ momentum has peaked, also hinting at a reversal.
(Note: This feature incorporates Liquidity Sweep concepts from Smart Money Concepts into RSI analysis, helping RSI traders identify areas where liquidity has been removed, which often precedes a trend reversal)
🔎 BREAKDOWN
RSI Moving Average
How MA created: The RSI value is calculated first using the standard RSI formula. The MA is then applied to the RSI values using the trader’s chosen type of MA (SMA, EMA, RMA, or VWMA). The flexibility to choose the type of MA allows traders to adjust the smoothing effect based on their trading style.
Why use MA: RSI by itself can be noisy and difficult to interpret in volatile markets. Applying moving average would provide a smoother, more reliable view of RSI trends.
RSI Divergence
How Regular Divergence created: Regular Divergence is detected when price forms HIGHER highs while RSI forms LOWER highs (bearish divergence) or when price forms LOWER lows while RSI forms HIGHER lows (bullish divergence).
How Hidden Divergence created: Hidden Divergence is identified when price forms HIGHER lows while RSI forms LOWER lows (bullish hidden divergence) or when price forms LOWER highs while RSI forms HIGHER highs (bearish hidden divergence).
Why use Divergence: Divergences provide early warning signals of a potential trend change. Regular divergence helps traders anticipate reversals, while hidden divergence supports trend continuation, enabling traders to align their trades with market momentum.
RSI Sweep
How Sweep created: Trend Structure Shift are identified based on the RSI crossing key momentum level of 50. To track these sweeps, the indicator pinpoints moments when liquidity is removed from the Trend Structure Shift. This is a direct application of Liquidity Sweep concepts used in Smart Money theories, adapted to RSI.
Why use Sweep: RSI Sweeps are created to help traders detect potential trend reversals. By identifying areas where momentum has exhausted during a certain trend direction, the indicator highlights opportunities for traders to enter trades early in a reversal or continuation phase.
⚙️ USAGES
Divergence + Sweep
This is an example of combining Devergence & Sweep in BTCUSDT (1 hour)
Wait for a divergence (regular or hidden) to form on the RSI. After the divergence is complete, look for a sweep to occur. A potential entry might be formed at the end of the sweep.
Divergences indicate a potential trend change, but confirmation is required to ensure the setup is valid. The RSI Sweep provides that confirmation by signaling a liquidity event, increasing the likelihood of a successful trade.
Sweep + MA Cross
This is an example of combining Devergence & Sweep in BTCUSDT (1 hour)
Wait for an RSI Sweep to form then a potential entry might be formed when the RSI crosses its MA.
The RSI Sweep highlights a potential turning point in the market. The MA cross serves as additional confirmation that momentum has shifted, providing a more reliable and more potential entry signal for trend continuations.
DISCLAIMER
This indicator is not financial advice, it can only help traders make better decisions. There are many factors and uncertainties that can affect the outcome of any endeavor, and no one can guarantee or predict with certainty what will occur. Therefore, one should always exercise caution and judgment when making decisions based on past performance.

AadTrend [InvestorUnknown]The AadTrend indicator is an experimental trading tool that combines a user-selected moving average with the Average Absolute Deviation (AAD) from this moving average. This combination works similarly to the Supertrend indicator but offers additional flexibility and insights. In addition to generating Long and Short signals, the AadTrend indicator identifies RISK-ON and RISK-OFF states for each trade direction, highlighting areas where taking on more risk may be considered.
Core Concepts and Features
Moving Average (User-Selected Type)
The indicator allows users to select from various types of moving averages to suit different trading styles and market conditions:
Simple Moving Average (SMA)
Exponential Moving Average (EMA)
Hull Moving Average (HMA)
Double Exponential Moving Average (DEMA)
Triple Exponential Moving Average (TEMA)
Relative Moving Average (RMA)
Fractal Adaptive Moving Average (FRAMA)
Average Absolute Deviation (AAD)
The Average Absolute Deviation measures the average distance between each data point and the mean, providing a robust estimation of volatility.
aad(series float src, simple int length, simple string avg_type) =>
avg = // Moving average as selected by the user
abs_deviations = math.abs(src - avg)
ta.sma(abs_deviations, length)
This provides a volatility measure that adapts to recent market conditions.
Combining Moving Average and AAD
The indicator creates upper and lower bands around the moving average using the AAD, similar to how the Supertrend indicator uses Average True Range (ATR) for its bands.
AadTrend(series float src, simple int length, simple float aad_mult, simple string avg_type) =>
// Calculate AAD (volatility measure)
aad_value = aad(src, length, avg_type)
// Calculate the AAD-based moving average by scaling the price data with AAD
avg = switch avg_type
"SMA" => ta.sma(src, length)
"EMA" => ta.ema(src, length)
"HMA" => ta.hma(src, length)
"DEMA" => ta.dema(src, length)
"TEMA" => ta.tema(src, length)
"RMA" => ta.rma(src, length)
"FRAMA" => ta.frama(src, length)
avg_p = avg + (aad_value * aad_mult)
avg_m = avg - (aad_value * aad_mult)
var direction = 0
if ta.crossover(src, avg_p)
direction := 1
else if ta.crossunder(src, avg_m)
direction := -1
A chart displaying the moving average with upper and lower AAD bands enveloping the price action.
Signals and Trade States
1. Long and Short Signals
Long Signal: Generated when the price crosses above the upper AAD band,
Short Signal: Generated when the price crosses below the lower AAD band.
2. RISK-ON and RISK-OFF States
These states provide additional insight into the strength of the current trend and potential opportunities for taking on more risk.
RISK-ON Long: When the price moves significantly above the upper AAD band after a Long signal.
RISK-OFF Long: When the price moves back below the upper AAD band, suggesting caution.
RISK-ON Short: When the price moves significantly below the lower AAD band after a Short signal.
RISK-OFF Short: When the price moves back above the lower AAD band.
Highlighted areas on the chart representing RISK-ON and RISK-OFF zones for both Long and Short positions.
A chart showing the filled areas corresponding to trend directions and RISK-ON zones
Backtesting and Performance Metrics
While the AadTrend indicator focuses on generating signals and highlighting risk areas, it can be integrated with backtesting frameworks to evaluate performance over historical data.
Integration with Backtest Library:
import InvestorUnknown/BacktestLibrary/1 as backtestlib
Customization and Calibration
1. Importance of Calibration
Default Settings Are Experimental: The default parameters are not optimized for any specific market condition or asset.
User Calibration: Traders should adjust the length, aad_mult, and avg_type parameters to align the indicator with their trading strategy and the characteristics of the asset being analyzed.
2. Factors to Consider
Market Volatility: Higher volatility may require adjustments to the aad_mult to avoid false signals.
Trading Style: Short-term traders might prefer faster-moving averages like EMA or HMA, while long-term traders might opt for SMA or FRAMA.
Alerts and Notifications
The AadTrend indicator includes built-in alert conditions to notify traders of significant market events:
Long and Short Alerts:
alertcondition(long_alert, "LONG (AadTrend)", "AadTrend flipped ⬆LONG⬆")
alertcondition(short_alert, "SHORT (AadTrend)", "AadTrend flipped ⬇Short⬇")
RISK-ON and RISK-OFF Alerts:
alertcondition(risk_on_long, "RISK-ON LONG (AadTrend)", "RISK-ON LONG (AadTrend)")
alertcondition(risk_off_long, "RISK-OFF LONG (AadTrend)", "RISK-OFF LONG (AadTrend)")
alertcondition(risk_on_short, "RISK-ON SHORT (AadTrend)", "RISK-ON SHORT (AadTrend)")
alertcondition(risk_off_short, "RISK-OFF SHORT (AadTrend)", "RISK-OFF SHORT (AadTrend)")
Important Notes and Disclaimer
Experimental Nature: The AadTrend indicator is experimental and should be used with caution.
No Guaranteed Performance: Past performance is not indicative of future results. Backtesting results may not reflect real trading conditions.
User Responsibility: Traders and investors should thoroughly test and calibrate the indicator settings before applying it to live trading.
Risk Management: Always use proper risk management techniques, including stop-loss orders and position sizing.

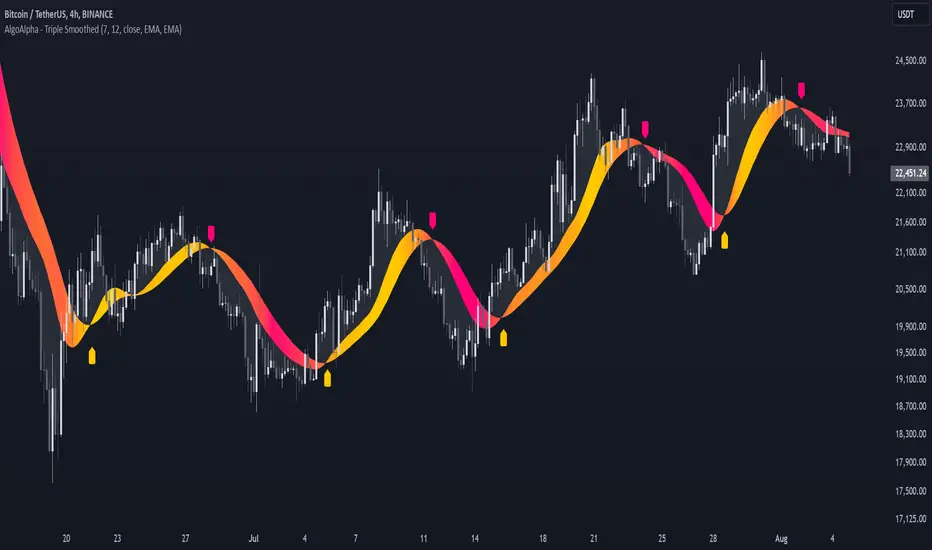
Triple Smoothed Signals [AlgoAlpha]Introducing the Triple Smoothed Signals indicator by AlgoAlpha, a powerful tool designed to help traders identify trend direction and market momentum with greater accuracy. By applying triple smoothing techniques to your chosen data source, this indicator filters out market noise, allowing you to focus on significant price movements. Perfect for traders looking to enhance their technical analysis and gain an edge in the markets.
Key Features
🎨 Customizable Moving Averages : Choose between EMA, SMA, RMA, or WMA for both the triple smoothing and the signal line to tailor the indicator to your trading style.
🛠 Adjustable Smoothing Lengths : Configure the main smoothing length and signal length to fit different timeframes and market conditions.
🌈 Dynamic Color Fills : Visual gradients and fills highlight trend strength and direction, making chart analysis more intuitive.
🔔 Alerts : Set alerts for bullish and bearish crossover signals to stay ahead of market moves without constant chart monitoring.
📈 Clear Signal Visualization : Bullish and bearish signals are plotted directly on your chart for easy interpretation and timely decision-making.
Quick Guide to Using the Triple Smoothed Signals Indicator
🛠 Add the Indicator : Add the indicator to your TradingView chart by clicking on the star icon to add it to your favorites. Customize the settings such as the main smoothing length, signal length, data source, and moving average types to match your trading strategy.
📊 Market Analysis : Monitor the crossovers between the triple smoothed moving average and the signal line. A bullish signal is generated when the signal line crosses under the triple smoothed MA, indicating a potential upward trend. Conversely, a bearish signal occurs when the signal line crosses over the triple smoothed MA, suggesting a possible downward trend.
🔔 Alerts : Enable notifications for reversal signals and trend shifts to stay informed about market movements without constantly monitoring the chart.
How It Works
The Triple Smoothed Signals indicator enhances trend detection by applying a triple smoothing process to your selected data source using the moving average type of your choice (EMA, SMA, RMA, or WMA). This triple smoothed moving average (v1) effectively reduces short-term fluctuations and noise, revealing the underlying market trend. A signal line (v2) is then calculated by smoothing the triple smoothed MA with a separate moving average, further refining the signal. The indicator calculates the normalized distance between the triple smoothed MA and the signal line over a specified period, which is used to create dynamic color gradients and fills on the chart. These visual elements provide immediate insight into trend strength and direction. Bullish and bearish signals are generated based on the crossovers between the signal line and the triple smoothed MA, and are plotted directly on the chart along with customizable alerts to assist traders in making timely decisions.
Crypto Wallets Profitability & Performance [LuxAlgo]The Crypto Wallets Profitability & Performance indicator provides a comprehensive view of the financial status of cryptocurrency wallets by leveraging on-chain data from IntoTheBlock. It measures the percentage of wallets profiting, losing, or breaking even based on current market prices.
Additionally, it offers performance metrics across different timeframes, enabling traders to better assess market conditions.
This information can be crucial for understanding market sentiment and making informed trading decisions.
🔶 USAGE
🔹 Wallets Profitability
This indicator is designed to help traders and analysts evaluate the profitability of cryptocurrency wallets in real-time. It aggregates data gathered from the blockchain on the number of wallets that are in profit, loss, or breaking even and presents it visually on the chart.
Breaking even line demonstrates how realized gains and losses have changed, while the profit and the loss monitor unrealized gains and losses.
The signal line helps traders by providing a smoothed average and highlighting areas relative to profiting and losing levels. This makes it easier to identify and confirm trading momentum, assess strength, and filter out market noise.
🔹 Profitability Meter
The Profitability Meter is an alternative display that visually represents the percentage of wallets that are profiting, losing, or breaking even.
🔹 Performance
The script provides a view of the financial health of cryptocurrency wallets, showing the percentage of wallets in profit, loss, or breaking even. By combining these metrics with performance data across various timeframes, traders can gain valuable insights into overall wallet performance, assess trend strength, and identify potential market reversals.
🔹 Dashboard
The dashboard presents a consolidated view of key statistics. It allows traders to quickly assess the overall financial health of wallets, monitor trend strength, and gauge market conditions.
🔶 DETAILS
🔹 The Chart Occupation Option
The chart occupation option adjusts the occupation percentage of the chart to balance the visibility of the indicator.
🔹 The Height in Performance Options
Crypto markets often experience significant volatility, leading to rapid and substantial gains or losses. Hence, plotting performance graphs on top of the chart alongside other indicators can result in a cluttered display. The height option allows you to adjust the plotting for balanced visibility, ensuring a clearer and more organized chart.
🔶 SETTINGS
The script offers a range of customizable settings to tailor the analysis to your trading needs.
Chart Occupation %: Adjust the occupation percentage of the chart to balance the visibility of the indicator.
🔹 Profiting Wallets
Profiting Percentage: Toggle to display the percentage of wallets in profit.
Smoothing: Adjust the smoothing period for the profiting percentage line.
Signal Line: Choose a signal line type (SMA, EMA, RMA, or None) to overlay on the profiting percentage.
🔹 Losing Wallets
Losing Percentage: Toggle to display the percentage of wallets in loss.
Smoothing: Adjust the smoothing period for the losing percentage line.
Signal Line: Choose a signal line type (SMA, EMA, RMA, or None) to overlay on the losing percentage.
🔹 Breaking Even Wallets
Breaking-Even Percentage: Toggle to display the percentage of wallets breaking even.
Smoothing: Adjust the smoothing period for the breaking-even percentage line.
🔹 Profitability Meter
Profitability Meter: Enable or disable the meter display, set its width, and adjust the offset.
🔹 Performance
Performance Metrics: Choose the timeframe for performance metrics (Day to Date, Week to Date, etc.).
Height: Adjust the height of the chart visuals to balance the visibility of the indicator.
🔹 Dashboard
Block Profitability Stats: Toggle the display of profitability stats.
Performance Stats: Toggle the display of performance stats.
Dashboard Size and Position: Customize the size and position of the performance dashboard on the chart.
🔶 RELATED SCRIPTS
Market-Sentiment-Technicals
Multi-Chart-Widget

Systematic Investment Tracker by Ceyhun Gonul### English Description
**Systematic Investment Tracker with Enhanced Features**
This script, titled **Systematic Investment Tracker with Enhanced Features**, is a TradingView tool designed to support systematic investments across different market conditions. It provides traders with two customizable investment strategies — **Continuous Buying** and **Declining Buying** — and includes advanced dynamic investment adjustment features for each.
#### Detailed Explanation of Script Features and Originality
1. **Two Investment Strategies**:
- **Continuous Buying**: This strategy performs purchases consistently at each interval, as set by the user, regardless of market price changes. It follows the principle of dollar-cost averaging, allowing users to build an investment position over time.
- **Declining Buying**: Unlike Continuous Buying, this strategy triggers purchases only when the asset's price has declined from the previous interval's closing price. This approach helps users capitalize on lower price points, potentially improving average costs during downward trends.
2. **Dynamic Investment Adjustment**:
- For both strategies, the script includes a **Dynamic Investment Adjustment** feature. If enabled, this feature increases the purchasing amount by 50% if the current price has fallen by a specific user-defined percentage relative to the previous price. This allows users to accumulate a larger position when the asset is declining, which may benefit long-term cost-averaging strategies.
3. **Customizable Time Frames**:
- Users can specify a **start and end date** for investment, allowing them to restrict or backtest strategies within a specific timeframe. This feature is valuable for evaluating strategy performance over specific market cycles or historical periods.
4. **Graphical Indicators and Labels**:
- The script provides graphical labels on the chart that display purchase points. These indicators help users visualize their investment entries based on the strategy selected.
- A summary **performance label** is also displayed, providing real-time updates on the total amount spent, accumulated quantity, average cost, portfolio value, and profit percentage for each strategy.
5. **Language Support**:
- The script includes English and Turkish language options. Users can toggle between these languages, allowing the summary label text and descriptions to be displayed in their preferred language.
6. **Performance Comparison Table**:
- An optional **Performance Comparison Table** is available, offering a side-by-side analysis of net profit, total investment, and profit percentage for both strategies. This comparison table helps users assess which strategy has yielded better returns, providing clarity on each approach's effectiveness under the chosen parameters.
#### How the Script Works and Its Uniqueness
This closed-source script brings together two established investment strategies in a single, dynamic tool. By integrating continuous and declining purchase strategies with advanced settings for dynamic investment adjustment, the script offers a powerful, flexible tool for both passive and active investors. The design of this script provides unique benefits:
- Enables automated, systematic investment tracking, allowing users to build positions gradually.
- Empowers users to leverage declines through dynamic adjustments to optimize average cost over time.
- Presents an easy-to-read performance label and table, enabling an efficient and transparent performance comparison for informed decision-making.
---
### Türkçe Açıklama
**Gelişmiş Özellikli Sistematik Yatırım Takipçisi**
**Gelişmiş Özellikli Sistematik Yatırım Takipçisi** adlı bu TradingView scripti, çeşitli piyasa koşullarında sistematik yatırım stratejilerini desteklemek üzere tasarlanmış bir araçtır. Script, kullanıcıya iki özelleştirilebilir yatırım stratejisi — **Sürekli Alım** ve **Düşen Alım** — ve her strateji için gelişmiş dinamik yatırım ayarlama seçenekleri sunar.
#### Script Özelliklerinin Detaylı Açıklaması ve Özgünlük
1. **İki Yatırım Stratejisi**:
- **Sürekli Alım**: Bu strateji, fiyat değişimlerine bakılmaksızın kullanıcının belirlediği her aralıkta sabit bir miktar yatırım yapar. Bu yaklaşım, uzun vadede pozisyonu kademeli olarak oluşturmak isteyenler için idealdir.
- **Düşen Alım**: Sürekli Alım’ın aksine, bu strateji yalnızca fiyat bir önceki aralığın kapanış fiyatına göre düştüğünde alım yapar. Bu yöntem, yatırımcıların daha düşük fiyatlardan alım yaparak ortalama maliyeti potansiyel olarak iyileştirmelerine yardımcı olur.
2. **Dinamik Yatırım Ayarlaması**:
- Her iki strateji için de **Dinamik Yatırım Ayarlaması** özelliği bulunmaktadır. Bu özellik aktif edildiğinde, mevcut fiyatın bir önceki fiyata göre kullanıcı tarafından belirlenen bir yüzde oranında düşmesi durumunda alım miktarını %50 artırır. Bu durum, uzun vadede maliyet ortalaması stratejilerine katkıda bulunur.
3. **Özelleştirilebilir Tarih Aralığı**:
- Kullanıcılar, yatırımı belirli bir tarih aralığında sınırlandırmak veya test etmek için bir **başlangıç ve bitiş tarihi** belirleyebilir. Bu özellik, strateji performansını geçmiş piyasa döngüleri veya belirli dönemlerde değerlendirmek için kullanışlıdır.
4. **Grafiksel İşaretleyiciler ve Etiketler**:
- Script, grafik üzerinde alım noktalarını gösteren işaretleyiciler sağlar. Bu görsel göstergeler, kullanıcıların seçilen stratejiye göre yatırım girişlerini görselleştirmesine yardımcı olur.
- Ayrıca, her strateji için harcanan toplam tutar, biriken miktar, ortalama maliyet, portföy değeri ve kâr yüzdesi gibi bilgileri gerçek zamanlı olarak gösteren bir **performans etiketi** sunar.
5. **Dil Desteği**:
- Script, İngilizce ve Türkçe dillerini desteklemektedir. Kullanıcılar, performans etiketi metninin ve açıklamalarının tercih ettikleri dilde görüntülenmesi için dil seçimini yapabilir.
6. **Performans Karşılaştırma Tablosu**:
- İsteğe bağlı olarak kullanılabilen bir **Performans Karşılaştırma Tablosu**, her iki strateji için net kâr, toplam yatırım ve kâr yüzdesi gibi bilgileri yan yana analiz eder. Bu tablo, kullanıcıların hangi stratejinin daha yüksek getiri sağladığını değerlendirmesine yardımcı olur.
#### Scriptin Çalışma Prensibi ve Özgünlüğü
Bu script, iki yatırım stratejisini gelişmiş bir araçta birleştirir. Sürekli ve düşen fiyatlara dayalı alım stratejilerini dinamik yatırım ayarlama özelliğiyle entegre ederek yatırımcılar için güçlü ve esnek bir çözüm sunar. Script’in tasarımı aşağıdaki benzersiz faydaları sağlamaktadır:
- Otomatik, sistematik yatırım takibi yaparak kullanıcıların pozisyonlarını kademeli olarak oluşturmalarına olanak tanır.
- Dinamik ayarlama ile düşüşlerden yararlanarak zaman içinde ortalama maliyeti optimize etme olanağı sağlar.
- Her iki stratejinin performansını basit ve anlaşılır bir şekilde karşılaştıran etiket ve tablo ile verimli bir performans değerlendirmesi sunar.

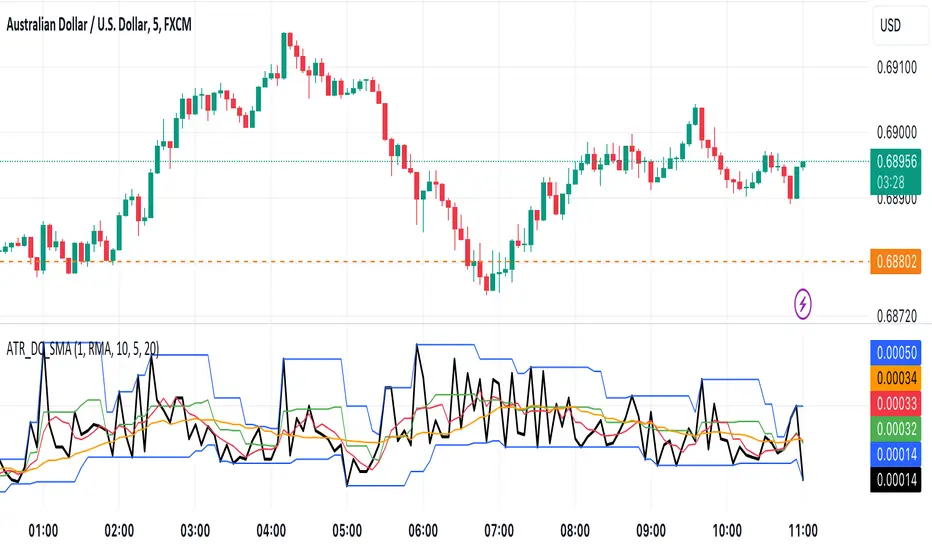
ATR with Donchian Channels and SMAsThis script combines the Average True Range (ATR), Donchian Channels, and Simple Moving Averages (SMAs) to provide a comprehensive tool for volatility and trend analysis.
Key Components:
ATR Calculation: The ATR is used to measure market volatility. It is calculated as a moving average of the true range over a specified length, which you can customize using different smoothing methods: RMA, SMA, EMA, or WMA. ATR helps identify periods of high and low volatility, giving insights into potential breakout or consolidation phases in the market.
Donchian Channels on ATR: The Donchian Channels are calculated based on the highest and lowest values of the ATR over a user-defined period. The upper and lower bands provide a volatility range, and the middle line represents the average of the two. This can help visualize the range of market volatility and detect possible trend reversals or continuations.
SMAs on ATR: Two Simple Moving Averages (SMA) are applied to the ATR values. These SMAs act as a smoothed version of the ATR, providing additional insight into volatility trends. By adjusting the length of these SMAs, you can track short-term and long-term volatility movements, helping in decision-making for potential entries and exits.
Inputs:
ATR Length: Set the length for calculating the ATR.
Smoothing Method: Choose from RMA, SMA, EMA, or WMA for smoothing the ATR calculation.
Donchian Channel Length: Set the length for calculating the highest and lowest ATR values for Donchian Channels.
SMA Lengths: Two adjustable lengths for applying SMAs to the ATR.
Visualization:
ATR Plot: The ATR is plotted in red, allowing you to see the market's volatility at a glance.
Donchian Channels: Blue lines represent the upper and lower bands, while the green line represents the middle line of the Donchian Channels, helping you visualize the volatility range.
SMAs: Two SMAs (green and orange) are plotted to smooth out the ATR and identify trends in volatility.
Use Cases:
Breakout Detection: High ATR values breaking out of the Donchian Channels may signal increased volatility and a potential breakout.
Trend Analysis: SMAs on ATR help smooth volatility trends, aiding in determining if the market is entering a more volatile or stable period.
Stop-Loss Placement: ATR and Donchian Channels can be used to set dynamic stop-loss levels based on market volatility.
This script is versatile and can be used across different asset classes, such as stocks, forex, crypto, and commodities. It is especially useful for traders who want to incorporate volatility into their trading strategies for better risk management and trend detection.
$TUBR: Stop Loss IndicatorATR-Based Stop Loss Indicator for TradingView by The Ultimate Bull Run Community: TUBR
**Overview**
The ATR-Based Stop Loss Indicator is a custom tool designed for traders using TradingView. It helps you determine optimal stop loss levels by leveraging the Average True Range (ATR), a popular measure of market volatility. By adapting to current market conditions, this indicator aims to minimize premature stop-outs and enhance your risk management strategy.
---
**Key Features**
- **Dynamic Stop Loss Levels**: Calculates stop loss prices based on the ATR, providing both long and short stop loss suggestions.
- **Customizable Parameters**: Adjust the ATR period, multiplier, and smoothing method to suit your trading style and the specific instrument you're trading.
- **Visual Aids**: Plots stop loss lines directly on your chart for easy visualization.
- **Alerts and Notifications** (Optional): Set up alerts to notify you when the price approaches or hits your stop loss levels.
---
**Understanding the Indicator**
1. **Average True Range (ATR)**:
- **What It Is**: ATR measures market volatility by calculating the average range between high and low prices over a specified period.
- **Why It's Useful**: A higher ATR indicates higher volatility, which can help you set stop losses that accommodate market fluctuations.
2. **ATR Multiplier**:
- **Purpose**: Determines how far your stop loss is placed from the current price based on the ATR.
- **Example**: An ATR multiplier of 1.5 means the stop loss is set at 1.5 times the ATR away from the current price.
3. **Smoothing Methods**:
- **Options**: Choose from RMA (default), SMA, EMA, WMA, or Hull MA.
- **Effect**: Different smoothing methods can make the ATR more responsive or smoother, affecting where the stop loss is placed.
---
**How the Indicator Works**
- **Long Stop Loss Calculation**:
- **Formula**: `Long Stop Loss = Close Price - (ATR * ATR Multiplier)`
- **Purpose**: For long positions, the stop loss is set below the current price to protect against downside risk.
- **Short Stop Loss Calculation**:
- **Formula**: `Short Stop Loss = Close Price + (ATR * ATR Multiplier)`
- **Purpose**: For short positions, the stop loss is set above the current price to protect against upside risk.
- **Plotting on the Chart**:
- **Green Line**: Represents the suggested stop loss level for long positions.
- **Red Line**: Represents the suggested stop loss level for short positions.
---
**How to Use the Indicator**
1. **Adding the Indicator to Your Chart**:
- **Step 1**: Copy the PineScript code of the indicator.
- **Step 2**: In TradingView, click on **Pine Editor** at the bottom of the platform.
- **Step 3**: Paste the code into the editor and click **Add to Chart**.
- **Step 4**: The indicator will appear on your chart with the default settings.
2. **Adjusting the Settings**:
- **ATR Period**:
- **Definition**: Number of periods over which the ATR is calculated.
- **Adjustment**: Increase for a smoother ATR; decrease for a more responsive ATR.
- **ATR Multiplier**:
- **Definition**: Factor by which the ATR is multiplied to set the stop loss distance.
- **Adjustment**: Increase to widen the stop loss (less likely to be hit); decrease to tighten the stop loss.
- **Smoothing Method**:
- **Options**: RMA, SMA, EMA, WMA, Hull MA.
- **Adjustment**: Experiment to see which method aligns best with your trading strategy.
- **Display Options**:
- **Show Long Stop Loss**: Toggle to display or hide the long stop loss line.
- **Show Short Stop Loss**: Toggle to display or hide the short stop loss line.
3. **Interpreting the Indicator**:
- **Long Positions**:
- **Action**: Set your stop loss at the value indicated by the green line when entering a long trade.
- **Short Positions**:
- **Action**: Set your stop loss at the value indicated by the red line when entering a short trade.
- **Adjusting Stop Losses**:
- **Trailing Stops**: You may choose to adjust your stop loss over time, moving it in the direction of your trade as the ATR-based stop loss levels change.
4. **Implementing in Your Trading Strategy**:
- **Risk Management**:
- **Position Sizing**: Use the stop loss distance to calculate your position size based on your risk tolerance.
- **Consistency**: Apply the same settings consistently to maintain discipline.
- **Combining with Other Indicators**:
- **Enhance Decision-Making**: Use in conjunction with trend indicators, support and resistance levels, or other technical analysis tools.
- **Alerts Setup** (If included in the code):
- **Purpose**: Receive notifications when the price approaches or hits your stop loss level.
- **Configuration**: Set up alerts in TradingView based on the alert conditions defined in the indicator.
---
**Benefits of Using This Indicator**
- **Adaptive Risk Management**: By accounting for current market volatility, the indicator helps prevent setting stop losses that are too tight or too wide.
- **Minimize Premature Stop-Outs**: Reduces the likelihood of being stopped out due to normal price fluctuations.
- **Flexibility**: Customizable settings allow you to tailor the indicator to different trading instruments and timeframes.
- **Visualization**: Clear visual representation of stop loss levels aids in quick decision-making.
---
**Things to Consider**
- **Market Conditions**:
- **High Volatility**: Be cautious as ATR values—and thus stop loss distances—can widen, increasing potential losses.
- **Low Volatility**: Tighter stop losses may increase the chance of being stopped out by minor price movements.
- **Backtesting and Optimization**:
- **Historical Analysis**: Test the indicator on past data to evaluate its effectiveness and adjust settings accordingly.
- **Continuous Improvement**: Regularly reassess and fine-tune the parameters to adapt to changing market conditions.
- **Risk Per Trade**:
- **Alignment with Risk Tolerance**: Ensure the stop loss level keeps potential losses within your acceptable risk per trade (e.g., 1-2% of your trading capital).
- **Emotional Discipline**:
- **Stick to Your Plan**: Avoid making impulsive changes to your stop loss levels based on emotions rather than analysis.
---
**Example Usage Scenario**
1. **Setting Up a Long Trade**:
- **Entry Price**: $100
- **ATR Value**: $2
- **ATR Multiplier**: 1.5
- **Calculated Stop Loss**: $100 - ($2 * 1.5) = $97
- **Action**: Place a stop loss order at $97.
2. **During the Trade**:
- **Price Increases to $105**
- **ATR Remains at $2**
- **New Stop Loss Level**: $105 - ($2 * 1.5) = $102
- **Action**: Move your stop loss up to $102 to lock in profits.
---
**Final Tips**
- **Documentation**: Keep a trading journal to record your trades, stop loss levels, and observations for future reference.
- **Education**: Continuously educate yourself on risk management and technical analysis to enhance your trading skills.
- **Support**: Engage with trading communities or seek professional advice if you're unsure about implementing the indicator effectively.
---
**Conclusion**
The ATR-Based Stop Loss Indicator is a valuable tool for traders looking to enhance their risk management by setting stop losses that adapt to market volatility. By integrating this indicator into your trading routine, you can improve your ability to protect capital and potentially increase profitability. Remember to use it as part of a comprehensive trading strategy, and always adhere to sound risk management principles.
---
**How to Access the Indicator**
To start using the ATR-Based Stop Loss Indicator, follow these steps:
1. **Obtain the Code**: Copy the PineScript code provided for the indicator.
2. **Create a New Indicator in TradingView**:
- Open TradingView and navigate to the **Pine Editor**.
- Paste the code into the editor.
- Click **Save** and give your indicator a name.
3. **Add to Chart**: Click **Add to Chart** to apply the indicator to your current chart.
4. **Customize Settings**: Adjust the input parameters to suit your preferences and start integrating the indicator into your trading strategy.
---
**Disclaimer**
Trading involves significant risk, and it's possible to lose all your capital. The ATR-Based Stop Loss Indicator is a tool to aid in decision-making but does not guarantee profits or prevent losses. Always conduct your own analysis and consider seeking advice from a financial professional before making trading decisions.

Pressure Zones with MA [SYNC & TRADE]Description:
The "Pressure Zones with MA " indicator is designed to analyze the pressure of buyers and sellers on the market, as well as to identify areas of increased activity. When designing it, the main task was to see manipulations on the market, when the power of sellers or the power of buyers is in a sideways trend or falling, and the opposite is growing.
Here is a good example. The power of sellers is in a narrow sideways trend, and sales are increasing very aggressively. The power of buyers is in a gray block with the inscription "range". Then we see the fading of the power of sellers and buyers furiously pounce on the asset that has fallen in price.
Here are the main aspects of its operation and use:
First, turn off the moving averages in the indicator settings, on the "style" tab. Choose your favorite asset, which you understand well and know all its ups and downs. I want you to see a clean chart, so that you can be imbued with a new idea, you need to watch it. This is a proprietary indicator and I understand that it does not have the inscription “buy” / “sell”, but believe me, if you pay attention, you will see its strength. I usually add functionality later, but the light code and visualization remain preferable in the first version.
Purpose:
The indicator helps to determine the strength of buyers and sellers in the market.
It visualizes zones where the pressure of buyers or sellers prevails.
Additionally displays moving averages (MA) for data smoothing.
Main components:
Buyer strength chart (blue line)
Seller strength chart (red line)
Moving averages for buyer and seller strength
Threshold line for defining zones
Indicator settings:
Period: defines the base period for calculations (default 89)
Threshold: sets the level for defining pressure zones (from 0 to 2, default 0.8)
MA type for purchases and sales: select the type of moving average (SMA, EMA, RMA, WMA, VWMA, HMA)
MA length for purchases and sales: period for calculating moving averages
Colors for uptrends and downtrends of MA
Moving averages:
Help smooth out data and identify trends
The direction of the MA (up or down) further confirms the current trend
The color of the MA changes depending on the direction (blue for up, red for down)
Now you can turn them on and see how they help in understanding where one or another force is weakening. It is in this case that we see the intersection of forces and the sellers' force is moving aggressively upward. Also, according to the moving average, we see the weakening of the sellers' force. The buyers' force was in the sideways range and then switched on to buy out and also according to the moving average, it is clear where the main interest in purchases disappeared.
Use:
Observe the strength of buyers and sellers relative to each other. They can move simultaneously in one direction, this is regarded as balance
can move in different directions and this will strengthen the upward force of sellers or buyers
You may also notice that the movement of one of the forces will be in a narrow range and the second will grow strongly - this is manipulation or trading without resistance.
You can also play with the threshold line, but it is not the main thing here. I disabled this function in the code.
// Display zones
//bgcolor(buy_zone ? color.new(color.blue, 90) : na)
//bgcolor(sell_zone ? color.new(color.red, 90) : na)
If you want to enable it, copy it instead
// Display zones
bgcolor(buy_zone ? color.new(color.blue, 90) : na)
bgcolor(sell_zone ? color.new(color.red, 90) : na)
Pay attention to the intersection of forces.
Use crossovers of force lines and their moving averages as potential signals
Combine the indicator signals with other technical analysis tools for confirmation
Limitations:
Requires customization of parameters for a specific trading instrument and timeframe
The indicator should not be used as the only tool for making trading decisions
Remember that this indicator provides additional information for market analysis, but is not a guarantee of successful trades. Always combine it with other analysis methods and follow risk management rules.
Описание:
Индикатор "Pressure Zones with MA " предназначен для анализа давления покупателей и продавцов на рынке, а также для определения зон повышенной активности. При его проектировании основная задача была увидеть манипуляции на рынке, когда сила продавцов или сила покупателей стоит в боковике или падает, а противоположная растет.
Вот хороший пример. Сила продавцов стоит в узком боковике, а продажи очень агрессивно усиливаются. Сила покупателей в сером блоке с надписью “range”. Потом мы видим затухание силы продавцов и покупателей яростно накидываются на подешевевший актив.
Вот основные аспекты его работы и использования:
Для начала отключите средние скользящие в настройках индикатора, на закладке “стиль”. Выберите свой любимый актив, в котором вы хорошо разбираетесь и знаете его все взлеты и падения. Я хочу чтобы вы увидели чистый график, для того чтобы вы могли проникнутся новой идеей нужно понаблюдать за ним. Это авторский индикатор и я понимаю что на нем нет надписи “купить” / “продать”, но поверьте уделив свое внимание вы увидите его силу. Я обычно потом добавляю функционал но легкий код и визуализация, в первом варианте остается предпочтительней.
Назначение:
Индикатор помогает определить силу покупателей и продавцов на рынке.
Он визуализирует зоны, где преобладает давление покупателей или продавцов.
Дополнительно отображает скользящие средние (MA) для сглаживания данных.
Основные компоненты:
График силы покупателей (синяя линия)
График силы продавцов (красная линия)
Скользящие средние для силы покупателей и продавцов
Пороговая линия для определения зон
Настройки индикатора:
Период (Period): определяет базовый период для расчетов (по умолчанию 89)
Порог (Threshold): устанавливает уровень для определения зон давления (от 0 до 2, по умолчанию 0.8)
Тип MA для покупок и продаж: выбор типа скользящей средней (SMA, EMA, RMA, WMA, VWMA, HMA)
Длина MA для покупок и продаж: период для расчета скользящих средних
Цвета для восходящего и нисходящего трендов MA
Скользящие средние:
Помогают сглаживать данные и выявлять тренды
Направление MA (вверх или вниз) дополнительно подтверждает текущий тренд
Цвет MA меняется в зависимости от направления (синий для восходящего, красный для нисходящего)
Теперь вы можете их включить и посмотреть как они помогают в понимании где ослабевает та или иная сила. Именно в этом случае мы видим пересечение сил и сила продавцов идет агрессивно вверх. Также по средней скользящей мы видим затухание силы продавцов. Сила покупателей стояла в боковике потом включилась на откуп и также по средней скользящей видно где пропал основной интерес к покупкам.
Использование:
Наблюдайте за силой покупателей и продавцов относительно друг друга. Они могут двигаться одновременно в одном направлении это расценивается как баланс
могут двигаться в разных направлениях и это будет усиливать восходящую силу продавцов или покупателей
также возможно вы заметите что движение одной из силы будет в узком диапазоне а вторая будет сильно расти - это манипуляция или торговля без сопротивления.
Также можете поиграть с пороговой линией, но она совершенно не главная здесь. В коде я отключил эту функцию.
// Display zones
//bgcolor(buy_zone ? color.new(color.blue, 90) : na)
//bgcolor(sell_zone ? color.new(color.red, 90) : na)
Если захотите включить скопируйте вместо нее
// Display zones
bgcolor(buy_zone ? color.new(color.blue, 90) : na)
bgcolor(sell_zone ? color.new(color.red, 90) : na)
Обращайте внимание на пересечение сил.
Используйте пересечения линий силы и их скользящих средних как потенциальные сигналы
Комбинируйте сигналы индикатора с другими инструментами технического анализа для подтверждения
Ограничения:
Требуется настройка параметров под конкретный торговый инструмент и таймфрейм
Не следует использовать индикатор как единственный инструмент для принятия торговых решений
Помните, что этот индикатор предоставляет дополнительную информацию для анализа рынка, но не является гарантией успешных сделок. Всегда сочетайте его с другими методами анализа и соблюдайте правила управления рисками.

lib_no_delayLibrary "lib_no_delay"
This library contains modifications to standard functions that return na before reaching the bar of their 'length' parameter.
That is because they do not compromise speed at current time for correct results in the past. This is good for live trading in short timeframes but killing applications on Monthly / Weekly timeframes if instruments, like in crypto, do not have extensive history (why would you even trade the monthly on a meme coin ... not my decision).
Also, some functions rely on source (value at previous bar), which is not available on bar 1 and therefore cascading to a na value up to the last bar ... which in turn leads to a non displaying indicator and waste of time debugging this)
Anyway ... there you go, let me know if I should add more functions.
sma(source, length)
Parameters:
source (float) : Series of values to process.
length (simple int) : Number of bars (length).
Returns: Simple moving average of source for length bars back.
ema(source, length)
Parameters:
source (float) : Series of values to process.
length (simple int) : Number of bars (length).
Returns: (float) The exponentially weighted moving average of the source.
rma(source, length)
Parameters:
source (float) : Series of values to process.
length (simple int) : Number of bars (length).
Returns: Exponential moving average of source with alpha = 1 / length.
atr(length)
Function atr (average true range) returns the RMA of true range. True range is max(high - low, abs(high - close ), abs(low - close )). This adapted version extends ta.atr to start without delay at first bar and deliver usable data instead of na by averaging ta.tr(true) via manual SMA.
Parameters:
length (simple int) : Number of bars back (length).
Returns: Average true range.
rsi(source, length)
Relative strength index. It is calculated using the ta.rma() of upward and downward changes of source over the last length bars. This adapted version extends ta.rsi to start without delay at first bar and deliver usable data instead of na.
Parameters:
source (float) : Series of values to process.
length (simple int) : Number of bars back (length).
Returns: Relative Strength Index.

CVD with Moving Average (Trend Colors) [SYNC & TRADE]Yesterday I wrote a simple and easy code for the indicator "Cumulative Delta Volume with a moving average" using AI.
Introduction:
Delta is the difference between buys and sells. If there are more purchases, the delta is positive, if there are more sales, the delta is negative. We look at each candle separately on a particular time frame, which does not give us an overall picture over time.
Cumulative volume delta is in many ways an extension of volume delta, but it covers longer periods of time and provides different trading signals. Like the volume delta indicator, the Cumulative Volume Delta (CVD) indicator measures the relationship between buying and selling pressure, but does not focus on one specific candle (or other chart element), but rather gives a picture over time.
What did you want to get?
I have often seen that they tried to attach RSI and the Ichimoku cloud to the cumulative delta of volume, but I have never seen a cumulative delta of volume with a moving average. A moving average that takes data from the cumulative volume delta will be different from the moving average of the underlying asset. It has been noted that often at the intersection of the cumulative volume delta and the moving average, this is a more accurate signal to buy or sell than the same intersections for the underlying asset.
Initially, 5 moving averages were made with values of 21, 55, 89, 144 and 233, but I realized that this overloads the chart. It is easier to change the length of the moving average depending on the time frame you are using than to overload the chart. The final version with one moving SMA, EMA, RMA, WMA, HMA.
The logic for applying a moving average to a cumulative volume delta:
You choose a moving average, just like you would on your underlying asset. Use the moving average you like and the period you are used to working with. Each TF has its own settings.
What we see on the graph:
This is not an oscillator, but an adapted version for a candlestick chart (line only). Using it, you can clearly see where the market is moving based on the cumulative volume delta. The cool thing is that you can include your moving average applied to the cumulative volume delta. Thanks to this, you can see a trend movement, a return to the moving average to continue the trend.
Opportunities not lost:
The most interesting thing is that it remains possible to observe the divergence of the asset and the cumulative delta of the volume. This gives a great advantage. Those who have not worked with divergence do not rush into it right away. There may be 3 peaks in divergence (as with oversold/overbought), but it works many times more clearly than RSI and MACD.
Here's a good example on the daily chart. The moment we were all waiting for 75,000. The cumulative Delta Volume fell with each peak, while the price chart (tops) were approximately level.
Usually they throw (allow to buy) without volume for sales (delta down, price up) in order to merge at a more interesting price. And they also drain without the volume of purchases for a squeeze (price down / delta up) and again I buy back at a more interesting price. There are more complex estimation options; you can read about the divergence of the cumulative delta of the CVD volume. I just recommend doing a backtest.
Recommendations:
One more moment. Use the indicator on the stock exchange, where there is the most money, by turnover and by asset. Choose Binance, not Bybit. Those. choose the BTC asset, for example, but on the Binance exchange. Not futures, but spot.
The greater the turnover on the exchange for an asset, and the fewer opportunities to enter with leverage, the less volatile the price and the more beautiful and accurate the chart.
Works on all assets. There is a subscription limit (the number of calculated bars) that has little effect on anything. Can be applied to any asset where there is volume (not SPX, but ES1, not MOEX, but MX1!).
Перевод на русский.
Вчера написал с помощью AI простой и легкий код индикатора "Кумулятивная Дельта Объема со скользящей средней".
Введение:
Дельта (Delta) — это разница между покупками и продажами. Если покупок больше — дельта положительная, если больше продаж — дельта отрицательная. Мы смотрим на каждую свечу отдельно на том или ином таймфрейме, что не дает нам общей картины во времени.
Кумулятивная дельта объема — во многом продолжение дельты объёмов, но она включает более длительные периоды времени и дает другие торговые сигналы. Как и индикатор дельты объёма, индикатор кумулятивной дельты объема (Cumulative Volume Delta, CVD) измеряет связь между давлением покупателей и продавцов, но при этом не фокусируется на одной конкретной свече (или другом элементе графика), а дает картину во времени.
Что хотел получить?
Часто видел, что к кумулятивной детьте объема пытались прикрепить RSI и облако ишимоку, но никогда не видел кумулятивную дельту объема со скользящей средней. Скользящая средняя которая берет данные от кумулятивной дельты объема будет отличатся от скользящей средней основного актива. Было замечено, что часто в местах пересечения кумулятивной дельты объема и скользящей средней - это более точный сигнал к покупке или продаже, чем такие же пересечения по основному активу.
Изначально было сделанно 5 скользящих со значениями 21, 55, 89, 144 и 233, но я понял, что это перегружает график. Проще менять длину скользящей средней от используемого таймфрейма, чем перегружать график. Финальный вариант с одной скользящей SMA, EMA, RMA, WMA, HMA.
Логика применения скользящей средней к кумулятивной дельте объема:
Вы выбираете скользящую среднюю, так же как и на основном активе. Применяйте ту скользящую среднюю, которая вам нравится и период, с которым привыкли работать. На каждом TF свои настройки.
Что мы видим на графике:
Это не осциллятор, а адаптированная версия к свечному графику (только линия). С помощью него вы можете наглядно посмотреть куда движется рынок по кумулятивной дельте объема. Самое интересное, что вы можете включить свою скользящую среднюю, применимую к кумулятивной дельте объема. Благодаря этому вы можете видеть трендовое движение, возврат к средней скользящей для продолжения тренда.
Не потерянные возможности:
Самое интересное, что осталась возможность наблюдать за дивергенцией актива и кумулятивной дельтой объема. Это дает большое преимущество. Те кто не работал с дивергенцией не бросайтесь на нее сразу. Может быть и 3 пика в дивергенции (как с перепроданностью / перекупленностью), но работает в разы четче чем RSI и MACD.
Вот хороший пример на дневном графике. Момент когда мы все ждали 75000. Кумулятивная Дельта Объема падала с каждым пиком, в то время как ценовой график (вершины) были примерно на уровне.
Обычно закидывают (разрешают покупать) без объема на продажи (дельта вниз цена вверх), чтобы слить по более интересной цене. И также сливают без объема покупок для сквиза (цена вниз / дельта вверх) и опять откупаю по более интересной цене. Существуют более сложные варианты оценки, можете почитать про дивергенцию кумулятивной дельты объема CVD. Только рекомендую сделать бэктест.
Рекомендации:
Еще момент. Используйте индикатор, на бирже, там где больше всего денег, по обороту и по активу. Выбирайте не Bybit, а Binance. Т.е. выбираете актив BTC, к примеру, но на бирже Binance. Не фьючерс, а спот.
Чем более большие обороты на бирже, по активу, и меньше возможностей заходить с плечами, тем менее волатильная цена и более красивый и точный график.
Работает на всех активах. Есть ограничение по подписке (количество рассчитываемых баров) мало влияет на что. Можно применить к любому активу где есть объем (не SPX, а ES1, не MOEX, а MX1!).
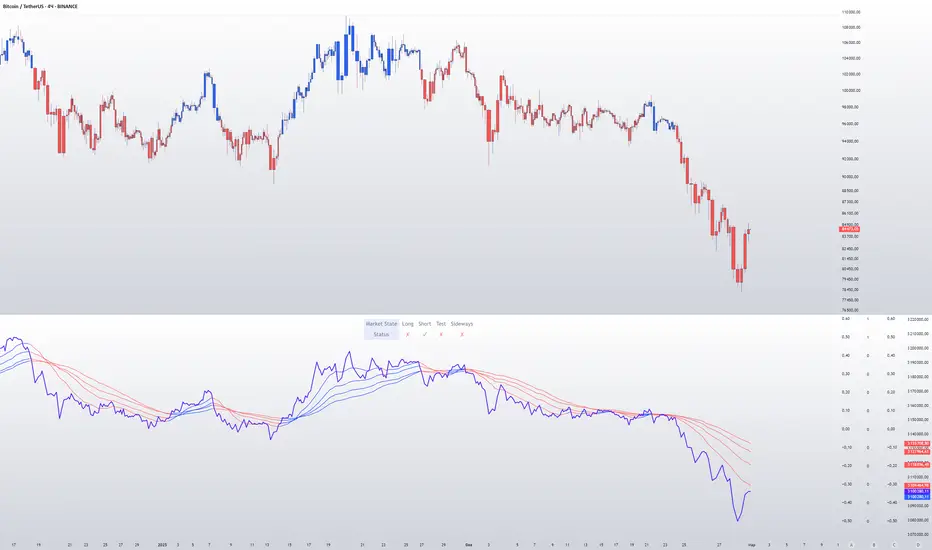
Filtered MACD with Backtest [UAlgo]The "Filtered MACD with Backtest " indicator is an advanced trading tool designed for the TradingView platform. It combines the Moving Average Convergence Divergence (MACD) with additional filters such as Moving Average (MA) and Average Directional Index (ADX) to enhance trading signals. This indicator aims to provide more reliable entry and exit points by filtering out noise and confirming trends. Additionally, it includes a comprehensive backtesting module to simulate trading strategies and assess their performance based on historical data. The visual backtest module allows traders to see potential trades directly on the chart, making it easier to evaluate the effectiveness of the strategy.
🔶 Customizable Parameters :
Price Source Selection: Users can choose their preferred price source for calculations, providing flexibility in analysis.
Filter Parameters:
MA Filter: Option to use a Moving Average filter with types such as EMA, SMA, WMA, RMA, and VWMA, and a customizable length.
ADX Filter: Option to use an ADX filter with adjustable length and threshold to determine trend strength.
MACD Parameters: Customizable fast length, slow length, and signal smoothing for the MACD indicator.
Backtest Module:
Entry Type: Supports "Buy and Sell", "Buy", and "Sell" strategies.
Stop Loss Types: Choose from ATR-based, fixed point, or X bar high/low stop loss methods.
Reward to Risk Ratio: Set the desired take profit level relative to the stop loss.
Backtest Visuals: Display entry, stop loss, and take profit levels directly on the chart with
colored backgrounds.
Alerts: Configurable alerts for buy and sell signals.
🔶 Filtered MACD : Understanding How Filters Work with ADX and MA
ADX Filter:
The Average Directional Index (ADX) measures the strength of a trend. The script calculates ADX using the user-defined length and applies a threshold value.
Trading Signals with ADX Filter:
Buy Signal: A regular MACD buy signal (crossover of MACD line above the signal line) is only considered valid if the ADX is above the set threshold. This suggests a stronger uptrend to potentially capitalize on.
Sell Signal: Conversely, a regular MACD sell signal (crossunder of MACD line below the signal line) is only considered valid if the ADX is above the threshold, indicating a stronger downtrend for potential shorting opportunities.
Benefits: The ADX filter helps avoid whipsaws or false signals that might occur during choppy market conditions with weak trends.
MA Filter:
You can choose from various Moving Average (MA) types (EMA, SMA, WMA, RMA, VWMA) for the filter. The script calculates the chosen MA based on the user-defined length.
Trading Signals with MA Filter:
Buy Signal: A regular MACD buy signal is only considered valid if the closing price is above the MA value. This suggests a potential uptrend confirmed by the price action staying above the moving average.
Sell Signal: Conversely, a regular MACD sell signal is only considered valid if the closing price is below the MA value. This suggests a potential downtrend confirmed by the price action staying below the moving average.
Benefits: The MA filter helps identify potential trend continuation opportunities by ensuring the price aligns with the chosen moving average direction.
Combining Filters:
You can choose to use either the ADX filter, the MA filter, or both depending on your strategy preference. Using both filters adds an extra layer of confirmation for your signals.
🔶 Backtesting Module
The backtesting module in this script allows you to visually assess how the filtered MACD strategy would have performed on historical data. Here's a deeper dive into its features:
Backtesting Type: You can choose to backtest for buy signals only, sell signals only, or both. This allows you to analyze the strategy's effectiveness in different market conditions.
Stop-Loss Types: You can define how stop-loss orders are placed:
ATR (Average True Range): This uses a volatility measure (ATR) multiplied by a user-defined factor to set the stop-loss level.
Fixed Point: This allows you to specify a fixed dollar amount or percentage value as the stop-loss.
X bar High/Low: This sets the stop-loss at a certain number of bars (defined by the user) above/below the bar's high (for long positions) or low (for short positions).
Reward-to-Risk Ratio: Define the desired ratio between your potential profit and potential loss on each trade. The backtesting module will calculate take-profit levels based on this ratio and the stop-loss placement.
🔶 Disclaimer:
Use with Caution: This indicator is provided for educational and informational purposes only and should not be considered as financial advice. Users should exercise caution and perform their own analysis before making trading decisions based on the indicator's signals.
Not Financial Advice: The information provided by this indicator does not constitute financial advice, and the creator (UAlgo) shall not be held responsible for any trading losses incurred as a result of using this indicator.
Backtesting Recommended: Traders are encouraged to backtest the indicator thoroughly on historical data before using it in live trading to assess its performance and suitability for their trading strategies.
Risk Management: Trading involves inherent risks, and users should implement proper risk management strategies, including but not limited to stop-loss orders and position sizing, to mitigate potential losses.
No Guarantees: The accuracy and reliability of the indicator's signals cannot be guaranteed, as they are based on historical price data and past performance may not be indicative of future results.

RSI Trail [UAlgo]The RSI Trail indicator is a technical analysis tool designed to assist traders in making informed decisions by utilizing the Relative Strength Index (RSI) and various moving average calculations. This indicator dynamically plots support and resistance levels based on RSI values, providing visual cues for potential bullish and bearish signals. The inclusion of a trailing stop mechanism allows traders to adapt to market volatility, ensuring optimal entry and exit points.
🔶 Key Features
Multiple Moving Average Types: Choose from Simple Moving Average (SMA), Exponential Moving Average (EMA), Weighted Moving Average (WMA), Running Moving Average (RMA), and McGinley Dynamic for diverse analytical approaches.
Configurable RSI Bounds: Tailor the RSI lower and upper bounds to your specific trading preferences, with default settings at 40 and 60.
Signals: The indicator determines bullish and bearish market states and plots corresponding signals on the chart.
Customizable Visualization: Options to display the midline and color candles based on market state enhance visual analysis.
Alerts: Integrated alert conditions notify you of bullish and bearish signals.
🔶 Calculations
The RSI Trail indicator calculates dynamic support and resistance levels using a combination of moving averages and the Relative Strength Index (RSI). It starts by computing a chosen moving average (SMA, EMA, WMA, RMA, or McGinley) over a period of 27 using the typical price (ohlc4).
The indicator then defines upper and lower bounds based on customizable RSI levels (default 40 and 60) and adjusts these bounds using the Average True Range (ATR) to account for market volatility. The upper bound is calculated by adding a volatility-adjusted value to the moving average, while the lower bound is found by subtracting this value. Bullish signals occur when the price crosses above the upper bound, and bearish signals when it falls below the lower bound.
The RSI Trail indicator also can be used to identify pullback opportunities. When the price high/low crosses above/below the calculated upper/lower bound, it indicates a potential pullback, suggesting a favorable point to enter a trade during a pullback.
🔶 Disclaimer
This indicator is for informational purposes only and should not be considered financial advice.
Always conduct your own research and due diligence before making any trading decisions. Past performance is not necessarily indicative of future results.

ATR (Average True Range) mit relative/absolute Zahlen GERMAN:
Schnelle Zusammenfassung:
Dieses Skript basiert auf dem ATR-Indikator und wurde so angepasst, dass sowohl relative (%) als auch absolute Zahlen angezeigt werden. Es bietet eine Darstellung des ATR in absoluten und prozentualen Werten sowie multipliziert mit den Faktoren x2, x2.5 und x3. Diese Darstellung erleichtert die Festlegung von Stop-Kursen, insbesondere für Trailing Stops und Trailing Abstände.
Periode:
Die Periode ist einstellbar und definiert die Länge der Berechnung des ATR (Standardwert: 14).
Glättung: Es stehen verschiedene Methoden zur Auswahl, um die Daten zu glätten (RMA, SMA, EMA, WMA).
Berechnungen:
ATR (Absolute Zahl): Berechnung der durchschnittlichen wahren Reichweite (ATR) unter Verwendung der ausgewählten Glättungsmethode und Periode.
ATR (Prozentualer Wert): Berechnung des ATR als Prozentsatz des aktuellen Schlusskurses.
Multiplikation des ATR: Berechnung des ATR multipliziert mit den Faktoren 2, 2.5 und 3 zur Einschätzung verschiedener Handelsszenarien.
Darstellung:
Absoluter ATR-Wert: Darstellung der absoluten ATR-Werte in Blau.
Relative ATR-Werte (%): Darstellung der prozentualen ATR-Werte, ohne Linie in der Grafik (transparent).
Multiplizierte ATR-Werte (x2, x2.5, x3): Darstellung der multiplizierten ATR-Werte in den Farben Grün (x2), Orange (x2.5) und Lila (x3).
Textbeschriftungen: Für jeden absoluten ATR-Wert und seine Multiplikationen werden Textbeschriftungen links im Chart angezeigt.
Verwendung des Indikators:
Dieser Indikator unterstützt Trader und Analysten dabei, die durchschnittliche wahre Reichweite (ATR) eines Finanzinstruments zu verstehen und zu visualisieren. Die verschiedenen Multiplikationen des ATR ermöglichen es, potenzielle Preisbewegungen zu analysieren und Handelsstrategien zu entwickeln, die auf der Volatilität basieren.
Hinweis:
Dies ist meine persönliche Meinung und Einstellung. Dieses Skript stellt keine Bankberatung oder Anlageempfehlung dar. Die Nutzung erfolgt auf eigenes Risiko und Verantwortung des Nutzers.
----------------------------------------------------------------------
ENGLISH:
Quick Summary:
This script is based on the ATR (Average True Range) indicator and has been modified to display both relative (%) and absolute values. It provides a representation of ATR in absolute and percentage terms, as well as multiplied by factors x2, x2.5, and x3. This visualization aids in setting stop-loss levels, especially for trailing stops and trailing distances.
Period:
The period is adjustable and defines the length of the ATR calculation (default: 14).
Smoothing: Various methods are available to smooth the data (RMA, SMA, EMA, WMA).
Calculations:
ATR (Absolute Value): Computes the Average True Range using the selected smoothing method and period.
ATR (Percentage Value): Calculates the ATR as a percentage of the current closing price.
Multiplication of ATR: Computes the ATR multiplied by factors 2, 2.5, and 3 to assess different trading scenarios.
Visualization:
Absolute ATR Value: Displays the absolute ATR values in blue.
Relative ATR Values (%): Shows the ATR values as percentages, without lines in the chart (transparent).
Multiplied ATR Values (x2, x2.5, x3): Presents the multiplied ATR values in green (x2), orange (x2.5), and purple (x3).
Text Labels: Text labels are shown on the left side of the chart for each absolute ATR value and its multiples.
Use of the Indicator:
This indicator helps traders and analysts understand and visualize the Average True Range (ATR) of a financial instrument. The different multipliers of ATR allow for the analysis of potential price movements and the development of trading strategies based on volatility.
Disclaimer:
This represents my personal opinion and viewpoint. This script does not constitute bank advice or investment recommendations. Use it at your own risk and responsibility.
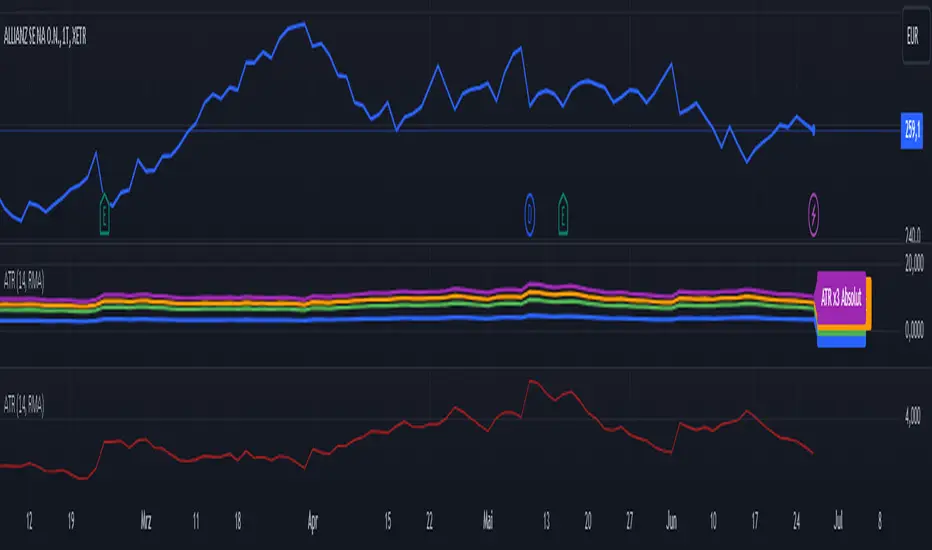
Bollinger Bands with Squeeze and SMA Indicator Description: BB+SMA
Overview:
Bollinger Bands (BB): Computes and plots three bands based on a selected moving average type (SMA, EMA, SMMA (RMA), WMA, VWMA) and standard deviation multiplier. The bands indicate potential support and resistance levels relative to price volatility.
Squeeze Condition: Detects periods of low volatility (squeeze) when the distance between the upper and lower Bollinger Bands narrows significantly. This condition can signal potential price breakouts.
Simple Moving Average (SMA): Calculates and plots a simple moving average based on user-defined length. It smooths price data to highlight trends and potential reversals.
Smoothing Line: Further enhances the SMA by applying different smoothing methods (SMA, EMA, SMMA (RMA), WMA, VWMA) over a specified smoothing length. It helps in identifying smoother trends and changes in direction.
Key Components:
Inputs: Users can adjust parameters such as Bollinger Bands length, type of moving average, standard deviation multiplier, squeeze condition length, squeeze threshold percentage, SMA length, smoothing method, and smoothing length.
Plotting: Displays the Bollinger Bands (basis, upper, lower), SMA, squeeze condition bands (basis, upper, lower), and a smoothing line on the chart.
Visualization: Utilizes different colors and line styles for clarity in visualizing each component's plot on the chart.
Purpose:
Helps traders identify potential price volatility, trend reversals, and breakout opportunities using Bollinger Bands, SMA, squeeze conditions, and smoothed moving averages.
Enhances technical analysis by providing clear visual cues for trend strength and potential entry/exit points based on the specified parameters.
Conclusion:
The "BB+SMA" indicator integrates multiple technical analysis tools into a single script, offering traders a comprehensive approach to analyzing price movements and making informed trading decisions directly on TradingView charts.

Price Ratio Indicator [ChartPrime]The Price Ratio Indicator is a versatile tool designed to analyze the relationship between the price of an asset and its moving average. It helps traders identify overbought and oversold conditions in the market, as well as potential trend reversals.
◈ User Inputs:
MA Length: Specifies the length of the moving average used in the calculation.
MA Type Fast: Allows users to choose from various types of moving averages such as Exponential Moving Average (EMA), Simple Moving Average (SMA), Weighted Moving Average (WMA), Volume Weighted Moving Average (VWMA), Relative Moving Average (RMA), Double Exponential Moving Average (DEMA), Triple Exponential Moving Average (TEMA), Zero-Lag Exponential Moving Average (ZLEMA), and Hull Moving Average (HMA).
Upper Level and Lower Level: Define the threshold levels for identifying overbought and oversold conditions.
Signal Line Length: Determines the length of the signal line used for smoothing the indicator's values.
◈ Indicator Calculation:
The indicator calculates the ratio between the price of the asset and the selected moving average, subtracts 1 from the ratio, and then smooths the result using the chosen signal line length.
// 𝙄𝙉𝘿𝙄𝘾𝘼𝙏𝙊𝙍 𝘾𝘼𝙇𝘾𝙐𝙇𝘼𝙏𝙄𝙊𝙉𝙎
//@ Moving Average's Function
ma(src, ma_period, ma_type) =>
ma =
ma_type == 'EMA' ? ta.ema(src, ma_period) :
ma_type == 'SMA' ? ta.sma(src, ma_period) :
ma_type == 'WMA' ? ta.wma(src, ma_period) :
ma_type == 'VWMA' ? ta.vwma(src, ma_period) :
ma_type == 'RMA' ? ta.rma(src, ma_period) :
ma_type == 'DEMA' ? ta.ema(ta.ema(src, ma_period), ma_period) :
ma_type == 'TEMA' ? ta.ema(ta.ema(ta.ema(src, ma_period), ma_period), ma_period) :
ma_type == 'ZLEMA' ? ta.ema(src + src - src , ma_period) :
ma_type == 'HMA' ? ta.hma(src, ma_period)
: na
ma
//@ Smooth of Source
src = math.sum(source, 5)/5
//@ Ratio Price / MA's
p_ratio = src / ma(src, ma_period, ma_type) - 1
◈ Visualization:
The main plot displays the price ratio, with color gradients indicating the strength and direction of the ratio.
The bar color changes dynamically based on the ratio, providing a visual representation of market conditions.
Invisible Horizontal lines indicate the upper and lower threshold levels for overbought and oversold conditions.
A signal line, smoothed using the specified length, helps identify trends and potential reversal points.
High and low value regions are filled with color gradients, enhancing visualization of extreme price movements.
MA type HMA gives faster changes of the indicator (Each MA has its own specifics):
MA type TEMA:
◈ Additional Features:
A symbol displayed at the bottom right corner of the chart provides a quick visual reference to the current state of the indicator, with color intensity indicating the strength of the ratio.
Overall, the Price Ratio Indicator offers traders valuable insights into price dynamics and helps them make informed trading decisions based on the relationship between price and moving averages. Adjusting the input parameters allows for customization according to individual trading preferences and market conditions.
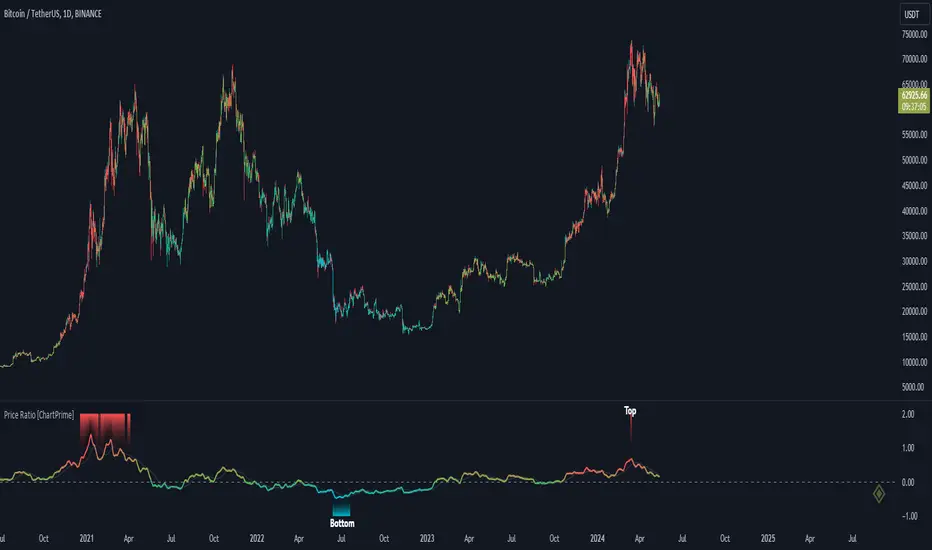
EM Visible Range Volume Profile█ OVERVIEW
ᴇᴍ VRVP (Visible Range Volume Profile) indicator calculates the volume profile within the visible range of prices.
Volume Profile is an advanced technical analysis indicator that shows trading activity over a specified period of time at certain price levels.
The indicator plots a histogram on the chart that reflects dominant or significant price levels based that are based on volume.
VP concept
VP Components
Open, High, Low, Close:
There are different types of volume profile indicators but the majority of them will designate the OHLC.
Point of Control:
A price level with the most traded volume during one session, also known as POC.
High Volume Node (HVN):
Area of high volume relative to surrounding price action.
Low Volume Node (LVN):
Area of low volume relative to surrounding price action.
Analysis of price in relation to high and low volume nodes is useful when building context around your trades.
█ VOLUME PROFILE STRATEGIES
The distribution of a volume profile can help you determine the strength of a trend and spot potential reversal zones. Let’s take a look at the five different distribution types.
Neutral D
In order for price to break away from value, either the buyers or the sellers will have to become more aggressive than the other side. When this occurs, it gives us with a vital piece of information.
Now we know who were the agressors at this price level: either the buyers or the sellers. That's why this is a good level for a trading setup if the price bounces back.
Bearish P and Bullish P
Bearish P — reversal. Bullish P — confirmation.
Bearish Ь and Bullish Ь
Bearish Ь — confirmation. Bullish Ь — reversal.
Examples
█ INPUTS
Width — amplitude of the VP histogram.
Grid — the number of columns of the VP histogram.
Delta of volumes — combinatorial determination of the ratios of sellers and buyers.
In quoted units — conversion in units of quoted currency.
Logarithmic scale — recalculation the grid step to the logarithmic scale of the chart.
HTF — (Higher Timeframe) calculation of VP for the period of the selected timeframe. ISO: Isolated computation in HTF period.
Palette: Total volume, Volume of buyers, Volume of sellers, HTF bars.
Warnings: colour of the «⚠» icon, language of information in the Tooltip.
Addition: ᴇᴍ CHN-RMA — a grid of moving averages with periods of centered hexagonal numbers.
█ ОБЩИЕ СВЕДЕНИЯ
ᴇᴍ VRVP (Visible Range Volume Profile) рассчитывает профиль объёма в видимом диапазоне цен.
Профиль объёма — это продвинутый индикатор технического анализа, который показывает торговую активность за условленный период времени на определённых ценовых уровнях.
Индикатор строит на графике гистограмму, отражающую доминирующие или значимые ценовые уровни, основанные на объёме.
█ НАСТРОЙКИ
Ширина — амплитуда гистограммы VP.
Сетка — количество колонок гистограммы VP.
Дельта объёмов — комбинаторное определение соотношений продаж и покупок.
В котируемых единицах — пересчёт в единицах котируемой валюты.
Логарифмическая шкала — пересчёт шага сетки на логарифмическую шкалу графика.
HTF — (Higher Timeframe) расчёт VP за период выбранного таймфрейма. ISO: Изолированное вычисление в HTF-периоде.
Палитра: Суммарный объём, Объём покупок, Объём продаж, Бары HTF.
Предупреждения: цвет значка «⚠», язык информации в Tooltip.
Дополнение: ᴇᴍ CHN-RMA — сетка скользящих средних с периодами центрированных гексагональных чисел.
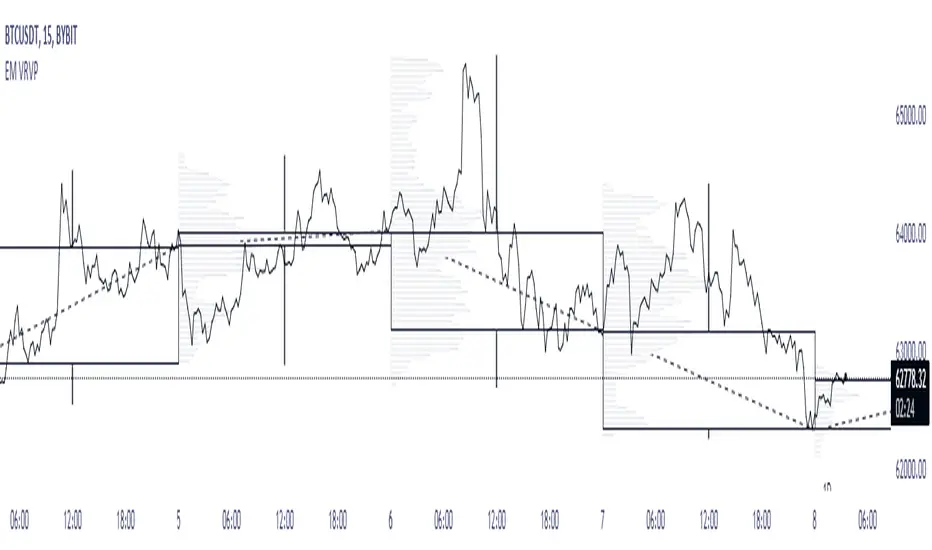
Multi Timeframe ATR IndicatorThe Average True Range (ATR) indicator is a technical analysis tool used to measure market volatility. The ATR indicator is designed to capture the degree of price movement or price volatility over a specified period of time. It does this by calculating the true range for each bar or candlestick on a chart and then taking an average of these true range values over a set period.
In the provided Pine Script code, the ATR indicator is being calculated for two different timeframes, which allows traders to compare volatility across different periods. The script includes user-defined inputs for the length of the ATR calculation and the type of smoothing (RMA or SMA) to be applied to the true range values. The 'smoothingFunc' function within the script determines whether to use the RMA (Relative Moving Average) or SMA (Simple Moving Average) based on the user's selection.
The true range for each bar is calculated as the maximum of the following three values: the difference between the current high and low, the absolute value of the difference between the current high and the previous close, and the absolute value of the difference between the current low and the previous close. This calculation is designed to ensure that gaps and limit moves are properly accounted for in the volatility measurement.
The script then uses the 'smoothingFunc' to calculate the ATR values for the two timeframes, and these values are plotted on the chart as two separate lines, allowing traders to visually assess the volatility levels.
Overall, this custom ATR indicator is a versatile tool for traders who wish to analyse market volatility and compare it across different timeframes, potentially aiding in making more informed trading decisions based on the prevailing market conditions.

MOST on RSIMOST is applied on this RSI moving average with an extra default option added VAR/VIDYA (Variable Index Dynamic Moving Average)
MOST added on RSI has a Moving Average of RSI and a trailing percent stop level of the Moving Average that can be adjusted by changing the length of the MA and %percent of the stop level.
BUY SIGNAL when the Moving Average Line crosses above the MOST Line
LONG CONDITION when the Moving Average is above the MOST
SELL SIGNAL when Moving Average Line crosses below MOST Line
SHORT CONDITION when the Moving Average is below MOST
-MOST indicator advised to use with Variable Moving Average in the sideways market by its developer Anıl Özekşi, so there are a couple of alternative Moving Average OPTIONS to use in the calculation of MOST:
"SMA", "Bollinger Bands", "EMA", "SMMA (RMA)", "WMA", "VWMA", "VAR"
SMA: Simple Moving Average
EMA: Exponential Movin Average
SMMA (RMA: Smoothed Moving Average, Rolling/Running Moving Average
WMA: Weighted Moving Average
WWMA: Welles Wilder's Moving Average
VAR: Variable Index Dynamic Moving Average aka VIDYA
The Moving Average length and stop loss percent values must be increased for less reliable but late signals. Conversely, it must be decreased to have more and faster signals.
As this indicator is derived from TradingView's built-in RSI, it has Bollinger Bands bounding RSI and a tool that can be used for Bullish & Bearish divergences between the price and RSI. (Show Divergence option)
Finally, users may check the box "Show Signals" to visually see the BUY & SELL signals.
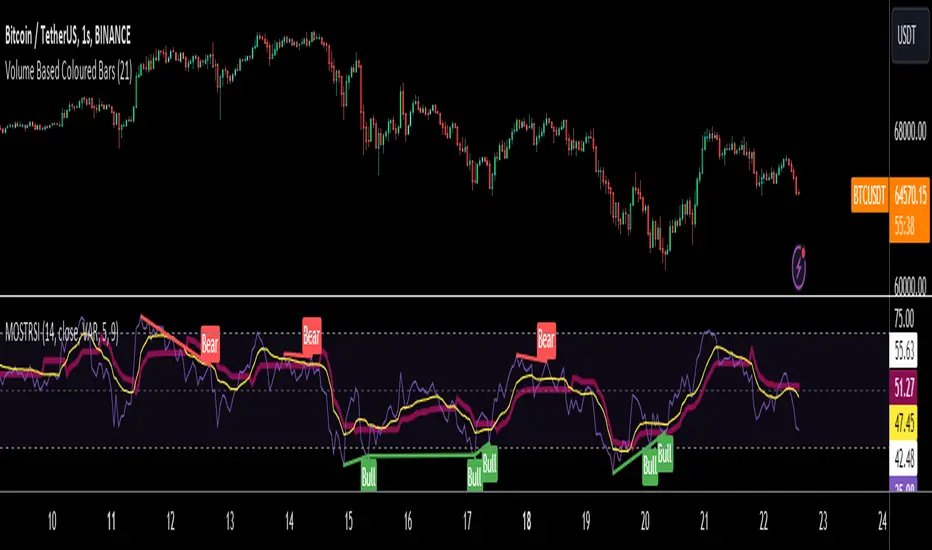
Momentum Madness (AKA: Moms Mad)The "Momentum Madness" indicator is a customizable technical analysis tool designed for TradingView. It aims to help traders assess price momentum and make informed trading decisions. Below is a description of how this indicator works:
Indicator Title and Settings:
The indicator is titled "Momentum Madness" with a short title "Moms Mad."
Users can customize various settings to tailor the indicator to their preferences.
Input Parameters:
Traders can set the lengths (periods) for four different momentum calculations (len1, len2, len3, len4).
They can specify a lookback period for trend direction determination.
Users can choose from three smoothing types (RMA, SMA, EMA) and set the smoothing length (smoothLength).
The indicator offers options to adjust momentum calculations based on volume (useVolumeWeight), RSI (useRSIAdjustment), and MACD (useMACDAdjustment).
If the trend filter is enabled (useTrendFilter), the indicator considers whether the price is above the 200-period SMA.
Traders can incorporate Bollinger Bands adjustments (useBBAdjustment) and set the Bollinger Bands length (bbLength).
A volatility adjustment can be applied (useVolatilityAdjustment), using the Average True Range (ATR) with a specified length (atrLength).
Smoothing Function:
The indicator offers three smoothing options: RMA, SMA, and EMA, allowing users to select their preferred method for smoothing price data.
Momentum Calculations:
The indicator calculates four different momentum values (mom1, mom2, mom3, mom4) by subtracting the current price from historical prices based on the specified lengths.
Enhancement Features:
Users can enhance momentum calculations through volume weighting, RSI adjustment, MACD adjustment, trend filtering, Bollinger Bands adjustment, and volatility adjustment, depending on their preferences.
Trend Direction Detection:
The indicator identifies the trend direction based on the comparison of the current momentum (mom4Smooth) with a momentum value from a specified lookback period. It determines whether the trend is bullish (green), bearish (red), or neutral (no change).
Plots:
The indicator visualizes the four smoothed momentum values (mom1Smooth, mom2Smooth, mom3Smooth, mom4Smooth) as separate plots on the chart, each with its own customizable color.
A zero line is displayed for reference (yellow).
The average momentum (averageMomentumSmooth) is plotted and can be customized with its own color.
The "Momentum 4" plot dynamically changes color based on trend direction (green for bullish, red for bearish).
Fill:
The indicator fills the area between the "Momentum 4" plot and the zero line with a customizable color to highlight bullish or bearish momentum.
Look for crossover events by studying the chart and understanding what they all mean. Happy trading :)
