Search in scripts for "rsi"


RSI +This enhanced RSI script, titled "RSI +", is designed to provide traders with more detailed and nuanced information about market conditions.
// INPUTS
The length input allows you to specify the number of periods used in the RSI calculation, with a default value of 14.
The Source input designates the price used for the calculations, typically the closing price.
// CALCULATIONS + PLOTTING
The RSI itself is then calculated as 50 plus 50 times the ratio of two RMAs (Running Moving Averages) - one of the gain_loss, and another of the absolute value of gain_loss. Both RMAs use the specified length.
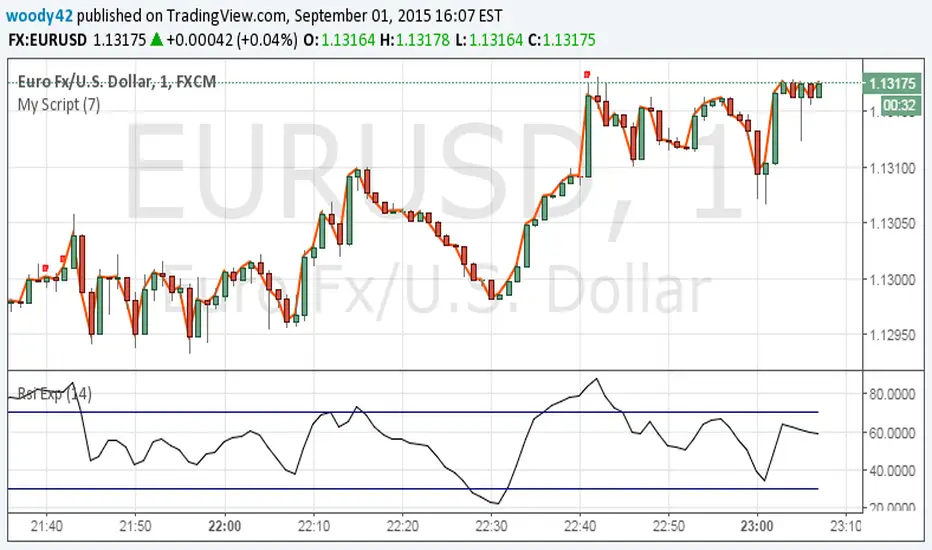
This script also plots several horizontal lines (bands) at fixed levels: 70, 60, 50, 40, and 30. These bands help to visually delineate areas of potential overbought (above 70) and oversold (below 30) conditions, as well as median levels. The color of the plotted RSI line changes depending on its relation to these bands and its own simple moving average (Moving_Average), providing an additional visual cue.
----------------------
What sets this script apart from a standard RSI is its unique calculation method. Unlike the traditional RSI, which simply compares the magnitude of recent gains to recent losses, this script incorporates a normalization factor (norm), calculated as the average of the current and previous period's source prices. The gain or loss (gain_loss) is then determined by dividing the change in the source price by this normalization factor. This method can potentially reduce noise and improve accuracy.
Always remember, though, that no indicator should be used in isolation. The best results are often achieved when they're used as part of a comprehensive trading strategy that considers multiple aspects of market analysis. This script, with its unique enhancements, could be used with other technical indicators like Moving Averages to ascertain the direction of the prevailing trend, while volume-based indicators like Volume-Weighted Average Price (VWAP) could provide insights into the strength behind price movements.

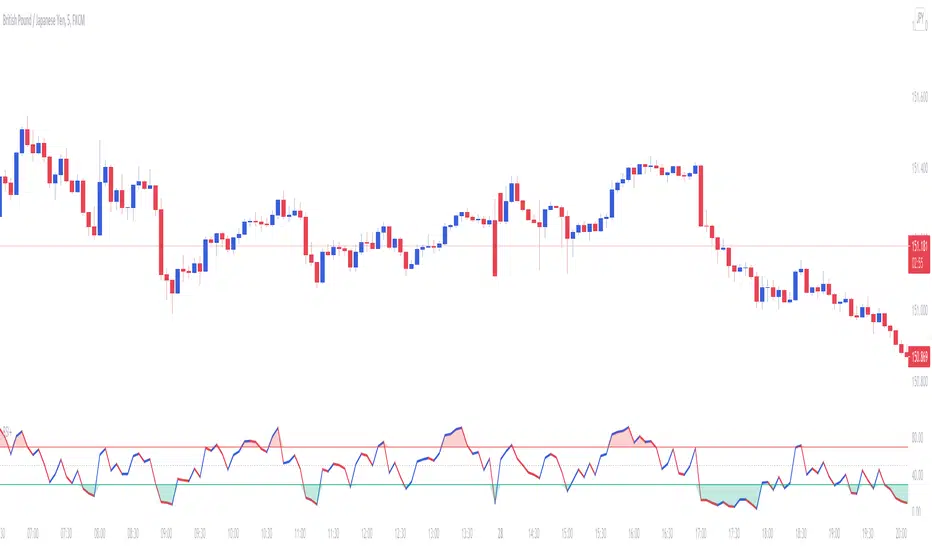
RSI+The Relative Strength Index can be used to determine Overbought and Oversold market conditions. This RSI+ indicator is set to a length faster then normal and changes color depending on momentum. When the RSI is Overbought a red shadow appears to indicate a sell is setting up. When the RSI is Oversold a green shadow appears to indicate a buy is setting up
RSI+A free addon for Profitable RSI . Equipped with RSI Values Distribution Profile, Point of Control, Value Area (customizable % based) and alert system.

RSI +++Customizable RSI indicator with bullish and bearish color coding and pivot dots when RSI crosses its moving average.

RSI-VA modified RSI script with a a slight modified net volume formula
red is bearish
green is bullish
just attempt to make the RSI more easy and better to use
best entry is when green bellow 30
and vice versa when red start to cross down the 70

RSIStandard RSI that uses the highest and lowest output plots of the RSI formula using open, high, low, close formulas.


RSI Forecast Colorful [DiFlip]RSI Forecast Colorful
Introducing one of the most complete RSI indicators available — a highly customizable analytical tool that integrates advanced prediction capabilities. RSI Forecast Colorful is an evolution of the classic RSI, designed to anticipate potential future RSI movements using linear regression. Instead of simply reacting to historical data, this indicator provides a statistical projection of the RSI’s future behavior, offering a forward-looking view of market conditions.
⯁ Real-Time RSI Forecasting
For the first time, a public RSI indicator integrates linear regression (least squares method) to forecast the RSI’s future behavior. This innovative approach allows traders to anticipate market movements based on historical trends. By applying Linear Regression to the RSI, the indicator displays a projected trendline n periods ahead, helping traders make more informed buy or sell decisions.
⯁ Highly Customizable
The indicator is fully adaptable to any trading style. Dozens of parameters can be optimized to match your system. All 28 long and short entry conditions are selectable and configurable, allowing the construction of quantitative, statistical, and automated trading models. Full control over signals ensures precise alignment with your strategy.
⯁ Innovative and Science-Based
This is the first public RSI indicator to apply least-squares predictive modeling to RSI calculations. Technically, it incorporates machine-learning logic into a classic indicator. Using Linear Regression embeds strong statistical foundations into RSI forecasting, making this tool especially valuable for traders seeking quantitative and analytical advantages.
⯁ Scientific Foundation: Linear Regression
Linear regression is a fundamental statistical method that models the relationship between a dependent variable y and one or more independent variables x. The general formula for simple linear regression is:
y = β₀ + β₁x + ε
where:
y = predicted variable (e.g., future RSI value)
x = explanatory variable (e.g., bar index or time)
β₀ = intercept (value of y when x = 0)
β₁ = slope (rate of change of y relative to x)
ε = random error term
The goal is to estimate β₀ and β₁ by minimizing the sum of squared errors. This is achieved using the least squares method, ensuring the best linear fit to historical data. Once the coefficients are calculated, the model extends the regression line forward, generating the RSI projection based on recent trends.
⯁ Least Squares Estimation
To minimize the error between predicted and observed values, we use the formulas:
β₁ = Σ((xᵢ - x̄)(yᵢ - ȳ)) / Σ((xᵢ - x̄)²)
β₀ = ȳ - β₁x̄
Σ denotes summation; x̄ and ȳ are the means of x and y; and i ranges from 1 to n (number of observations). These equations produce the best linear unbiased estimator under the Gauss–Markov assumptions — constant variance (homoscedasticity) and a linear relationship between variables.
⯁ Linear Regression in Machine Learning
Linear regression is a foundational component of supervised learning. Its simplicity and precision in numerical prediction make it essential in AI, predictive algorithms, and time-series forecasting. Applying regression to RSI is akin to embedding artificial intelligence inside a classic indicator, adding a new analytical dimension.
⯁ Visual Interpretation
Imagine a time series of RSI values like this:
Time →
RSI →
The regression line smooths these historical values and projects itself n periods forward, creating a predictive trajectory. This projected RSI line can cross the actual RSI, generating sophisticated entry and exit signals. In summary, the RSI Forecast Colorful indicator provides both the current RSI and the forecasted RSI, allowing comparison between past and future trend behavior.
⯁ Summary of Scientific Concepts Used
Linear Regression: Models relationships between variables using a straight line.
Least Squares: Minimizes squared prediction errors for optimal fit.
Time-Series Forecasting: Predicts future values from historical patterns.
Supervised Learning: Predictive modeling based on known output values.
Statistical Smoothing: Reduces noise to highlight underlying trends.
⯁ Why This Indicator Is Revolutionary
Scientifically grounded: Built on statistical and mathematical theory.
First of its kind: The first public RSI with least-squares predictive modeling.
Intelligent: Incorporates machine-learning logic into RSI interpretation.
Forward-looking: Generates predictive, not just reactive, signals.
Customizable: Exceptionally flexible for any strategic framework.
⯁ Conclusion
By combining RSI and linear regression, the RSI Forecast Colorful allows traders to predict market momentum rather than simply follow it. It's not just another indicator: it's a scientific advancement in technical analysis technology. Offering 28 configurable entry conditions and advanced signals, this open-source indicator paves the way for innovative quantitative systems.
⯁ Example of simple linear regression with one independent variable
This example demonstrates how a basic linear regression works when there is only one independent variable influencing the dependent variable. This type of model is used to identify a direct relationship between two variables.
⯁ In linear regression, observations (red) are considered the result of random deviations (green) from an underlying relationship (blue) between a dependent variable (y) and an independent variable (x)
This concept illustrates that sampled data points rarely align perfectly with the true trend line. Instead, each observed point represents the combination of the true underlying relationship and a random error component.
⯁ Visualizing heteroscedasticity in a scatterplot with 100 random fitted values using Matlab
Heteroscedasticity occurs when the variance of the errors is not constant across the range of fitted values. This visualization highlights how the spread of data can change unpredictably, which is an important factor in evaluating the validity of regression models.
⯁ The datasets in Anscombe’s quartet were designed to have nearly the same linear regression line (as well as nearly identical means, standard deviations, and correlations) but look very different when plotted
This classic example shows that summary statistics alone can be misleading. Even with identical numerical metrics, the datasets display completely different patterns, emphasizing the importance of visual inspection when interpreting a model.
⯁ Result of fitting a set of data points with a quadratic function
This example illustrates how a second-degree polynomial model can better fit certain datasets that do not follow a linear trend. The resulting curve reflects the true shape of the data more accurately than a straight line.
⯁ What Is RSI?
The RSI (Relative Strength Index) is a technical indicator developed by J. Welles Wilder. It measures the velocity and magnitude of recent price movements to identify overbought and oversold conditions. The RSI ranges from 0 to 100 and is commonly used to identify potential reversals and evaluate trend strength.
⯁ How RSI Works
RSI is calculated from average gains and losses over a set period (commonly 14 bars) and plotted on a 0–100 scale. It consists of three key zones:
Overbought: RSI above 70 may signal an overbought market.
Oversold: RSI below 30 may signal an oversold market.
Neutral Zone: RSI between 30 and 70, indicating no extreme condition.
These zones help identify potential price reversals and confirm trend strength.
⯁ Entry Conditions
All conditions below are fully customizable and allow detailed control over entry signal creation.
📈 BUY
🧲 Signal Validity: Signal remains valid for X bars.
🧲 Signal Logic: Configurable using AND or OR.
🧲 RSI > Upper
🧲 RSI < Upper
🧲 RSI > Lower
🧲 RSI < Lower
🧲 RSI > Middle
🧲 RSI < Middle
🧲 RSI > MA
🧲 RSI < MA
🧲 MA > Upper
🧲 MA < Upper
🧲 MA > Lower
🧲 MA < Lower
🧲 RSI (Crossover) Upper
🧲 RSI (Crossunder) Upper
🧲 RSI (Crossover) Lower
🧲 RSI (Crossunder) Lower
🧲 RSI (Crossover) Middle
🧲 RSI (Crossunder) Middle
🧲 RSI (Crossover) MA
🧲 RSI (Crossunder) MA
🧲 MA (Crossover)Upper
🧲 MA (Crossunder)Upper
🧲 MA (Crossover) Lower
🧲 MA (Crossunder) Lower
🧲 RSI Bullish Divergence
🧲 RSI Bearish Divergence
🔮 RSI (Crossover) Forecast MA
🔮 RSI (Crossunder) Forecast MA
📉 SELL
🧲 Signal Validity: Signal remains valid for X bars.
🧲 Signal Logic: Configurable using AND or OR.
🧲 RSI > Upper
🧲 RSI < Upper
🧲 RSI > Lower
🧲 RSI < Lower
🧲 RSI > Middle
🧲 RSI < Middle
🧲 RSI > MA
🧲 RSI < MA
🧲 MA > Upper
🧲 MA < Upper
🧲 MA > Lower
🧲 MA < Lower
🧲 RSI (Crossover) Upper
🧲 RSI (Crossunder) Upper
🧲 RSI (Crossover) Lower
🧲 RSI (Crossunder) Lower
🧲 RSI (Crossover) Middle
🧲 RSI (Crossunder) Middle
🧲 RSI (Crossover) MA
🧲 RSI (Crossunder) MA
🧲 MA (Crossover)Upper
🧲 MA (Crossunder)Upper
🧲 MA (Crossover) Lower
🧲 MA (Crossunder) Lower
🧲 RSI Bullish Divergence
🧲 RSI Bearish Divergence
🔮 RSI (Crossover) Forecast MA
🔮 RSI (Crossunder) Forecast MA
🤖 Automation
All BUY and SELL conditions can be automated using TradingView alerts. Every configurable condition can trigger alerts suitable for fully automated or semi-automated strategies.
⯁ Unique Features
Linear Regression Forecast
Signal Validity: Keep signals active for X bars
Signal Logic: AND/OR configuration
Condition Table: BUY/SELL
Condition Labels: BUY/SELL
Chart Labels: BUY/SELL markers above price
Automation & Alerts: BUY/SELL
Background Colors: bgcolor
Fill Colors: fill
Linear Regression Forecast
Signal Validity: Keep signals active for X bars
Signal Logic: AND/OR configuration
Condition Table: BUY/SELL
Condition Labels: BUY/SELL
Chart Labels: BUY/SELL markers above price
Automation & Alerts: BUY/SELL
Background Colors: bgcolor
Fill Colors: fill
