RSI Cloud v1.0 [PriceBlance] RSI Cloud v1.0 — Ichimoku-style Cloud on RSI(14), not on price.
Recalibrated baselines: EMA9 (Tenkan) for speed, WMA45 (Kijun) for stability.
Plus ADX-on-RSI to grade strength so you know when momentum persists or fades.
1. Introduction
RSI Cloud v1.0 applies an Ichimoku Cloud directly on RSI(14) to reveal momentum regimes earlier and cleaner than price-based views. We replaced Tenkan with EMA9 (faster, more responsive) and Kijun with WMA45 (slower, more stable) to fit a bounded oscillator (0–100). Forward spans (+26) and a lagging line (−26) provide a clear framework for trend bias and transitions.
To qualify signals, the indicator adds ADX computed on RSI—highlighting whether strength is weak, strong, or very strong, so you can decide when to follow, fade, or stand aside.
2. Core Mapping (Hook + Bullets)
At a glance: Ichimoku on RSI(14) with recalibrated baselines for a bounded oscillator.
Source: RSI(14)
Tenkan → EMA9(RSI) (fast, responsive)
Kijun → WMA45(RSI) (slow, stable)
Span A: classic Ichimoku midline, displaced +26
Span B: classic Ichimoku baseline, displaced +26
Lagging line: RSI shifted −26
3. Key Benefits (Why traders care)
Momentum regimes on RSI: position vs. Cloud = bull / bear / transition at a glance.
Cleaner confirmations: EMA9/WMA45 pairing cuts noise vs. raw 30/70 flips.
Earlier warnings: Cloud breaks on RSI often lead price-based confirmations.
4. ADX on RSI (Enhanced Strength Normalization)
Grade strength inside the RSI domain using ADX from ΔRSI:
ADX ≤ 20 → Weak (transparency = 60)
ADX ≤ 40 → Strong (transparency = 15)
ADX > 40 → Very strong (transparency = 0)
Use these tiers to decide when to trust, fade, or ignore a signal.
5. How to Read (Quick rules)
Bias / Regime
Bullish: RSI above Cloud and RSI > WMA45
Bearish: RSI below Cloud and RSI < WMA45
Neutral / Transition: all other cases
6. Settings (Copy & use)
RSI Length: 14 (default)
Tenkan: EMA9 on RSI · Kijun: WMA45 on RSI
Displacement: +26 (Span A/B) · −26 (Lagging)
Theme: PriceBlance Dark/Light
Visibility toggles: Cloud, Baselines, Lagging, labels/panel, Overbought/Oversold, Divergence, ADX-on-RSI (via transparency coloring)
7. Credits & License
Author/Brand: PriceBlance
Version: v1.0 (Free)
Watermark: PriceBlance • RSI Cloud v1.0
Disclaimer: Educational content; not financial advice.
8. CTA
If this helps, please ⭐ Star and Follow for updates & new tools.
Feedback is welcome—comment what you’d like added next (alerts, presets, visuals).
Search in scripts for "rsi"

RSI Pivots with Divergence Overlay█ OVERVIEW
The RSI Pivots with Divergence Overlay indicator is an advanced tool based on RSI, displaying dynamic bands on the price chart to simplify the identification of overbought and oversold conditions. Pivot points and divergences between them are derived from these bands, providing a comprehensive view of the market and enabling the creation of various trading strategies based on this single indicator.
█ CONCEPTS
Areas where RSI exits the bands are often reversal points in the market. The concept of this indicator is to highlight places where the probability of a trend reversal increases. Therefore, pivots and divergences have been added to better identify these key moments. Additionally, the bands allow viewing the market context in relation to the RSI indicator, facilitating analysis of momentum and volatility.
█ KEY FEATURES
Dynamic Bands and RSI Signals: The bands are calculated based on the closing price and RSI value, with dynamic scaling adjusted to market volatility. The upper band corresponds to overbought levels, the lower to oversold, and the midline is their average. The price level relative to the bands serves as a visual RSI signal, indicating potential overbought or oversold conditions.
Pivot Points: The indicator identifies local price highs and lows in relation to RSI levels. The pivot level is taken from the high/low of the candle. A high pivot is detected when the high of the candle reaches a local maximum after crossing the upper RSI level (overbought), signaling a potential reversal. A low pivot appears after a local price minimum following a drop below the lower RSI level (oversold), indicating a possible uptrend reversal. The pivot length (default 2 bars) defines the search range for these extremes, meaning that with a length of 2, a potential divergence signal will appear with a 2-candle delay, as this is the minimum time required to confirm a local pivot. Pivot lines are drawn on the chart, and labels display the RSI value (from the close of the candle) and price at the detection moment. Pivot lines disappear after the detection of the next low pivot for lower lines and high pivot for upper lines, but unbreached lines or those with high volume may still serve as support or resistance levels.
Divergence Detection: The indicator automatically detects divergences to predict trend changes. Bearish divergence occurs when the price forms a higher high pivot, but the RSI (from the close of the candle) is lower than in the previous pivot, indicating weakening upward momentum and a potential bearish reversal. Bullish divergence appears when the price forms a lower low pivot, but the RSI is higher, suggesting building momentum and a possible bullish reversal. Divergences are marked in pivot labels (e.g., "Bear Div" or "Bull Div") and supported by alerts upon detection.
Return Signals: The indicator generates buy and sell signals based on RSI (price) returning to the bands after extreme conditions, independently of pivots and divergences. A buy signal is triggered when RSI (price) crosses above the lower level (exiting oversold), suggesting a potential price rise toward the midline or upper band. A sell signal occurs when RSI (price) falls below the upper level (exiting overbought), indicating a possible price drop toward the lower band. Signals are visualized as arrows (up/down triangles) on the chart, with customizable colors.
█ CONFIGURATION
The indicator offers extensive customization options:
RSI Length (rsiLength): Sets the number of periods used to calculate RSI (default 14).
RSI Upper Level (rsiUpper): Defines the overbought threshold (default 70).
RSI Lower Level (rsiLower): Defines the oversold threshold (default 30).
Band Scaling (scale): Determines the scaling multiplier for bands based on market volatility (default 15.0).
SMA Length for Candle Midpoint (length): Number of periods for calculating the moving average of candle midpoints (default 200). This parameter is used to smooth price data, enabling more accurate volatility assessment and band width adjustment to market dynamics.
Pivot Length (pivotLength): Sets the range (in bars) for detecting local price extremes (default 2).
Pivot Label Offset (pivotLabelOffset): Multiplier for the candle range to position pivot labels (default 0.3).
Show Bands (showBands): Enables/disables the display of bands on the chart.
Show Fill (showFill): Enables/disables the fill between bands and the midline.
Show Pivot Lines (showPivotLines): Enables/disables pivot lines on the chart.
Show Pivot Labels (showPivotLabels): Enables/disables labels with RSI and price values at pivots.
Show Return Signals (showReturnSignals): Enables/disables the display of buy and sell signals.
Colors and Style: Customizable colors for bands, fills, pivot lines, labels, and line widths (default 1).
█ USAGE
The indicator performs best when combined with other technical analysis tools, such as Fibonacci levels, moving averages, or trendlines, to confirm pivot, divergence, and return signals. It enables traders to identify key reversal points, detect hidden trend weaknesses through divergences, and confirm trade entries with return signals.
Usage Examples:
Price bounces off a previous pivot with high volume – this increases the probability of a trend change or correction.
A similar situation when RSI is outside the bands strengthens the signal.
If divergence occurs in addition, we have further confirmation.
This can be combined with Fibonacci levels to check if Fibo zones overlap with pivot lines – this may increase the chance of a strong price reaction.
█ ALERTS
The indicator supports alerts for:
Buy and sell signals (RSI returning to bands).
Detection of bearish and bullish divergences.

RSI ADX Bollinger Analysis High-level purpose and design philosophy
This indicator — RSI-ADX-Bollinger Analysis — is a compact, educational market-analysis toolkit that blends momentum (RSI), trend strength (ADX), volatility structure (Bollinger Bands) and simple volumetrics to provide traders a snapshot of market condition and trade idea quality. The design philosophy is explicit and layered: use each component to answer a different question about price action (momentum, conviction, volatility, participation), then combine answers to form a more robust, explainable signal. The mashup is intended for analysis and learning, not automatic execution: it surfaces the why behind signals so traders can test, learn and apply rules with risk management.
________________________________________
What each indicator contributes (component-by-component)
RSI (Relative Strength Index) — role and behavior: RSI measures short-term momentum by comparing recent gains to recent losses. A high RSI (near or above the overbought threshold) indicates strong recent buying pressure and potential exhaustion if price is extended. A low RSI (near or below the oversold threshold) indicates strong recent selling pressure and potential exhaustion or a value area for mean-reversion. In this dashboard RSI is used as the primary momentum trigger: it helps identify whether price is locally over-extended on the buy or sell side.
ADX (Average Directional Index) — role and behavior: ADX measures trend strength independently of direction. When ADX rises above a chosen threshold (e.g., 25), it signals that the market is trending with conviction; ADX below the threshold suggests range or weak trend. Because patterns and momentum signals perform differently in trending vs. ranging markets, ADX is used here as a filter: only when ADX indicates sufficient directional strength does the system treat RSI+BB breakouts as meaningful trade candidates.
Bollinger Bands — role and behavior: Bollinger Bands (20-period basis ± N standard deviations) show volatility envelope and relative price position vs. a volatility-adjusted mean. Price outside the upper band suggests pronounced extension relative to recent volatility; price outside the lower band suggests extended weakness. A band expansion (increasing width) signals volatility breakout potential; contraction signals range-bound conditions and potential squeeze. In this dashboard, Bollinger Bands provide the volatility/structural context: RSI extremes plus price beyond the band imply a stronger, volatility-backed move.
Volume split & basic MA trend — role and behavior: Buy-like and sell-like volume (simple heuristic using close>open or closeopen) or sell-like (close1.2 for validation and compare win rate and expectancy.
4. TF alignment: Accept signals only when higher timeframe (e.g., 4h) trend agrees — compare results.
5. Parameter sensitivity: Vary RSI threshold (70/30 vs 80/20), Bollinger stddev (2 vs 2.5), and ADX threshold (25 vs 30) and measure stability of results.
These exercises teach both statistical thinking and the specific failure modes of the mashup.
________________________________________
Limitations, failure modes and caveats (explicit & teachable)
• ADX and Bollinger measures lag during fast-moving news events — signals can be late or wrong during earnings, macro shocks, or illiquid sessions.
• Volume classification by open/close is a heuristic; it does not equal TAPEDATA, footprint or signed volume. Use it as supportive evidence, not definitive proof.
• RSI can remain overbought or oversold for extended stretches in persistent trends — relying solely on RSI extremes without ADX or BB context invites large drawdowns.
• Small-cap or low-liquidity instruments yield noisy band behavior and unreliable volume ratios.
Being explicit about these limitations is a strong point in a TradingView description — it demonstrates transparency and educational intent.
________________________________________
Originality & mashup justification (text you can paste)
This script intentionally combines classical momentum (RSI), volatility envelope (Bollinger Bands) and trend-strength (ADX) because each indicator answers a different and complementary question: RSI answers is price locally extreme?, Bollinger answers is price outside normal volatility?, and ADX answers is the market moving with conviction?. Volume participation then acts as a practical check for real market involvement. This combination is not a simple “indicator mashup”; it is a designed ensemble where each element reduces the others’ failure modes and together produce a teachable, testable signal framework. The script’s purpose is educational and analytical — to show traders how to interpret the interplay of momentum, volatility, and trend strength.
________________________________________
TradingView publication guidance & compliance checklist
To satisfy TradingView rules about mashups and descriptions, include the following items in your script description (without exposing source code):
1. Purpose statement: One or two lines describing the script’s objective (educational multi-indicator market overview and idea filter).
2. Component list: Name the major modules (RSI, Bollinger Bands, ADX, volume heuristic, SMA trend checks, signal tracking) and one-sentence reason for each.
3. How they interact: A succinct non-code explanation: “RSI finds momentum extremes; Bollinger confirms volatility expansion; ADX confirms trend strength; all three must align for a BUY/SELL.”
4. Inputs: List adjustable inputs (RSI length and thresholds, BB length & stddev, ADX threshold & smoothing, volume MA, table position/size).
5. Usage instructions: Short workflow (check TF alignment → confirm participation → define stop & R:R → backtest).
6. Limitations & assumptions: Explicitly state volume is approximated, ADX has lag, and avoid promising guaranteed profits.
7. Non-promotional language: No external contact info, ads, claims of exclusivity or guaranteed outcomes.
8. Trademark clause: If you used trademark symbols, remove or provide registration proof.
9. Risk disclaimer: Add the copy-ready disclaimer below.
This matches TradingView’s request for meaningful descriptions that explain originality and inter-component reasoning.
________________________________________
Copy-ready short publication description (paste into TradingView)
Advanced RSI-ADX-Bollinger Market Overview — educational multi-indicator dashboard. This script combines RSI (momentum extremes), Bollinger Bands (volatility envelope and band expansion), ADX (trend strength), simple SMA trend bias and a basic buy/sell volume heuristic to surface high-quality idea candidates. Signals require alignment of momentum, volatility expansion and rising ADX; volume participation is displayed to support signal confidence. Inputs are configurable (RSI length/levels, BB length/stddev, ADX length/threshold, volume MA, display options). This tool is intended for analysis and learning — not for automated execution. Users should back test and apply robust risk management. Limitations: volume classification here is a heuristic (close>open), ADX and BB measures lag in fast news events, and results vary by instrument liquidity.
________________________________________
Copy-ready risk & misuse disclaimer (paste into description or help file)
This script is provided for educational and analytical purposes only and does not constitute financial or investment advice. It does not guarantee profits. Indicators are heuristics and may give false or late signals; always back test and paper-trade before using real capital. The author is not responsible for trading losses resulting from the use or misuse of this indicator. Use proper position sizing and risk controls.
________________________________________
Risk Disclaimer: This tool is provided for education and analysis only. It is not financial advice and does not guarantee returns. Users assume all risk for trades made based on this script. Back test thoroughly and use proper risk management.

RSI WMA VWMA Divergence Indicator//@version=6
indicator(title="RSI WMA VWMA Divergence Indicator", shorttitle="Osc Div", format=format.price, precision=2)
oscType = input.string("RSI", "Oscillator Type", options = , group="General Settings")
// RSI Settings
rsiGroup = "RSI Settings"
rsiLengthInput = input.int(14, minval=1, title="RSI Length", group=rsiGroup)
rsiSourceInput = input.source(close, "Source", group=rsiGroup)
// WMA VWMA
wma9 = ta.wma(close, 9)
vwma3 = ta.vwma(close, 3)
useVWMA = input.bool(true, "Use VWMA3 for Divergence (when WMA9 + VWMA3 mode)", group="WMA Settings")
// Oscillator selection
rsi = ta.rsi(rsiSourceInput, rsiLengthInput) // Calculate RSI always, but use conditionally
osc = oscType == "RSI" ? rsi : useVWMA ? vwma3 : wma9
// RSI plots (conditional)
isRSI = oscType == "RSI"
rsiPlot = plot(isRSI ? rsi : na, "RSI", color=isRSI ? #7E57C2 : na)
rsiUpperBand = hline(isRSI ? 70 : na, "RSI Upper Band", color=isRSI ? #787B86 : na)
midline = hline(isRSI ? 50 : na, "RSI Middle Band", color=isRSI ? color.new(#787B86, 50) : na)
rsiLowerBand = hline(isRSI ? 30 : na, "RSI Lower Band", color=isRSI ? #787B86 : na)
fill(rsiUpperBand, rsiLowerBand, color=isRSI ? color.rgb(126, 87, 194, 90) : na, title="RSI Background Fill")
midLinePlot = plot(isRSI ? 50 : na, color = na, editable = false, display = display.none)
fill(rsiPlot, midLinePlot, 100, 70, top_color = isRSI ? color.new(color.green, 0) : na, bottom_color = isRSI ? color.new(color.green, 100) : na, title = "Overbought Gradient Fill")
fill(rsiPlot, midLinePlot, 30, 0, top_color = isRSI ? color.new(color.red, 100) : na, bottom_color = isRSI ? color.new(color.red, 0) : na, title = "Oversold Gradient Fill")
// WMA VWMA plots
plot(oscType != "RSI" ? wma9 : na, "WMA9", color=oscType != "RSI" ? color.blue : na)
plot(oscType != "RSI" ? vwma3 : na, "VWMA3", color=oscType != "RSI" ? color.orange : na)
// Smoothing MA inputs (only for RSI)
GRP = "Smoothing (RSI only)"
TT_BB = "Only applies when 'SMA + Bollinger Bands' is selected. Determines the distance between the SMA and the bands."
maTypeInput = input.string("SMA", "Type", options = , group = GRP, display = display.data_window)
maLengthInput = input.int(14, "Length", group = GRP, display = display.data_window)
bbMultInput = input.float(2.0, "BB StdDev", minval = 0.001, maxval = 50, step = 0.5, tooltip = TT_BB, group = GRP, display = display.data_window)
enableMA = maTypeInput != "None" and oscType == "RSI"
isBB = maTypeInput == "SMA + Bollinger Bands" and oscType == "RSI"
// Smoothing MA Calculation
ma(source, length, MAtype) =>
switch MAtype
"SMA" => ta.sma(source, length)
"SMA + Bollinger Bands" => ta.sma(source, length)
"EMA" => ta.ema(source, length)
"SMMA (RMA)" => ta.rma(source, length)
"WMA" => ta.wma(source, length)
"VWMA" => ta.vwma(source, length)
// Smoothing MA plots
smoothingMA = enableMA ? ma(rsi, maLengthInput, maTypeInput) : na
smoothingStDev = isBB ? ta.stdev(rsi, maLengthInput) * bbMultInput : na
plot(smoothingMA, "RSI-based MA", color=enableMA ? color.yellow : na, display = enableMA ? display.all : display.none, editable = enableMA)
bbUpperBand = plot(isBB ? smoothingMA + smoothingStDev : na, title = "Upper Bollinger Band", color=isBB ? color.green : na, display = isBB ? display.all : display.none, editable = isBB)
bbLowerBand = plot(isBB ? smoothingMA - smoothingStDev : na, title = "Lower Bollinger Band", color=isBB ? color.green : na, display = isBB ? display.all : display.none, editable = isBB)
fill(bbUpperBand, bbLowerBand, color= isBB ? color.new(color.green, 90) : na, title="Bollinger Bands Background Fill", display = isBB ? display.all : display.none, editable = isBB)
// Divergence Settings
divGroup = "Divergence Settings"
calculateDivergence = input.bool(true, title="Calculate Divergence", group=divGroup, tooltip = "Calculating divergences is needed in order for divergence alerts to fire.")
lookbackLeft = input.int(5, "Pivot Lookback Left", minval=1, group=divGroup)
lookbackRight = input.int(5, "Pivot Lookback Right", minval=1, group=divGroup)
rangeLower = input.int(5, "Min Range for Divergence", minval=0, group=divGroup)
rangeUpper = input.int(60, "Max Range for Divergence", minval=1, group=divGroup)
showHidden = input.bool(true, "Show Hidden Divergences", group=divGroup)
bearColor = color.red
bullColor = color.green
textColor = color.white
noneColor = color.new(color.white, 100)
_inRange(cond) =>
bars = ta.barssince(cond)
rangeLower <= bars and bars <= rangeUpper
bool plFound = false
bool phFound = false
bool bullCond = false
bool bearCond = false
bool hiddenBullCond = false
bool hiddenBearCond = false
float oscLBR = na
float lowLBR = na
float highLBR = na
float prevPlOsc = na
float prevPlLow = na
float prevPhOsc = na
float prevPhHigh = na
if calculateDivergence
plFound := not na(ta.pivotlow(osc, lookbackLeft, lookbackRight))
phFound := not na(ta.pivothigh(osc, lookbackLeft, lookbackRight))
oscLBR := osc
lowLBR := low
highLBR := high
prevPlOsc := ta.valuewhen(plFound, oscLBR, 1)
prevPlLow := ta.valuewhen(plFound, lowLBR, 1)
prevPhOsc := ta.valuewhen(phFound, oscLBR, 1)
prevPhHigh := ta.valuewhen(phFound, highLBR, 1)
// Regular Bullish
oscHL = oscLBR > prevPlOsc and _inRange(plFound )
priceLL = lowLBR < prevPlLow
bullCond := priceLL and oscHL and plFound
// Regular Bearish
oscLL = oscLBR < prevPhOsc and _inRange(phFound )
priceHH = highLBR > prevPhHigh
bearCond := priceHH and oscLL and phFound
// Hidden Bullish
oscLL_hidden = oscLBR < prevPlOsc and _inRange(plFound )
priceHL = lowLBR > prevPlLow
hiddenBullCond := priceHL and oscLL_hidden and plFound and showHidden
// Hidden Bearish
oscHH_hidden = oscLBR > prevPhOsc and _inRange(phFound )
priceLH = highLBR < prevPhHigh
hiddenBearCond := priceLH and oscHH_hidden and phFound and showHidden
// Plot divergences (lines and labels on pane)
if bullCond
leftBar = ta.valuewhen(plFound, bar_index , 1)
line.new(leftBar, prevPlOsc, bar_index , oscLBR, xloc=xloc.bar_index, color=bullColor, width=2)
label.new(bar_index , oscLBR, "R Bull", style=label.style_label_up, color=noneColor, textcolor=textColor)
if bearCond
leftBar = ta.valuewhen(phFound, bar_index , 1)
line.new(leftBar, prevPhOsc, bar_index , oscLBR, xloc=xloc.bar_index, color=bearColor, width=2)
label.new(bar_index , oscLBR, "R Bear", style=label.style_label_down, color=noneColor, textcolor=textColor)
if hiddenBullCond
leftBar = ta.valuewhen(plFound, bar_index , 1)
line.new(leftBar, prevPlOsc, bar_index , oscLBR, xloc=xloc.bar_index, color=bullColor, width=2, style=line.style_dashed)
label.new(bar_index , oscLBR, "H Bull", style=label.style_label_up, color=noneColor, textcolor=textColor)
if hiddenBearCond
leftBar = ta.valuewhen(phFound, bar_index , 1)
line.new(leftBar, prevPhOsc, bar_index , oscLBR, xloc=xloc.bar_index, color=bearColor, width=2, style=line.style_dashed)
label.new(bar_index , oscLBR, "H Bear", style=label.style_label_down, color=noneColor, textcolor=textColor)
// Alert conditions
alertcondition(bullCond, title="Regular Bullish Divergence", message="Found a new Regular Bullish Divergence, Pivot Lookback Right number of bars to the left of the current bar.")
alertcondition(bearCond, title="Regular Bearish Divergence", message="Found a new Regular Bearish Divergence, Pivot Lookback Right number of bars to the left of the current bar.")
alertcondition(hiddenBullCond, title="Hidden Bullish Divergence", message="Found a new Hidden Bullish Divergence, Pivot Lookback Right number of bars to the left of the current bar.")
alertcondition(hiddenBearCond, title="Hidden Bearish Divergence", message="Found a new Hidden Bearish Divergence, Pivot Lookback Right number of bars to the left of the current bar.")

RSI For LoopTitle: RSI For Loop
SurgeQuant’s RSI with Threshold Colors and Bar Coloring indicator is a sophisticated tool designed to identify overbought and oversold conditions using a customizable Relative Strength Index (RSI). By averaging RSI over a user-defined lookback period, this indicator provides clear visual signals for bullish and bearish market conditions. The RSI line and price bars are dynamically colored to highlight momentum, making it easier for traders to spot potential trading opportunities.
How It Works
RSI Calculation:
Computes RSI based on a user-selected price source (Close, High, Low, or Open) with a configurable length (default: 5). Optional moving average smoothing refines the RSI signal for smoother analysis.
Lookback Averaging:
Averages the RSI over a user-defined lookback period (default: 5) to generate a stable momentum indicator, reducing noise and enhancing signal reliability.
Threshold-Based Signals:
Long Signal: Triggered when the averaged RSI exceeds the upper threshold (default: 52), indicating overbought conditions.
Short Signal: Triggered when the averaged RSI falls below the lower threshold (default: 48), indicating oversold conditions.
Visual Representation
The indicator provides a clear and customizable visual interface: Green RSI Line and Bars: Indicate overbought conditions when the averaged RSI surpasses the upper threshold, signaling potential long opportunities.
Red RSI Line and Bars: Indicate oversold conditions when the averaged RSI drops below the lower threshold, signaling potential short opportunities.
Neutral Gray RSI Line: Represents RSI values between thresholds for neutral market conditions.
Threshold Lines: Dashed gray lines mark the upper and lower thresholds on the RSI panel for easy reference.
Customization & Parameters
The RSI with Threshold Colors and Bar Coloring indicator offers flexible parameters to suit
various trading styles: Source: Select the input price (default: Close; options: Close, High, Low, Open).
RSI Length: Adjust the RSI calculation period (default: 5).
Smoothing: Enable/disable moving average smoothing (default: enabled) and set the smoothing length (default: 10).
Moving Average Type: Choose from multiple types (SMA, EMA, DEMA, TEMA, WMA, VWMA, SMMA, HMA, LSMA, ALMA; default: ALMA).
ALMA Sigma: Configure the ALMA smoothing parameter (default: 5).
Lookback Period: Set the period for averaging RSI (default: 5).
Thresholds: Customize the upper (default: 52) and lower (default: 48) thresholds for signal generation.
Color Settings: Transparent green and red colors (70% transparency) for bullish and bearish signals, with gray for neutral states.
Trading Applications
This indicator is versatile and can be applied across various markets and strategies: Momentum Trading: Highlights strong overbought or oversold conditions for potential entry or exit points.
Trend Confirmation: Use bar coloring to confirm RSI-based signals with price action on the main chart.
Reversal Detection: Identify potential reversals when RSI crosses the customizable thresholds.
Scalping and Swing Trading: Adjust parameters (e.g., RSI length, lookback) to suit short-term or longer-term strategies.
Final Note
SurgeQuant’s RSI with Threshold Colors and Bar Coloring indicator is a powerful tool for traders seeking to leverage RSI for momentum and reversal opportunities. Its combination of lookback-averaged RSI, dynamic threshold signals, and synchronized RSI and bar coloring offers a robust framework for informed trading decisions. As with all indicators, backtest thoroughly and integrate into a comprehensive trading strategy for optimal results.

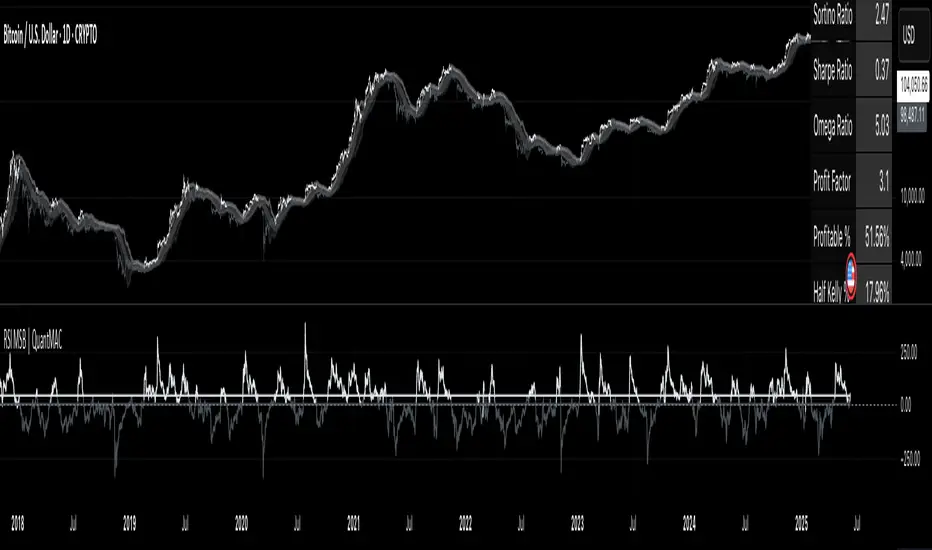
RSI MSB | QuantMAC📊 RSI MSB | QuantMAC
🎯 Overview
The RSI MSB (Momentum Shifting Bands) represents a groundbreaking fusion of traditional RSI analysis with advanced momentum dynamics and adaptive volatility bands. This sophisticated indicator combines RSI smoothing , relative momentum calculations , and dynamic standard deviation bands to create a powerful oscillator that automatically adapts to changing market conditions, providing superior signal accuracy across different trading environments.
🔧 Key Features
Hybrid RSI-Momentum Engine : Proprietary combination of smoothed RSI with relative momentum analysis
Dynamic Adaptive Bands : Self-adjusting volatility bands that respond to indicator strength
Dual Trading Modes : Flexible Long/Short or Long/Cash strategies for different risk preferences
Advanced Performance Analytics : Comprehensive metrics including Sharpe, Sortino, and Omega ratios
Smart Visual System : Dynamic color coding with 9 professional color schemes
Precision Backtesting : Date range filtering with detailed historical performance analysis
Real-time Signal Generation : Clear entry/exit signals with customizable threshold sensitivity
Position Sizing Intelligence : Half Kelly criterion for optimal risk management
📈 How The MSB Technology Work
The Momentum Shifting Bands technology is built on a revolutionary approach that combines multiple signal sources into one cohesive system:
RSI Foundation : 💪
Calculate traditional RSI using customizable length and source
Apply exponential smoothing to reduce noise and false signals
Normalize values for consistent performance across different timeframes
Momentum Analysis Engine : ⚡
Compute fast and slow momentum using rate of change calculations
Calculate relative momentum by comparing fast vs slow momentum
Normalize momentum values to 0-100 scale for consistency
Apply smoothing to create stable momentum readings
Dynamic Combination : 🔄
The genius of MSB lies in its weighted combination of RSI and momentum signals. The momentum weight parameter allows traders to adjust the balance between RSI stability and momentum responsiveness, creating a hybrid indicator that captures both trend continuation and reversal signals.
Adaptive Band System : 🎯
Calculate dynamic standard deviation multiplier based on indicator strength
Generate upper and lower bands that expand during high volatility periods
Create normalized oscillator that scales between band boundaries
Provide visual reference for overbought/oversold conditions
⚙️ Comprehensive Parameter Control
RSI Settings : 📊
RSI Length: Controls the period for RSI calculation (default: 21)
Source: Price input selection (close, open, high, low, etc.)
RSI Smoothing: Reduces noise in RSI calculations (default: 20)
Momentum Settings : 🔥
Fast Momentum Length: Short-term momentum period (default: 19)
Slow Momentum Length: Long-term momentum period (default: 21)
Momentum Weight: Balance between RSI and momentum (default: 0.6)
Oscillator Settings : ⚙️
Base Length: Foundation moving average for band calculations (default: 40)
Standard Deviation Length: Period for volatility measurement (default: 53)
SD Multiplier: Base band width adjustment (default: 0.7)
Oscillator Multiplier: Scaling factor for oscillator values (default: 100)
Signal Thresholds : 🎯
Long Threshold: Bullish signal trigger level (default: 93)
Short Threshold: Bearish signal trigger level (default: 53)
🎨 Advanced Visual System
Main Chart Elements : 📈
Dynamic Shifting Bands: Upper and lower bands with intelligent transparency
Adaptive Fill Zone: Color-coded area between bands showing current market state
Basis Line: Moving average foundation displayed as subtle reference points
Smart Bar Coloring: Candles change color based on oscillator state for instant visual feedback
Oscillator Pane : 📊
Normalized MSB Oscillator: Main signal line with dynamic coloring based on market state
Threshold Lines: Horizontal reference lines for entry/exit levels
Zero Line: Central reference for oscillator neutrality
Color State Indication: Line colors change based on bullish/bearish conditions
📊 Professional Performance Metrics
The built-in analytics suite provides institutional-grade performance measurement:
Net Profit % : Total strategy return percentage
Maximum Drawdown % : Worst peak-to-trough decline
Win Rate % : Percentage of profitable trades
Profit Factor : Ratio of gross profits to gross losses
Sharpe Ratio : Risk-adjusted return measurement
Sortino Ratio : Downside-focused risk adjustment
Omega Ratio : Probability-weighted performance ratio
Half Kelly % : Optimal position sizing recommendation
Total Trades : Complete transaction count
🎯 Strategic Trading Applications
Long/Short Mode : ⚡
Maximizes profit potential by capturing both upward and downward price movements. The MSB technology helps identify when momentum is building in either direction, allowing for optimal position switches between long and short positions.
Long/Cash Mode : 🛡️
Conservative approach ideal for retirement accounts or risk-averse traders. The indicator's adaptive nature helps identify the best times to be invested versus sitting in cash, protecting capital during adverse market conditions.
🚀 Unique Advantages
Traditional Indicators vs RSI MSB :
Static vs Dynamic: While most indicators use fixed parameters, MSB bands adapt based on indicator strength
Single Signal vs Multi-Signal: Combines RSI reliability with momentum responsiveness
Lagging vs Balanced: Optimized balance between signal speed and accuracy
Simple vs Intelligent: Advanced momentum analysis provides superior market insight
💡 Professional Setup Guide
For Day Trading (Short-term) : 📱
RSI Length: 14-18
RSI Smoothing: 12-15
Momentum Weight: 0.7-0.8
Thresholds: Long 90, Short 55
For Swing Trading (Medium-term) : 📊
RSI Length: 21-25 (default range)
RSI Smoothing: 18-22
Momentum Weight: 0.5-0.7
Thresholds: Long 93, Short 53 (defaults)
For Position Trading (Long-term) : 📈
RSI Length: 25-30
RSI Smoothing: 25-30
Momentum Weight: 0.4-0.6
Thresholds: Long 95, Short 50
🧠 Advanced Trading Techniques
MSB Divergence Analysis : 🔍
Watch for divergences between price action and MSB readings. When price makes new highs/lows but the oscillator doesn't confirm, it often signals upcoming reversals or momentum shifts.
Band Width Interpretation : 📏
Expanding Bands: Increasing volatility, expect larger price moves
Contracting Bands: Decreasing volatility, prepare for potential breakouts
Band Touches: Price touching outer bands often signals reversal opportunities
Multi-Timeframe Analysis : ⏰
Use MSB on higher timeframes for trend direction and lower timeframes for precise entry timing. The momentum component makes it particularly effective for timing entries within established trends.
⚠️ Important Risk Disclaimers
Critical Risk Factors :
Market Conditions: No indicator performs equally well in all market environments
Backtesting Limitations: Historical performance may not reflect future market behavior
Parameter Sensitivity: Different settings may produce significantly different results
Volatility Risk: Momentum-based indicators can be sensitive to extreme market conditions
Capital Risk: Always use appropriate position sizing and stop-loss protection
📚 Educational Benefits
This indicator provides exceptional learning opportunities for understanding:
Advanced RSI analysis and momentum integration techniques
Adaptive indicator design and dynamic band calculations
The relationship between momentum shifts and price movements
Professional risk management using Kelly Criterion principles
Modern oscillator interpretation and multi-signal analysis
🔍 Market Applications
The RSI MSB works effectively across various markets:
Forex : Excellent for currency pair momentum analysis
Stocks : Individual equity and index trading with momentum confirmation
Commodities : Adaptive to commodity market momentum cycles
Cryptocurrencies : Handles extreme volatility with momentum filtering
Futures : Professional derivatives trading applications
🔧 Technical Innovation
The RSI MSB represents advanced research into multi-signal technical analysis. The proprietary momentum-RSI combination has been optimized for:
Computational Efficiency : Fast calculation even on high-frequency data
Signal Clarity : Clear, actionable trading signals with reduced noise
Market Adaptability : Automatic adjustment to changing momentum conditions
Parameter Flexibility : Wide range of customization options for different trading styles
🔔 Updates and Evolution
The RSI MSB | QuantMAC continues to evolve with regular updates incorporating the latest research in momentum-based technical analysis. The comprehensive parameter set allows for extensive customization and optimization across different market conditions.
Past Performance Disclaimer : Past performance results shown by this indicator are hypothetical and not indicative of future results. Market conditions change continuously, and no trading system or methodology can guarantee profits or prevent losses. Historical backtesting may not reflect actual trading conditions including market liquidity, slippage, and fees that would affect real trading results.
Master The Markets With Multi-Signal Intelligence! 🎯📈
RSI Signal Pro[UgurTash]Introducing RSI Signal Pro for TradingView
RSI Signal Pro is a refined version of the standard Relative Strength Index (RSI) , designed to improve signal accuracy by generating alerts in real-time instead of waiting for multiple candle confirmations. This enhancement allows traders to react faster to market movements while maintaining the familiar RSI structure.
What Makes RSI Signal Pro Unique?
✅ Real-Time RSI Signals: Unlike the traditional RSI, which waits for candle confirmations, this version provides immediate buy and sell signals upon key level crossovers.
✅ Dual Trading Modes: Choose between Simple Mode (standard RSI crossovers) and Advanced Mode (momentum-adjusted signals with price validation).
✅ Customizable RSI-Based Moving Average (MA): Optionally apply SMA, EMA, WMA, or VWMA to smooth RSI fluctuations and identify longer-term trends.
✅ Adaptive Signal Filtering: The Advanced Mode reduces false signals by filtering RSI movements with a momentum threshold and historical RSI validation.
✅ User-Friendly Interface: Simple ON/OFF toggles allow easy customization of the indicator's behavior.
How This Indicator Works
🔹 Simple Mode: Identical to traditional RSI, triggering signals when RSI crosses 30 (bullish) or 70 (bearish).
🔹 Advanced Mode: Uses historical RSI pivots, momentum verification, and price confirmation to refine signal accuracy—ideal for traders looking for more precise entries.
🔹 RSI-Based MA: Optionally overlay moving averages onto the RSI, providing additional trend confirmation.
How to Use RSI Signal Pro
1️⃣ Select a mode: Use Simple Mode for frequent alerts or Advanced Mode for refined signals.
2️⃣ Enable RSI-Based MA: Apply SMA, EMA, WMA, or VWMA to smooth RSI fluctuations.
3️⃣ Set alerts: TradingView notifications allow you to react to real-time RSI movements instantly.
4️⃣ Apply to multiple markets: Effective for crypto, forex, stocks, and commodities.
Why Use RSI Signal Pro Instead of Standard RSI?
While RSI Signal Pro maintains the core functionality of the standard RSI, its real-time signal generation allows traders to make faster decisions without the typical delay caused by waiting for candle confirmations. Additionally, the optional momentum filtering and moving average smoothing ensure fewer false signals and better trade accuracy.

RSI and Bollinger Bands Screener [deepakks444]Indicator Overview
The indicator is designed to help traders identify potential long signals by combining the Relative Strength Index (RSI) and Bollinger Bands across multiple timeframes. This combination allows traders to leverage the strengths of both indicators to make more informed trading decisions.
Understanding RSI
What is RSI?
The Relative Strength Index (RSI) is a momentum oscillator that measures the speed and change of price movements. Developed by J. Welles Wilder Jr. for stocks and forex trading, the RSI is primarily used to identify overbought or oversold conditions in an asset.
How RSI Works:
Calculation: The RSI is calculated using the average gains and losses over a specified period, typically 14 periods.
Range: The RSI oscillates between 0 and 100.
Interpretation:
Key Features of RSI:
Momentum Indicator: RSI helps identify the momentum of price movements.
Divergences: RSI can show divergences, where the price makes a higher high, but the RSI makes a lower high, indicating potential reversals.
Trend Identification: RSI can also help identify trends. In an uptrend, the RSI tends to stay above 50, and in a downtrend, it tends to stay below 50.
Understanding Bollinger Bands
What is Bollinger Bands?
Bollinger Bands are a type of trading band or envelope plotted two standard deviations (positively and negatively) away from a simple moving average (SMA) of a price. Developed by financial analyst John Bollinger, Bollinger Bands consist of three lines:
Upper Band: SMA + (Standard Deviation × Multiplier)
Middle Band (Basis): SMA
Lower Band: SMA - (Standard Deviation × Multiplier)
How Bollinger Bands Work:
Volatility Measure: Bollinger Bands measure the volatility of the market. When the bands are wide, it indicates high volatility, and when the bands are narrow, it indicates low volatility.
Price Movement: The price tends to revert to the mean (middle band) after touching the upper or lower bands.
Support and Resistance: The upper and lower bands can act as dynamic support and resistance levels.
Key Features of Bollinger Bands:
Volatility Indicator: Bollinger Bands help traders understand the volatility of the market.
Mean Reversion: Prices tend to revert to the mean (middle band) after touching the bands.
Squeeze: A Bollinger Band Squeeze occurs when the bands narrow significantly, indicating low volatility and a potential breakout.
Combining RSI and Bollinger Bands
Strategy Overview:
The strategy aims to identify potential long signals by combining RSI and Bollinger Bands across multiple timeframes. The key conditions are:
RSI Crossing Above 60: The RSI should cross above 60 on the 15-minute timeframe.
RSI Above 60 on Higher Timeframes: The RSI should already be above 60 on the hourly and daily timeframes.
Price Above 20MA or Walking on Upper Bollinger Band: The price should be above the 20-period moving average of the Bollinger Bands or walking on the upper Bollinger Band.
Strategy Details:
RSI Calculation:
Calculate the RSI for the 15-minute, 1-hour, and 1-day timeframes.
Check if the RSI crosses above 60 on the 15-minute timeframe.
Ensure the RSI is above 60 on the 1-hour and 1-day timeframes.
Bollinger Bands Calculation:
Calculate the Bollinger Bands using a 20-period moving average and 2 standard deviations.
Check if the price is above the 20-period moving average or walking on the upper Bollinger Band.
Entry and Exit Signals:
Long Signal: When all the above conditions are met, consider a long entry.
Exit: Exit the trade when the price crosses below the 20-period moving average or the stop-loss is hit.
Example Usage
Setup:
Add the indicator to your TradingView chart.
Configure the inputs as per your requirements.
Monitoring:
Look for the long signal on the chart.
Ensure that the RSI is above 60 on the 15-minute, 1-hour, and 1-day timeframes.
Check that the price is above the 20-period moving average or walking on the upper Bollinger Band.
Trading:
Enter a long position when the criteria are met.
Set a stop-loss below the low of the recent 15-minute candle or based on your risk management rules.
Monitor the trade and exit when the RSI returns below 60 on any of the timeframes or when the price crosses below the 20-period moving average.
House Rules Compliance
No Financial Advice: This strategy is for educational purposes only and should not be construed as financial advice.
Risk Management: Always use proper risk management techniques, including stop-loss orders and position sizing.
Past Performance: Past performance is not indicative of future results. Always conduct your own research and analysis.
TradingView Guidelines: Ensure that any shared scripts or strategies comply with TradingView's terms of service and community guidelines.
Conclusion
This strategy combines RSI and Bollinger Bands across multiple timeframes to identify potential long signals. By ensuring that the RSI is above 60 on higher timeframes and that the price is above the 20-period moving average or walking on the upper Bollinger Band, traders can make more informed decisions. Always remember to conduct thorough research and use proper risk management techniques.

RSI BandsOverview
The RSI Bands indicator is a tool designed to calculate and display overbought, oversold, and middle bands based on the Relative Strength Index (RSI).
Its primary purpose is to provide traders with a clue on whether to place limit buy or limit sell orders, or to set stop-loss orders effectively. The bands represent the price levels the asset must reach for the RSI to align with specific thresholds:
Overbought Band: Displays the upper band representing the price level the asset must reach for the RSI to become overbought.
Oversold Band: Displays the lower band representing the price level the asset must reach for the RSI to become oversold.
Middle Band: Displays the middle band representing the price level the asset must reach for the RSI to hit the middle level. It uses both traditional RSI calculations and a dynamic period adjustment mechanism for improved adaptability to market conditions. The script also offers smoothing options for the bands.
Features
Calculates overbought, oversold, and middle bands using RSI values.
Dynamically adjusts the RSI period based on pivot points if enabled.
Offers smoothing options for the bands: EMA, SMA, or None.
Customizable input parameters for flexibility.
Inputs
Source Value: Selects the data source (e.g., close price) for RSI calculation.
Period: Sets the static RSI calculation period. Used if dynamic period is disabled.
Use Dynamic Period?: Toggles the use of a dynamic RSI period.
Pivot Left/Right Length: Determines the range of bars for pivot detection when using dynamic periods.
Dynamic Period Multiplier: Scales the dynamically calculated RSI period.
Overbought Level: RSI level that marks the overbought threshold.
Oversold Level: RSI level that marks the oversold threshold.
Middle Level: RSI level used as a midpoint reference.
Smoothing Type: Specifies the smoothing method for the bands (EMA, SMA, or None).
Smoothing Length: Length used for the selected smoothing method.
Key Calculations
RSI Calculation:
Computes RSI using gains and losses over the specified period (dynamic or static).
Incorporates a custom function for calculating RSI with dynamic periods.
Dynamic Period Adjustment:
Uses pivot points to determine an adaptive RSI period.
Multiplies the base dynamic period by the Dynamic Period Multiplier.
Band Calculation:
Calculates price changes (deltas) required to achieve the overbought, oversold, and middle RSI levels.
The price changes (deltas) are determined using an iterative approximation technique. For each target RSI level (overbought, oversold, or middle), the script estimates the required change in price by adjusting a hypothetical delta value until the calculated RSI aligns with the target RSI. This approximation ensures precise calculation of the price levels necessary for the RSI to reach the specified thresholds.
Computes the upper (overbought), lower (oversold), and middle bands by adding these deltas to the source price.
Smoothing:
Applies the selected smoothing method (EMA or SMA) to the calculated bands.
Plots
Overbought Band: Displays the upper band representing the price level the asset must reach for the RSI to become overbought.
Oversold Band: Displays the lower band representing the price level the asset must reach for the RSI to become oversold.
Middle Band: Displays the middle band representing the price level the asset must reach for the RSI to hit the middle level.
Usage
Choose the source value (e.g., close price).
Select whether to use a dynamic RSI period or a static one.
Adjust pivot lengths and multipliers for dynamic period calculation as needed.
Set the overbought, oversold, and middle RSI levels based on your analysis.
Configure smoothing options for the bands.
Observe the plotted bands and use them to identify potential overbought and oversold market conditions.

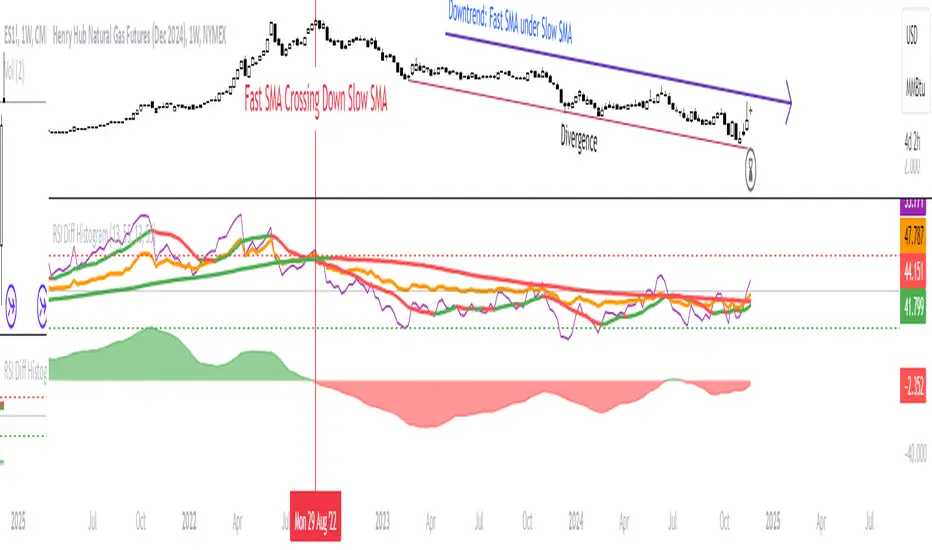
RSI Difference (Fast and Slow)Introduction
Oscillators like the RSI are fundamental tools for identifying trends in financial markets. Their ability to measure price momentum allows traders to detect overbought, oversold levels, and divergences, anticipating trend changes. Are there ways to improve the use of traditional RSI? How can we obtain more detailed information about current trends? This indicator answers these questions by expanding the functionalities of the traditional RSI and offering an additional tool for analysis.
How does it work?
This indicator provides a framework for trend analysis based on the following setup:
Fast RSI
Slow RSI
SMA of the fast RSI
SMA of the slow RSI
Histogram
Custom Indicator Settings
My preferred configuration is based on the 13 and 55 moving averages. The rest of the setup is as follows:
I typically use the 13 and 55 moving averages to configure both the RSI and short- and long-term moving averages.
Interpretation and Signals: Including a Long-Period RSI
Including a long-period RSI helps identify key patterns in market behavior. Crossovers between the two can be used to establish entry patterns:
If the fast RSI crosses above the slow RSI, this could indicate a long-entry pattern.
If the fast RSI crosses below the slow RSI, this could indicate a short-entry pattern.
Interpretation and Signals: Including Moving Averages
Including moving averages for both the short- and long-period RSI can help identify the base trend of the movement and, consequently:
Avoid false signals.
Trade in favor of the trend.
A simple way to start working with these is to use the crossover of the moving averages to identify the current trend:
If the short-period SMA is above the long-period SMA, the trend is bullish.
If the short-period SMA is below the long-period SMA, the trend is bearish.
Interpretation and Signals: The Histogram
The histogram represents the difference between the moving averages. If the histogram is positive, the short average is above the long average. If the histogram is below zero, the short average is below the long average. Divergences with price provide signals of potential exhaustion in the movement, indicating a possible reversal.
Indicator Details
This indicator builds upon the traditional RSI by integrating additional features that enhance its utility for traders. Here’s how each component is calculated and how they contribute to the originality of the script:
Fast RSI and Slow RSI: The fast RSI is calculated using a shorter lookback period, allowing it to capture rapid changes in momentum. The slow RSI uses a longer period to smooth out fluctuations and provide a broader view of the trend. These two RSIs work together to identify significant momentum shifts.
SMA of RSI values: The simple moving averages (SMA) of the fast and slow RSI help filter out noise and provide clear crossover signals. The SMAs are calculated using standard formulas but applied to the RSI values rather than price data, which adds a layer of insight into momentum trends.
Histogram calculation: The histogram represents the difference between the SMA of the fast RSI and the SMA of the slow RSI. This value gives a visual representation of the convergence or divergence of momentum. When the histogram crosses zero, it signifies a potential shift in the underlying trend.
This indicator combines multiple layers of analysis: fast and slow momentum, trend confirmation through SMAs, and divergence detection via the histogram. This multi-dimensional approach provides traders with a more comprehensive tool for trend analysis and decision-making.
Conclusion
This article has explored how to use this indicator to identify trends, leverage entry patterns, and analyze divergences by combining the fast RSI, slow RSI, their moving averages, and a histogram. Additionally, I’ve detailed how I usually interpret this indicator:
Identifying RSI patterns to anticipate momentum changes.
Using SMAs to confirm base trends.
Leveraging the histogram to detect divergences and potential price reversals.
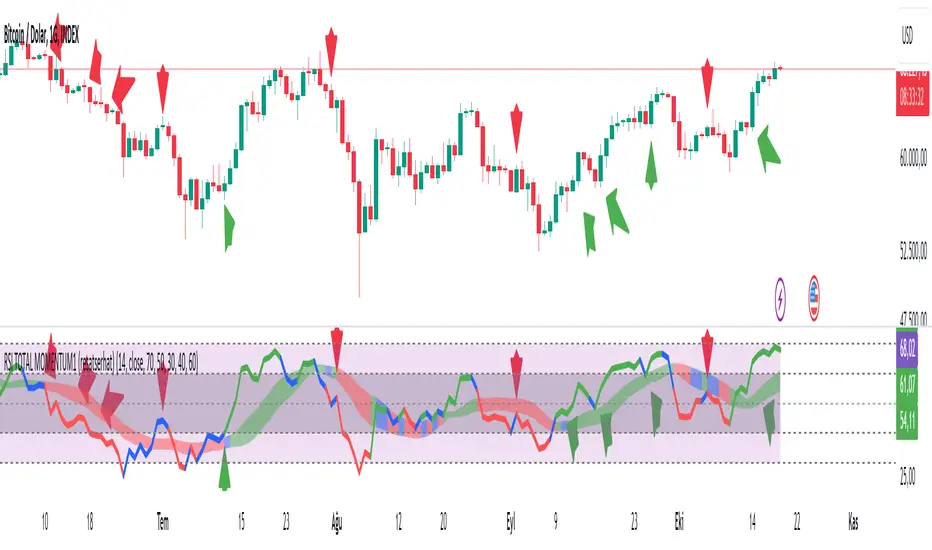
RSI TOTAL MOMENTUM1 (resatserhat)SOURCE OF COLORS
Our oscillator is the classic RSI oscillator. However, in the classic RSI oscillator, only RSI14 is taken into account, the user looks at different periods when he wants, and each period shows a different level. This situation confuses the user and prevents him from reaching a clear conclusion. This indicator takes into account the relationship between more than 1 or even 10 RSI periods, and shows us with colors which direction the momentum is in all periods and how strong it is. In other words, the mathematics underlying the coloring is the relationship between different RSI periods.
RSI COLORS
The RSI line has 3 colors: red, green, blue. The red color indicates that the momentum is weakening, the green color indicates that it is strengthening, and the blue color indicates that the momentum is unstable and can switch from red to green or from green to red at any moment.
BOLLINGER BAND COLORS
It is formed by considering the same mathematics as the RSI line colors, but it shows the momentum of larger periods. That is, it changes color later than the RSI line, but it is more reliable and accurate.
Colors in Hidden Divergences
In hidden negative divergences and hidden positive divergences, a single bar usually has an outlier color, this should be taken into consideration.
How to Use Colors?
1. When the RSI shows green bottom, blue bottom or green and blue mixed bottoms, it is a strong bullish signal.
2. When the RSI shows red top, blue top or red and blue mixed tops, it is a strong bearish signal.
3. When the RSI and BAND colors are bearish, it creates a strong signal.
4. When the RSI performs the actions in the 1st definition above the Bollinger Band, the buy signal should be trusted more.
5. When the RSI performs the actions in the 2nd definition below the Bollinger Band, the sell signal should be trusted more.
40-60 LEVELS
The 40-60 levels are strong resistance and support levels. Added for the Andrew Cardwell strategy. Blue, green or blue-green mixed bottoms occurring close to the 60 level bring strong upward movements
Red, blue or red-blue mixed tops occurring close to the 40 level bring strong downward movements.
Also in the oscillator, when RSI14 goes above the 80 level, the background color turns red. When it falls below the 20 level, the background color turns green. The first one indicates a sell zone, the second one indicates a buy zone.
TÜRKÇE
RENKLERİN KAYNAĞI
Osilatörümüz klasik RSI osilatörüdür. Fakat klasik RSI osilatöründe sadece RSI14 dikkate alınır, kullanıcı istediğinde farklı periyotlara bakar ve her periyot farklı bir seviye gösterir. Bu durum kullanıcının zihnini karıştırır, net bir kanıya varmasını önler. İşte bu indikatör 1’den hatta 10’dan fazla RSI periyodu arasındaki ilişkiyi dikkate alarak, bütün periyotlardaki momentumun hangi yönde olduğunu ve hangi güçte olduğunu renklerle bize gösterir. Yani Renklendirmenin temelinde yatan matematik farklı RSI periyotları arasındaki ilişkidir.
RSI RENKLERİ
RSI çizgisi kırmızı, yeşil, mavi olmak üzere 3 renk taşır. Kırmızı renk momentumun zayıfladığını gösterir, yeşil renk güçlendiğini, mavi renk ise momentumun kararsız olduğunu ve her an kırmızdan yeşile veya yeşilden kırmızıya geçebileceğini söyler.
BOLLİNGER BANDI RENKLERİ
RSI çizgisi renkleri ile aynı matematik dikkate alınarak oluşur, fakat daha büyük periyotların momentumunu gösterir. Yani RSI çizgisine göre daha geç renk değiştirir ama daha güvenilir ve kesindir.
Gizli Uyumsuzluklarda Renkler
Gizli negatif uyumsuzluk ve gizli pozitif uyumsuzluklarda genelde tek bir barda aykırı renk oluşur, bu husus dikkate alınmalıdır.
Renkler Nasıl Kullanılmalı?
1. RSI yeşil dip, mavi dip veya yeşil ve mavi karışımı dipler gösterdiğinde yükseliş yönlü güçlü bir sinyaldir.
2. RSI kırmızı tepe, mavi tepe veya kırmızı ve mavi karışışımı tepeler gösterdiğinde düşüş yönlü güçlü bir sinyaldir.
3. RSI ve BAND renkleri ayı olduğunda güçlü bir sinyal oluşturur.
4. RSI bollinger bandının üstünde 1. Tanımdaki eylemleri gerçekleştirdiğinde alım sinyaline daha çok güvenilmeli.
5. RSI bollinger bandının altında 2. Tanımdaki eylemleri gerçekleştirdiğinde satım sinyaline daha çok güvenilmeli.
40-60 SEVİYELERİ
40-60 seviyeleri güçlü direnç ve destek seviyeleridir. Andrew Cardwell stratejisi için eklenmiştir. 60 seviyesine yakın gerçekleşen mavi, yeşil veya mavi-yeşil karışımı dipler güçlü yükseliş hareketleri getirir
40 seviyesine yakın gerçekleşen kırmızı, mavi veya kırmızı-mavi karışımı tepeler güçlü düşüş hareketleri getirir.
Osilatörde ayrıca RSI14 80 seviyesinin üzerine çıktığında arka plan rengi kırmızıya dönüşür. 20 seviyesinin altına düştüğüne arkaplan rengi yeşile dönüşür. İlki satış bölgesi ikincisi alış bölgesi olduğunu haber eder.
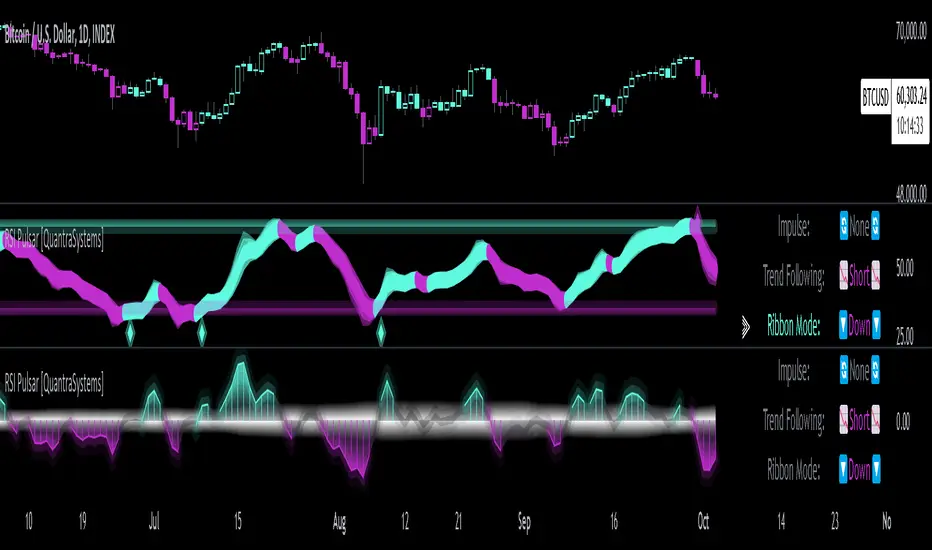
RSI Pulsar [QuantraSystems]RSI Pulsar
Introduction
The RSI Pulsar is an advanced and multifaceted tool designed to cater to the varying needs of traders, from long-term swing traders to higher-frequency day traders. This indicator takes the Relative Strength Index (RSI) to new heights by combining several unique methodologies to provide clear, actionable signals across different market conditions. With its ability to analyze impulsive trend strength, volatility, and binary market direction, the RSI Pulsar offers a holistic view of the market that assists traders in identifying robust signals and rotational opportunities within a volatile market.
The integration of dynamic color coding further aids in quick visual assessments, allowing traders to adapt swiftly to changing market conditions, making the RSI Pulsar an essential component in the arsenal of modern traders aiming for precision and adaptability in their trading endeavors.
Legend
The RSI Pulsar encapsulates various modes tailored to diverse trading strategies. The different modes are the:
Impulse Mode:
Focuses on strong outperformance, ideal for capturing movements in highly dynamic tokens.
Trend Following Mode:
A classical perpetual trend-following approach and provides binary long and short signal classifications ideal for medium term swing trading.
Ribbon Mode:
Offers quicker signals that are also binary in nature. Perfect for a confirmation signal when building higher frequency day trading systems.
Volatility Spectrum:
This feature projects a visual 'cloud' representing volatility, which helps traders spot emerging trends and potential breakouts or reversals.
Compressed Mode:
A condensed view that displays all signals in a clean and space-efficient manner. It provides a clear summary of market conditions, ideal for traders who prefer a simplified overview.
Methodology
The RSI Pulsar is built on a foundation of dynamic RSI analysis, where the traditional RSI is enhanced with advanced moving averages and standard deviation calculations. Each mode within the RSI Pulsar is designed to cater to specific aspects of the market's behavior, making it a versatile tool allowing traders to select different modes based on their trading style and market conditions.
Impulse Mode:
This mode identifies strong outperformance in assets, making it ideal for asset rotation systems. It uses a combination of RSI thresholds and dynamic moving averages to pinpoint when an asset is not just trending positively, but doing so with significant strength.
This is in contrast to typical usage of a base RSI, where elevated levels usually signal overbought and oversold periods. The RSI Pulsar flips this logic, where more extreme values are actually interpreted as a strong trend.
Trend Following Mode:
Here, the RSI is compared to the midline (the default is level 50, but a dynamic midline can also be set), to determine the prevailing trend. This mode simplifies the trend-following process, providing clear bullish or bearish signals based on whether the RSI is above or below the midline - whether a fixed or dynamic level.
Ribbon Mode:
This mode employs a series of calculated values derived from modified Heikin-Ashi smoothing to create a "ribbon" that smooths out price action and highlights underlying trends. The Ribbon Mode is particularly useful for traders who need quick confirmations of trend reversals or continuations.
Volatility Spectrum:
The Volatility Spectrum takes a unique approach to measuring market volatility by analyzing the size and direction of Heikin-Ashi candles. This data is used to create a volatility cloud that helps traders identify when volatility is rising, falling, or neutral - allowing them to adjust their strategies accordingly.
When the signal line breaks above the cloud, it signals increasing upwards volatility. When it breaks below it signifies increasing downwards volatility.
This can be used to help identify strengthening and weakening trends, as well as imminent volatile periods, allowing traders to position themselves and adapt their strategies accordingly. This mode also works as a great volatility filter for shorter term day trading strategies. It is incredibly sensitive to volatility divergences, and can give additional insights to larger market turning points.
Compressed Mode:
In Compressed Mode, all the signals from the various modes are displayed in a simplified format, making it easy for traders to quickly assess the market's overall condition without needing to delve into the details of each mode individually. Perfect for only viewing the exact data you need when live trading, or back testing.
Case Study I:
Utilizing ALMA Impulse Mode in High-Volatility Environments
Here, the RSI Pulsar is configured with an RSI length of 9 and an ALMA length of 2 in Impulse Mode. The chart example shows how this setup can identify significant price movements, allowing traders to enter positions early and capture substantial price moves. Despite the fast settings resulting in occasional false signals, the indicator's ability to catch and ride out major trends more than compensates, making it highly effective in volatile environments.
This configuration is suitable for traders seeking to trade quick, aggressive movements without enduring prolonged drawdowns. In Impulse Mode, the RSI Pulsar seeks strong trending zones, providing actionable signals that allow for timely entries and exits.
Case Study II:
SMMA Trend Following Mode for Ratio Analysis
The RSI Pulsar in Trend Following mode, configured with the SMMA with default length settings. This setup is ideal for analyzing longer-term trends, particularly useful in cryptocurrency pairs or ratio charts, where it’s crucial to identify robust directional moves. The chart showcases strong trends in the Solana/Ethereum pair. The RSI Pulsar’s ability to smooth out price action while remaining responsive to trend changes makes it an excellent tool for capturing extended price moves.
The image highlights how the RSI Pulsar efficiently tracks the strength of two tokens against each other, providing clear signals when one asset begins to outperform the other. Even in volatile markets, the SMMA ensures that the signals are reliable, filtering out noise and allowing traders to stay in the trend longer without being shaken out by minor corrections. This approach is particularly effective in ratio trading in order to inform a longer term swing trader of the strongest asset out of a customized pair.
Case Study III:
Monthly Analysis with RSI Pulsar in Ribbon Mode
This case study demonstrates the versatility and reliability of the RSI Pulsar in Ribbon mode, applied to a monthly chart of Bitcoin with an RSI length of 8 and a TEMA length of 14. This setup highlights the indicator’s robustness across multiple timeframes, extending even to long-term analysis. The RSI Pulsar effectively smooths out noise while capturing significant trends, as seen during Bitcoin bull markets. The Ribbon mode provides a clear visual representation of momentum shifts, making it easier for traders to identify trend continuations and reversals with confidence.
Case Study IV:
Divergences and Continuations with the Volatility Spectrum
Identifying harmony/divergences can be hit-or-miss at times, but this unique analysis method definitely has its merits at times. The RSI Pulsar, with its Volatility Spectrum feature, is used here to identify critical moments where price action either aligns with or diverges from the underlying volatility. As seen in the Bitcoin chart (using default settings), the indicator highlights areas where price trends either continue in harmony with volatility or diverge, signaling potential reversals. This method, while not always perfect, provides significant insight during key turning points in the market.
The Volatility Spectrum's visual representation of rising and falling volatility, combined with divergence and harmony analysis, enables traders to anticipate significant shifts in market dynamics. In this case, multiple divergences correctly identified early trend reversals, while periods of harmony indicated strong trend continuations. While this method requires careful interpretation, especially during complex market conditions, it offers valuable signals that can be pivotal in making informed trading decisions, especially if combined with other forms of analysis it can form a critical component of an investing system.
RSI with Swing Trade by Kelvin_VAlgorithm Description: "RSI with Swing Trade by Kelvin_V"
1. Introduction:
This algorithm uses the RSI (Relative Strength Index) and optional Moving Averages (MA) to detect potential uptrends and downtrends in the market. The key feature of this script is that it visually changes the candle colors based on the market conditions, making it easier for users to identify potential trend swings or wave patterns.
The strategy offers flexibility by allowing users to enable or disable the MA condition. When the MA condition is enabled, the strategy will confirm trends using two moving averages. When disabled, the strategy will only use RSI to detect potential market swings.
2. Key Features of the Algorithm:
RSI (Relative Strength Index):
The RSI is used to identify potential market turning points based on overbought and oversold conditions.
When the RSI exceeds a predefined upper threshold (e.g., 60), it suggests a potential uptrend.
When the RSI drops below a lower threshold (e.g., 40), it suggests a potential downtrend.
Moving Averages (MA) - Optional:
Two Moving Averages (Short MA and Long MA) are used to confirm trends.
If the Short MA crosses above the Long MA, it indicates an uptrend.
If the Short MA crosses below the Long MA, it indicates a downtrend.
Users have the option to enable or disable this MA condition.
Visual Candle Coloring:
Green candles represent a potential uptrend, indicating a bullish move based on RSI (and MA if enabled).
Red candles represent a potential downtrend, indicating a bearish move based on RSI (and MA if enabled).
3. How the Algorithm Works:
RSI Levels:
The user can set RSI upper and lower bands to represent potential overbought and oversold levels. For example:
RSI > 60: Indicates a potential uptrend (bullish move).
RSI < 40: Indicates a potential downtrend (bearish move).
Optional MA Condition:
The algorithm also allows the user to apply the MA condition to further confirm the trend:
Short MA > Long MA: Confirms an uptrend, reinforcing a bullish signal.
Short MA < Long MA: Confirms a downtrend, reinforcing a bearish signal.
This condition can be disabled, allowing the user to focus solely on RSI signals if desired.
Swing Trade Logic:
Uptrend: If the RSI exceeds the upper threshold (e.g., 60) and (optionally) the Short MA is above the Long MA, the candles will turn green to signal a potential uptrend.
Downtrend: If the RSI falls below the lower threshold (e.g., 40) and (optionally) the Short MA is below the Long MA, the candles will turn red to signal a potential downtrend.
Visual Representation:
The candle colors change dynamically based on the RSI values and moving average conditions, making it easier for traders to visually identify potential trend swings or wave patterns without relying on complex chart analysis.
4. User Customization:
The algorithm provides multiple customization options:
RSI Length: Users can adjust the period for RSI calculation (default is 4).
RSI Upper Band (Potential Uptrend): Users can customize the upper RSI level (default is 60) to indicate a potential bullish move.
RSI Lower Band (Potential Downtrend): Users can customize the lower RSI level (default is 40) to indicate a potential bearish move.
MA Type: Users can choose between SMA (Simple Moving Average) and EMA (Exponential Moving Average) for moving average calculations.
Enable/Disable MA Condition: Users can toggle the MA condition on or off, depending on whether they want to add moving averages to the trend confirmation process.
5. Benefits of the Algorithm:
Easy Identification of Trends: By changing candle colors based on RSI and MA conditions, the algorithm makes it easy for users to visually detect potential trend reversals and trend swings.
Flexible Conditions: The user has full control over the RSI and MA settings, allowing them to adapt the strategy to different market conditions and timeframes.
Clear Visualization: With the candle color changes, users can quickly recognize when a potential uptrend or downtrend is forming, enabling faster decision-making in their trading.
6. Example Usage:
Day traders: Can apply this strategy on short timeframes such as 5 minutes or 15 minutes to detect quick trends or reversals.
Swing traders: Can use this strategy on longer timeframes like 1 hour or 4 hours to identify and follow larger market swings.

RSI ProfitGuard [CHE]The RSI ProfitGuard Indicator is a comprehensive tool designed to assist traders in making informed decisions by integrating the Relative Strength Index (RSI) with automated Take Profit (TP) and Stop Loss (SL) levels. This indicator enhances trading strategies by providing clear entry signals and risk management parameters.
Key Features
RSIBased Signals: Utilizes RSI crossovers and crossunders to generate trade signals.
Automated TP and SL: Automatically calculates and plots Take Profit and Stop Loss levels based on userdefined methods.
Customizable Trade Types: Supports Long trades, Short trades, or both simultaneously.
Flexible Calculation Methods: Choose between Percentagebased or ATRbased methods for determining TP and SL levels.
Visual Enhancements: Highlights overbought and oversold RSI regions with background colors and marks trade entries with arrows.
Alerts: Provides realtime alerts when TP or SL levels are reached, ensuring timely trade management.
How It Works
1. RSI Calculation: The indicator calculates the RSI value based on the specified length.
2. Trade Signals:
Long Entry: Triggered when RSI crosses above the defined crossover threshold.
Short Entry: Triggered when RSI crosses below the defined crossunder threshold.
3. TP/SL Level Determination:
Percentage Method: Sets TP and SL as a percentage above and below the entry price.
ATR Method: Sets TP and SL based on the Average True Range (ATR), allowing for dynamic adjustments based on market volatility.
4. Visualization: Draws lines and labels on the chart to indicate TP, SL, and entry points.
5. Trade Management: Monitors price movements to determine if TP or SL levels are hit, automatically managing the trade state.
Customization Options
Trade Type Selection: Choose to execute Long trades, Short trades, or both.
RSI Settings:
RSI Length: Defines the period for RSI calculation (default is 14).
Crossover Threshold: RSI level above which a Long entry is signaled (default is 65).
Crossunder Threshold: RSI level below which a Short entry is signaled (default is 35).
Delay Settings: Sets the minimum number of bars between consecutive trade signals to avoid overtrading.
TP/SL Settings:
Method Selection: Choose between Percentage or ATRbased calculations.
Percentage Values: Define the percentage for TP and SL levels.
ATR Settings: Define ATR length and multipliers for TP and SL when using the ATR method.
Visual Settings:
Line Colors and Styles: Customize the appearance of TP, SL, crossover, and crossunder lines.
Transparency: Adjust the transparency of lines for better chart visibility.
Label Offset: Position labels at a specified number of bars to the right for clarity.
Using the Indicator
1. Add to Chart: Apply the RSI ProfitGuard Indicator to your TradingView chart.
2. Configure Settings: Adjust the parameters according to your trading strategy and risk tolerance.
3. Interpret Signals:
Long Entries: Look for green upward arrows indicating potential buy opportunities.
Short Entries: Look for red downward arrows indicating potential sell opportunities.
4. Monitor TP and SL Levels: Observe the plotted lines and labels to manage your trades effectively.
5. Set Up Alerts: Enable alerts to receive notifications when TP or SL levels are reached, ensuring you can act promptly.
Benefits
Enhanced DecisionMaking: Combines RSI signals with clear risk management levels.
Time Efficiency: Automates the calculation and plotting of TP and SL, saving time and reducing manual errors.
Flexibility: Adapts to various trading styles and market conditions through customizable settings.
Risk Management: Helps in defining and adhering to risk parameters, essential for longterm trading success.
Conclusion
The RSI ProfitGuard Indicator is an invaluable tool for traders seeking to integrate technical analysis with automated risk management. Its customizable features and realtime alerts provide a robust framework for executing and managing trades with confidence.
Disclaimer
The content provided with our RSI ProfitGuard Indicator, including all code, scripts, lessons, and materials, is strictly for educational and informational purposes only. It is not intended as, and should not be interpreted as, financial advice, a recommendation to buy or sell, or an offer of any financial product or service.
Key Points:
Educational Purpose:
All strategies, tools, and examples included within the RSI ProfitGuard Indicator are provided solely for illustrative purposes. They are designed to demonstrate coding techniques and the functionality of Pine Script within a trading context.
No Financial Advice:
The RSI ProfitGuard Indicator does not constitute financial advice. Users should not rely on it as a basis for making investment or trading decisions.
Hypothetical Results:
Any results or performance metrics derived from using the RSI ProfitGuard Indicator are purely hypothetical. Past performance is not indicative of future results, and there is no guarantee of profitability.
Risk Disclosure:
Trading and investing involve significant risks, including the potential loss of principal. The RSI ProfitGuard Indicator is not suitable for all persons, and users should be aware of the inherent risks involved in trading.
Professional Consultation:
Before making any trading decisions, it is strongly recommended to consult with a qualified financial professional to fully understand the risks and ensure that such decisions align with your financial situation and goals.
User Responsibility:
By using the RSI ProfitGuard Indicator, you acknowledge and agree that all trading decisions are made solely at your own discretion and risk. The developers and providers of the RSI ProfitGuard Indicator assume no responsibility or liability for any losses or damages resulting from its use.
Additional Notes:
No Guarantees:
There are no guarantees regarding the accuracy, reliability, or completeness of the RSI ProfitGuard Indicator. Users utilize the tool at their own risk.
No Endorsement:
Any mention of third-party products, services, or strategies within the RSI ProfitGuard Indicator does not constitute an endorsement or recommendation.
Updates and Modifications:
The RSI ProfitGuard Indicator may be updated or modified over time. Users are responsible for staying informed about any changes and understanding how they may impact the use of the tool.
Summary
This disclaimer clearly states that the RSI ProfitGuard Indicator is intended for educational purposes and should not be used as financial advice. It highlights the risks associated with trading, the hypothetical nature of any results, and the importance of consulting with a financial professional. Additionally, it emphasizes that users are solely responsible for their trading decisions and any outcomes that result from using the indicator.
Tips for Implementation:
Visibility:
Ensure that this disclaimer is prominently displayed wherever the RSI ProfitGuard Indicator is offered, such as on your website, within the TradingView description, or in any accompanying documentation.
Clarity:
Use clear and concise language to make sure that all users understand the limitations and responsibilities associated with using the indicator.
Legal Review:
Consider having the disclaimer reviewed by a legal professional to ensure that it meets all necessary legal requirements and adequately protects your interests.
Regular Updates:
Periodically review and update the disclaimer to reflect any changes in the indicator's functionality or in relevant laws and regulations.

RSI Overlay Table - 30 Tickers Sorted with ColorOverview
The RSI Overlay Table script provides traders with a powerful tool to monitor the Relative Strength Index (RSI) across multiple tickers in real-time. This script enables users to keep track of up to 30 different assets simultaneously, displaying their RSI values in an easy-to-read table format directly on the chart. It helps traders identify overbought and oversold conditions quickly, enhancing their ability to make informed trading decisions.
Key Features
Monitor Multiple Tickers: Track the RSI values of up to 30 different tickers at once. This allows users to have a broad view of market conditions across various assets without the need to switch between charts.
Dynamic RSI Calculations: The script calculates the RSI using the user-defined length, providing flexibility to adjust sensitivity based on the trading strategy. The default RSI length is set to 14, a commonly used period in technical analysis.
Customizable Overbought and Oversold Levels: Users can define their own overbought and oversold RSI levels, allowing them to tailor the script to their trading style. By default, the overbought level is set at 70, and the oversold level is set at 30.
Hide Neutral Rows Option: To help traders focus on the most critical signals, the script includes an option to hide rows where the RSI values are neither overbought nor oversold. This feature helps traders concentrate on assets that are more likely to experience a price reversal.
Color-Coded Alerts: The script highlights overbought and oversold conditions with distinct colors:
Red: Indicates that the asset is overbought (RSI above the user-defined overbought level).
Green: Indicates that the asset is oversold (RSI below the user-defined oversold level).
How to Use the RSI Overlay Table Script
Input Tickers: Enter up to 30 ticker symbols in the script settings. The script will automatically fetch the RSI values for each ticker and display them in the overlay table on the chart.
Adjust RSI Settings: Modify the RSI length and the overbought/oversold levels according to your trading strategy. These settings can be adjusted in the script input panel.
Use the Hide Neutral Rows Option: Toggle the “Hide Neutral Rows” option to focus only on tickers that are in overbought or oversold conditions. This feature is useful for traders who wish to filter out less significant signals and only act on strong RSI indicators.
Interpret the Table: The table will display each ticker symbol alongside its current RSI value. Tickers with RSI values above the overbought level will be highlighted in red, suggesting a potential sell signal. Tickers with RSI values below the oversold level will be highlighted in green, indicating a potential buy signal.
Application and Strategy
The RSI Overlay Table script is designed for traders who manage multiple assets and need to monitor their technical indicators efficiently. It is particularly useful for:
Swing Traders: Identifying overbought and oversold conditions to time entries and exits.
Portfolio Managers: Monitoring the relative strength of various assets in a portfolio.
Scalpers: Quickly spotting extreme price movements across multiple assets.
Notes
This script is intended to be used as a supplementary tool for technical analysis. Always use it in conjunction with other indicators and market analysis techniques.
The RSI values and signals provided by this script should not be taken as financial advice.
The RSI Overlay Table script provides a clear and efficient way to track RSI values across multiple assets, helping traders make more informed decisions. By offering customizable settings and a clean, color-coded interface, this tool aims to enhance the user's trading experience and streamline their analysis process.

RSI K-Means Clustering [UAlgo]The "RSI K-Means Clustering " indicator is a technical analysis tool that combines the Relative Strength Index (RSI) with K-means clustering techniques. This approach aims to provide more nuanced insights into market conditions by categorizing RSI values into overbought, neutral, and oversold clusters.
The indicator adjusts these clusters dynamically based on historical RSI data, allowing for more adaptive and responsive thresholds compared to traditional fixed levels. By leveraging K-means clustering, the indicator identifies patterns in RSI behavior, which can help traders make more informed decisions regarding market trends and potential reversals.
🔶 Key Features
K-means Clustering: The indicator employs K-means clustering, an unsupervised machine learning technique, to dynamically determine overbought, neutral, and oversold levels based on historical RSI data.
User-Defined Inputs: You can customize various aspects of the indicator's behavior, including:
RSI Source: Select the data source used for RSI calculation (e.g., closing price).
RSI Length: Define the period length for RSI calculation.
Training Data Size: Specify the number of historical RSI values used for K-means clustering.
Number of K-means Iterations: Set the number of iterations performed by the K-means algorithm to refine cluster centers.
Overbought/Neutral/Oversold Levels: You can define initial values for these levels, which will be further optimized through K-means clustering.
Alerts: The indicator can generate alerts for various events, including:
Trend Crossovers: Alerts for when the RSI crosses above/below the neutral zone, signaling potential trend changes.
Overbought/Oversold: Alerts when the RSI reaches the dynamically determined overbought or oversold thresholds.
Reversals: Alerts for potential trend reversals based on RSI crossing above/below the calculated overbought/oversold levels.
RSI Classification: Alerts based on the current RSI classification (ranging, uptrend, downtrend).
🔶 Interpreting Indicator
Adjusted RSI Value: The primary plot represents the adjusted RSI value, calculated based on the relative position of the current RSI compared to dynamically adjusted overbought and oversold levels. This value provides an intuitive measure of the market's momentum. The final overbought, neutral, and oversold levels are determined by K-means clustering and are displayed as horizontal lines. These levels serve as dynamic support and resistance points, indicating potential reversal zones.
Classification Symbols : The "RSI K-Means Clustering " indicator uses specific symbols to classify the current market condition based on the position of the RSI value relative to dynamically determined clusters. These symbols provide a quick visual reference to help traders understand the prevailing market sentiment. Here's a detailed explanation of each classification symbol:
Ranging Classification ("R")
This symbol appears when the RSI value is closest to the neutral threshold compared to the overbought or oversold thresholds. It indicates a ranging market, where the price is moving sideways without a clear trend direction. In this state, neither buyers nor sellers are in control, suggesting a period of consolidation or indecision. This is often seen as a time to wait for a breakout or reversal signal before taking a position.
Up-Trend Classification ("↑")
The up-trend symbol, represented by an upward arrow, is displayed when the RSI value is closer to the overbought threshold than to the neutral or oversold thresholds. This classification suggests that the market is in a bullish phase, with buying pressure outweighing selling pressure. Traders may consider this as a signal to enter or hold long positions, as the price is likely to continue rising until the market reaches an overbought condition.
Down-Trend Classification ("↓")
The down-trend symbol, depicted by a downward arrow, appears when the RSI value is nearest to the oversold threshold. This indicates a bearish market condition, where selling pressure dominates. The market is likely experiencing a downward movement, and traders might view this as an opportunity to enter or hold short positions. This symbol serves as a warning of potential further declines, especially if the RSI continues to move toward the oversold level.
Bullish Reversal ("▲")
This signal occurs when the RSI value crosses above the oversold threshold. It indicates a potential shift from a downtrend to an uptrend, suggesting that the market may start to move higher. Traders might use this signal as an opportunity to enter long positions.
Bearish Reversal ("▼")
This signal appears when the RSI value crosses below the overbought threshold. It suggests a possible transition from an uptrend to a downtrend, indicating that the market may begin to decline. This signal can alert traders to consider entering short positions or taking profits on long positions.
These classification symbols are plotted near the adjusted RSI line, with their positions adjusted based on the standard deviation and a distance multiplier. This placement helps in visualizing the classification's strength and ensuring clarity in the indicator's presentation. By monitoring these symbols, traders can quickly assess the market's state and make more informed trading decisions.
🔶 Disclaimer
Use with Caution: This indicator is provided for educational and informational purposes only and should not be considered as financial advice. Users should exercise caution and perform their own analysis before making trading decisions based on the indicator's signals.
Not Financial Advice: The information provided by this indicator does not constitute financial advice, and the creator (UAlgo) shall not be held responsible for any trading losses incurred as a result of using this indicator.
Backtesting Recommended: Traders are encouraged to backtest the indicator thoroughly on historical data before using it in live trading to assess its performance and suitability for their trading strategies.
Risk Management: Trading involves inherent risks, and users should implement proper risk management strategies, including but not limited to stop-loss orders and position sizing, to mitigate potential losses.
No Guarantees: The accuracy and reliability of the indicator's signals cannot be guaranteed, as they are based on historical price data and past performance may not be indicative of future results.

RSI Analysis with Statistical Summary Scientific Analysis of the Script "RSI Analysis with Statistical Summary"
Introduction
I observed that there are outliers in the price movement liquidity, and I wanted to understand the RSI value at those points and whether there are any notable patterns. I aimed to analyze this statistically, and this script is the result.
Explanation of Key Terms
1. Outliers in Price Movement Liquidity: An outlier is a data point that significantly deviates from other values. In this context, an outlier refers to an unusually high or low liquidity of price movement, which is the ratio of trading volume to the price difference between the open and close prices. These outliers can signal important market changes or unusual trading activities.
2. RSI (Relative Strength Index): The RSI is a technical indicator that measures the speed and change of price movements. It ranges from 0 to 100 and helps identify overbought or oversold conditions of a trading instrument. An RSI value above 70 indicates an overbought condition, while a value below 30 suggests an oversold condition.
3. Mean: The mean is a measure of the average of a dataset. It is calculated by dividing the sum of all values by the number of values. In this script, the mean of the RSI values is calculated to provide a central tendency of the RSI distribution.
4. Standard Deviation (stdev): The standard deviation is a measure of the dispersion or variation of a dataset. It shows how much the values deviate from the mean. A high standard deviation indicates that the values are widely spread, while a low standard deviation indicates that the values are close to the mean.
5. 68% Confidence Interval: A confidence interval indicates the range within which a certain percentage of values of a dataset lies. The 68% confidence interval corresponds to a range of plus/minus one standard deviation around the mean. It indicates that about 68% of the data points lie within this range, providing insight into the distribution of values.
Overview
This Pine Script™, written in Pine version 5, is designed to analyze the Relative Strength Index (RSI) of a stock or other trading instrument and create statistical summaries of the distribution of RSI values. The script identifies outliers in price movement liquidity and uses this information to calculate the frequency of RSI values. At the end, it displays a statistical summary in the form of a table.
Structure and Functionality of the Script
1. Input Parameters
- `rsi_len`: An integer input parameter that defines the length of the RSI (default: 14).
- `outlierThreshold`: An integer input parameter that defines the length of the outlier threshold (default: 10).
2. Calculating Price Movement Liquidity
- `priceMovementLiquidity`: The volume is divided by the absolute difference between the close and open prices to calculate the liquidity of the price movement.
3. Determining the Boundary for Liquidity and Identifying Outliers
- `liquidityBoundary`: The boundary is calculated using the Exponential Moving Average (EMA) of the price movement liquidity and its standard deviation.
- `outlier`: A boolean value that indicates whether the price movement liquidity exceeds the set boundary.
4. Calculating the RSI
- `rsi`: The RSI is calculated with a period length of 14, using various moving averages (e.g., SMA, EMA) depending on the settings.
5. Storing and Limiting RSI Values
- An array `rsiFrequency` stores the frequency of RSI values from 0 to 100.
- The function `f_limit_rsi` limits the RSI values between 0 and 100.
6. Updating RSI Frequency on Outlier Occurrence
- On an outlier occurrence, the limited and rounded RSI value is updated in the `rsiFrequency` array.
7. Statistical Summary
- Various variables (`mostFrequentRsi`, `leastFrequentRsi`, `maxCount`, `minCount`, `sum`, `sumSq`, `count`, `upper_interval`, `lower_interval`) are initialized to perform statistical analysis.
- At the last bar (`bar_index == last_bar_index`), a loop is run to determine the most and least frequent RSI values and their frequencies. Sum and sum of squares of RSI values are also updated for calculating mean and standard deviation.
- The mean (`mean`) and standard deviation (`stddev`) are calculated. Additionally, a 68% confidence interval is determined.
8. Creating a Table for Result Display
- A table `resultsTable` is created and filled with the results of the statistical analysis. The table includes the most and least frequent RSI values, the standard deviation, and the 68% confidence interval.
9. Graphical Representation
- The script draws horizontal lines and fills to indicate overbought and oversold regions of the RSI.
Interpretation of the Results
The script provides a detailed analysis of RSI values based on specific liquidity outliers. By calculating the most and least frequent RSI values, standard deviation, and confidence interval, it offers a comprehensive statistical summary that can help traders identify patterns and anomalies in the RSI. This can be particularly useful for identifying overbought or oversold conditions of a trading instrument and making informed trading decisions.
Critical Evaluation
1. Robustness of Outlier Identification: The method of identifying outliers is solely based on the liquidity of price movement. It would be interesting to examine whether other methods or additional criteria for outlier identification would lead to similar or improved results.
2. Flexibility of RSI Settings: The ability to select various moving averages and period lengths for the RSI enhances the adaptability of the script, allowing users to tailor it to their specific trading strategies.
3. Visualization of Results: While the tabular representation is useful, additional graphical visualizations, such as histograms of RSI distribution, could further facilitate the interpretation of the results.
In conclusion, this script provides a solid foundation for analyzing RSI values by considering liquidity outliers and enables detailed statistical evaluation that can be beneficial for various trading strategies.

RSI / Connectable [Azullian]Enhance your trading approach with the modular RSI indicator, skilled in identifying market extremes. Simplify pattern visualization and signal weighting for more efficient strategy formulation.
This connectable RSI indicator is part of an indicator system designed to help test, visualize and build strategy configurations without coding. Like all connectable indicators , it interacts through the TradingView input source, which serves as a signal connector to link indicators to each other. All connectable indicators send signal weight to the next node in the system until it reaches either a connectable signal monitor, signal filter and/or strategy.
█ UNIFORM SETTINGS AND A WAY OF WORK
Although connectable indicators may have specific weight scoring conditions, they all aim to follow a standardized general approach to weight scoring settings, as outlined below.
■ Connectable indicators - Settings
• 🗲 Energy: Energy applies an ATR multiplier to the plotted shapes on the chart. A higher value plots shapes farther away from the candle, enhancing visibility.
• ☼ Brightness: Brightness determines the opacity of the shape plotted on the chart, aiding visibility. Indicator weight also influences opacity.
• → Input: Use the input setting to specify a data source for the indicator. Here you can connect the indicator to other indicators.
• ⌥ Flow: Determine where you want to receive signals from:
○ Both: Weights from this indicator and the connected indicator will apply
○ Indicator only: Only weights from this indicator will apply
○ Input only: Only weights from the connected indicator will apply
• ⥅ Weight multiplier: Multiply all weights in the entire indicator by a given factor, useful for quickly testing different indicators in a granular setup.
• ⥇ Threshold: Set a threshold to indicate the minimum amount of weight it should receive to pass it through to the next indicator.
• ⥱ Limiter: Set a hard limit to the maximum amount of weight that can be fed through the indicator.
■ Connectable indicators - Weight scoring settings
▢ Weight scoring conditions
• SM – Signal mode: Enable specific conditions for weight scoring
○ All: All signals will be scored.
○ Entries only: Only entries will score.
○ Exits only: Only exits will score.
○ Entries & exits: Both entries and exits will score.
○ Zone: Continuous scoring for each candle within the zone.
• SP – Signal period: Defines a range of candles within which a signal can score.
• SC - Signal count: Specifies the number of bars to retrospectively examine and score.
○ Single: Score for a single occurrence
○ All occurrences: Score for all occurrences
○ Single + Threshold: Score for single occurrences within the signal period (SP)
○ Every + Threshold: Score for all occurrences within the signal period (SP)
▢ Weight scoring direction
• ES: Enter Short weight
• XL: Exit long weight
• EL: Enter Long weight
• XS: Exit Short weight
▢ Weight scoring values
• Weights can hold either positive or negative scores. Positive weights enhance a particular trading direction, while negative weights diminish it.
■ Entries, exits and zone illustrated on a standard RSI indicator when the RSI is overbought.
█ RSI - INDICATOR SETTINGS
■ Main settings
• Enable/Disable Indicator: Toggle the entire indicator on or off.
• S - Source: Choose an alternative data source for the RSI calculation.
• T - Timeframe: Select an alternative timeframe for the RSI calculation.
• LE - Length: Define the number of bars or periods used in the RSI calculation.
• OB - Overbought Level: Determine the RSI value at which overbought conditions are met.
• OS - Oversold Level: Specify the RSI value at which oversold conditions are met.
■ Scoring functionality
• The RSI scores long entries when the RSI enters OS: oversold area
• The RSI scores long exits when the RSI exits OS: oversold area
• The RSI scores long zones the entire time the RSI is in OS: oversold area
• The RSI scores short entries when the RSI enters OB: overbought area
• The RSI scores short exits when the RSI exits OB: overbought area
• The RSI scores short zones the entire time the RSI is in OB: overbought area
█ PLOTTING
• Standard: Symbols (EL, XS, ES, XL) appear relative to candles based on set conditions. Their opacity and position vary with weight.
• Conditional Settings: A larger icon appears if global conditions are met. For instance, with a Threshold(⥇) of 12, Signal Period (SP) of 3, and Scoring Condition (SC) set to "EVERY", an RSI signaling over two times in 3 candles (scoring 6 each) triggers a larger icon.
█ USAGE OF CONNECTABLE INDICATORS
■ Connectable chaining mechanism
Connectable indicators can be connected directly to the signal monitor, signal filter or strategy , or they can be daisy chained to each other while the last indicator in the chain connects to the signal monitor, signal filter or strategy. When using a signal filter you can chain the filter to the strategy input to make your chain complete.
• Direct chaining: Connect an indicator directly to the signal monitor, signal filter or strategy through the provided inputs (→).
• Daisy chaining: Connect indicators using the indicator input (→). The first in a daisy chain should have a flow (⌥) set to 'Indicator only'. Subsequent indicators use 'Both' to pass the previous weight. The final indicator connects to the signal monitor, signal filter, or strategy.
■ Set up this indicator with a signal filter and strategy
The indicator provides visual cues based on signal conditions. However, its weight system is best utilized when paired with a connectable signal filter, signal monitor, or strategy .
Let's connect the RSI to a connectable signal filter and a strategy :
1. Load all relevant indicators
• Load RSI / Connectable
• Load Signal filter / Connectable
• Load Strategy / Connectable
2. Signal Filter: Connect the RSI to the Signal Filter
• Open the signal filter settings
• Choose one of the three input dropdowns (1→, 2→, 3→) and choose : RSI / Connectable: Signal Connector
• Toggle the enable box before the connected input to enable the incoming signal
3. Signal Filter: Update the filter signals settings if needed
• The default settings of the filter enable EL (Enter Long), XL (Exit Long), ES (Enter Short) and XS (Exit Short).
4. Signal Filter: Update the weight threshold settings if needed
• All connectable indicators load by default with a score of 6 for each direction (EL, XL, ES, XS)
• By default, weight threshold (TH) is set at 5. This allows each occurrence to score, as the default score in each connectable indicator is 1 point above the threshold. Adjust to your liking.
5. Strategy: Connect the strategy to the signal filter in the strategy settings
• Select a strategy input → and select the Signal filter: Signal connector
6. Strategy: Enable filter compatible directions
• Set the signal mode of the strategy to a compatible direction with the signal filter.
Now that everything is connected, you'll notice green spikes in the signal filter representing long signals, and red spikes indicating short signals. Trades will also appear on the chart, complemented by a performance overview. Your journey is just beginning: delve into different scoring mechanisms, merge diverse connectable indicators, and craft unique chains. Instantly test your results and discover the potential of your configurations. Dive deep and enjoy the process!
█ BENEFITS
• Adaptable Modular Design: Arrange indicators in diverse structures via direct or daisy chaining, allowing tailored configurations to align with your analysis approach.
• Streamlined Backtesting: Simplify the iterative process of testing and adjusting combinations, facilitating a smoother exploration of potential setups.
• Intuitive Interface: Navigate TradingView with added ease. Integrate desired indicators, adjust settings, and establish alerts without delving into complex code.
• Signal Weight Precision: Leverage granular weight allocation among signals, offering a deeper layer of customization in strategy formulation.
• Advanced Signal Filtering: Define entry and exit conditions with more clarity, granting an added layer of strategy precision.
• Clear Visual Feedback: Distinct visual signals and cues enhance the readability of charts, promoting informed decision-making.
• Standardized Defaults: Indicators are equipped with universally recognized preset settings, ensuring consistency in initial setups across different types like momentum or volatility.
• Reliability: Our indicators are meticulously developed to prevent repainting. We strictly adhere to TradingView's coding conventions, ensuring our code is both performant and clean.
█ COMPATIBLE INDICATORS
Each indicator that incorporates our open-source 'azLibConnector' library and adheres to our conventions can be effortlessly integrated and used as detailed above.
For clarity and recognition within the TradingView platform, we append the suffix ' / Connectable' to every compatible indicator.
█ COMMON MISTAKES, CLARIFICATIONS AND TIPS
• Removing an indicator from a chain: Deleting a linked indicator and confirming the "remove study tree" alert will also remove all underlying indicators in the object tree. Before removing one, disconnect the adjacent indicators and move it to the object stack's bottom.
• Point systems: The azLibConnector provides 500 points for each direction (EL: Enter long, XL: Exit long, ES: Enter short, XS: Exit short) Remember this cap when devising a point structure.
• Flow misconfiguration: In daisy chains the first indicator should always have a flow (⌥) setting of 'indicator only' while other indicator should have a flow (⌥) setting of 'both'.
• Hide attributes: As connectable indicators send through quite some information you'll notice all the arguments are taking up some screenwidth and cause some visual clutter. You can disable arguments in Chart Settings / Status line.
• Layout and abbreviations: To maintain a consistent structure, we use abbreviations for each input. While this may initially seem complex, you'll quickly become familiar with them. Each abbreviation is also explained in the inline tooltips.
• Inputs: Connecting a connectable indicator directly to the strategy delivers the raw signal without a weight threshold, meaning every signal will trigger a trade.
█ A NOTE OF GRATITUDE
Through years of exploring TradingView and Pine Script, we've drawn immense inspiration from the community's knowledge and innovation. Thank you for being a constant source of motivation and insight.
█ RISK DISCLAIMER
Azullian's content, tools, scripts, articles, and educational offerings are presented purely for educational and informational uses. Please be aware that past performance should not be considered a predictor of future results.

RSI Supreme Multi-Method [MyTradingCoder]Introducing the "RSI Supreme Multi-Method" indicator, a powerful tool that combines the Relative Strength Index (RSI) with selectable manipulation methods to identify overbought and oversold conditions in the market, along with the ability to detect divergences for enhanced trading insights.
The indicator features four distinct manipulation methods for the RSI, each providing valuable insights into market conditions:
1. Standard RSI Method: The indicator uses the traditional RSI calculation to identify overbought and oversold areas.
2. Volatility Weighted RSI Method: This method applies a volatility formula to the RSI calculation, allowing for a more responsive indication of market conditions during periods of heightened volatility. Users can adjust the length of the volatility formula to fine-tune this method.
3. Smoothed RSI Method: The smoothed RSI method utilizes a smoothing algorithm to reduce noise in the RSI values, presenting a clearer representation of overbought and oversold conditions. The length of the smoothing can be adjusted to match your trading preferences.
4. Session Weighted RSI Method: With this innovative method, users can specify multipliers for different time sessions throughout the day to manipulate the base RSI. Each session can be customized with start and end times, enabling or disabling specific sessions, and specifying the multiplier for each session. This feature allows traders to adapt the RSI to different market sessions dynamically.
Additionally, the "RSI Supreme Multi-Method" indicator draws divergences on the oscillator, providing an extra layer of analysis for traders. Divergences occur when the direction of the RSI differs from the direction of the price movement, potentially signaling trend reversals.
Key Settings:
RSI Length: Adjust the length of the base RSI before applying any manipulation.
RSI Source: Determine the data source for the base RSI calculation.
Overbought Value: Set the RSI value at which overbought conditions are indicated.
Oversold Value: Set the RSI value at which oversold conditions are indicated.
RSI Type: Choose from four options: Standard, Smoothed, Volatility Manipulated, or Session Manipulated.
Volatility Manipulated Settings: Adjust the length of the volatility formula (applicable to Volatility Manipulated method).
Smoothed Settings: Adjust the length of the smoothing (applicable to Smoothed method).
Session Manipulated Settings: Customize six different time sessions with start and end times, enable or disable specific sessions, and specify multipliers for each session.
Divergence Color: Adjust the color of the drawn divergences to suit your chart's aesthetics.
Divergence Tuning: Fine-tune the sensitivity of the divergence detection for more accurate signals.
The "RSI Supreme Multi-Method" indicator is a versatile and comprehensive tool that can be used to identify overbought and oversold areas, as well as to spot potential trend reversals through divergences. However, like all technical analysis tools, it should be used in conjunction with other indicators and analysis methods to make well-informed trading decisions.
Enhance your trading insights with the "RSI Supreme Multi-Method" indicator and gain an edge in identifying critical market conditions and divergences with precision.

RSI Trend Transform [wbburgin]The RSI Trend Transform indicator is a dual-concept indicator that transforms volume data and price data into two different RSI values, which can then be used together to determine trend strength and momentum. The volume RSI does not use any price data in its calculation - it is purely a transform from nondirectional volume into a directional indicator.
The RSI for all three RSI values (price, volume,combined average) can be plotted as either stochastic or normal. The RSI calculation is adapted for use on volume, which is why the normal ta.rsi() function is not used for the price RSI calculation; both use the same formula for indicator consistency.
How to Use the Indicator
In the examples below, the Price RSI is plotted in yellow and the Volume RSI is plotted in red (length = 200, which is why the indicator is large in these examples). The indicator can be used on any timeframe and any asset, provided volume data is provided by the vendor to TradingView.
Identifying Bullish Trends
A rising volume RSI with a rising price RSI signifies a bullish trend. Example 1:
Example 2:
You can use the combined RSI (the average of the volume RSI and the price RSI) to help with the identification of these trends:
Identifying Bearish Trends
A falling volume RSI with a falling price RSI signifies a bearish trend:
Example 2:
Settings
Source is the source of the price RSI, the volume RSI will by default use volume in its calculations. If you have other indicators on-chart, you could even use the ATR, a volatility indicator, or any nondirectional or directional indicator and transform it into the "price" RSI.
Length is both the length of the RSI and the stochastic.
The next three rows are for each RSI you can plot on the indicator: price RSI, volume RSI, and combined RSI (average of price and volume). The first checkbox plots/removes them from the chart, you can subsequently choose the type of RSI (regular or stochastic), the color of the plot, and the length of the EMA smoothing applied afterward to the plot.
Upper Band and Lower Band refer to the overbought and oversold lines, respectively.
A note about the combined RSI- you will be unable to spot divergences if the combined RSI is the only plot on the indicator, so I encourage you to use the combined RSI as a way to confirm the overall trend if you notice the price RSI and the volume RSI and trending similarly.
RSI Dot Party - All Lengths From 1 To 120The RSI Dot Party indicator displays all RSI lengths from 1 to 120 as different colored dots on the chart.
🔶 Purpose
Show the reversal point of price action to time entries and exits.
🔶 USAGE
When a dot displays it is a indication of the reversal of the price/trend. The larger the dot the more likely it is to reverse.
The Default settings generates dots for extreme cases where the RSI is over = 90 or under = 10 for every RSI length in the range of 1-120.
Example if the RSI of length 1 or 2 or 3 or 4 or ... or 15 or 16 or 17 or ... or 80 or 81 or 82 or ... if any of does RSI crosses a boundary a dot is shown.
A boundary is the over/under the RSI oscillates in.
Customize the settings until the dots match up with the high and lows of past price action.
🔶 SETTINGS
🔹 Source
Source 1: Is the First Source RSI is calculated from
Source 2: Is the Second Source RSI is calculated from
🔹 Meta Settings
Hours back to draw: To speed up the script calculate it only draws a set number of hours back, default is 300 hours back in time to draw then it cuts off.
Show Dots: Show or disable dots
Show Bar Color: Color the bars for each RSI incident
Filter Cross: Filters and only shows dots when the RSI crosses above or bellow a boundary. If not all candles above or bellow the boundaries will display a dot.
Dots Location Absolute: Instead of showing the dots above or bellow the candle, the dots will show up on the top and bottom of the window.
🔹 7 RSI Groups
There are a total of 7 RSI colors.
Range Very Tiny: Default Color Green
Range Tiny: Default Color Purple
Range Small: Default Color Yellow
Range Normal: Default Color Red
Range Large: Default Color Blue
Range Huge: Default Color Dark Purple
Range Very Huge: Default Color White
🔹 RSI Group Settings
Hi/Low Color: Change the Color of that group.
Start/End: The Start and End range of this RSI color. Example if start = 5 and end = 10 the RSI of 5,6,7,8,9,10 will be displayed on the chart for that color, if any of does RSI goes above or bellow the boundary a dot is displayed on that candle.
Delay: The RSI needs to be above or bellow a boundary for x number of candles before displaying a dot. For example if delay = 2 and the RSI is over = 70 for 2 candles then it will display a dot.
Under/Over: Boundaries that indicate when to draw a dot, if over = 70 and RSI crosses above 70 a dot is displayed.
🔹 Show
Section that allows you to disable RSI grounds you dont want to see, this also removes them from the alert signal generated.
Show Low: Show or disable Low RSI dots
Show High: Show or disable High RSI dots
🔶 ALERTS
Alert for all New RSIs Dots Created in real time
The alert generated depends on what groups are showing or not, if the green group is disabled for example the alert will not be generated.
🔶 Warning
When a dot shows up it can continue moving. For example if a purple dot shows itself above a 15 minute candle, if that candle/price continue to extend up the dot will move up with it.
Dots can also disappear occasionally if the RSI moves in and out of a boundary within that candles life span.
🔶 Community
I hope you guys find this useful, if you have any questions or feature requests leave me a comment! Take care :D
RSI Timeframes + Shadow
The RSI Timeframes + Shadow can be used to view RSI in different graphic times and at the same time analyze the RSI of another asset correlated with the current example: altcoins and BTC dominance, equities and SP500 , Brazilian equities and IBOV or FIIs and IFIX .
Fast RSI - yellow line
Slow RSI - white line
Correlational RSI - red line
It allows you to set an additional time frame different to the one on your chart. With this you could for example use a slower RSI than your other Strategy's candle period.
In the example the vertical lines in the graph show when the fast RSI crosses above the slow RSI represented by the cyan line and when the fast RSI crosses below the slow RSI represented by the red line.
You can also change the settings to view the RSI of other assets correlated with the current one to track them in the same graph time.
This indicator works with any available symbol.
#brazilian portuguese
O RSI Shadow pode ser utilizado para ver o RSI em tempos gráficos diferentes e ao mesmo tempo analisar o RSI de outro ativo correlacionado com o atual exemplo: Altcoins e dominância do BTC , acoes e SP500 , acoes brasileiras e IBOV ou FIIs e IFIX .
RSI rápido - linha amarela
RSI lento - linha branca
RSI correlacional - linha vermelha
Ele permite que você defina um período de tempo adicional diferente daquele em seu gráfico. Com isso, você pode, por exemplo, usar um RSI mais lento do que o período de vela da sua outra estratégia.
No exemplo as linhas verticais no gráfico mostra quando o RSI rápido cruza acima do RSI lento representado pela linha ciano e quando RSI rápido cruza abaixo do RSI lento representado pela linha vermelha.
Voce também pode alterar as configurações para visualizar o RSI de outro ativo correlacionado com o atual para acompanha eles no mesmo tempo gráfico.
Esse indicador funciona com qualquer simbolo disponível.
RSI band with Signal alert//th/en
//th
สวัสดีครับท่านสมาชิก
ก่อนอื่นต้องขอเกริ่นก่อนเลยว่า Indicator ตัวนี้ถูกสร้างขึ้นมาบนพื้นฐานของ RSI จริง เพียงแต่ใช้ค่า EMA27 ในการสร้าง เนื่องจากผมยังไม่สามารถเขียน RSI band ที่โยงกับราคาได้ในส่วนนี้เองได้
แต่ทั้งนี้ขอให้ท่านใจเย็น ๆ และฟังผมสักหน่อย เนื่องจากก่อนหน้านี้ผมได้สังเกตเห็นว่า EMA27 นั้นมีค่าเท่ากับ RSI14 ที่ค่า 50 พอดี ดังนั้นผมจึงเลือกที่จะสร้างมันขึ้นมาด้วย EMA27 เพราะง่ายต่อการเขียน
วิธีการใช้งานมีดังต่อไปนี้
Indicator ตัวนี้ใช้งานเหมือน RSI14 วิธีการอ่านคือให้นับเส้น EMA27 เป็นค่า 50 ของ RSI14 ดังนั้นให้เราพิจารณาการซื้อขายดังต่อไปนี้ (โดยหลังจากนี้ผมจะเรียก EMA27 ที่สร้างขึ้นว่า RSI band)
พิจารณาเข้าซื้อ : เมื่อราคาทะลุ RSI band ขึ้นไปและย่อตัวทำ Higher Low เหนือเส้น RSI band
พิจารณาขายออก : เมื่อราคาทะลุ RSI band ลงมาและรีบาวน์ทำ Lower High ใต้เส้น RSI band
# ทั้งนี้ผมได้ทำสีแท่งเทียนไว้เพื่อให้ง่ายต่อการสังเกต โดยการนำไปใช้อาจนำสีของเส้นขอบแท่งเทียนออก แล้วในส่วนของไส้แท่งเทียนให้ใช้สีที่ไม่เจาะจงราคาบวกลบอย่างสี #434651
โดยเราสามารถดู Divergence โดยการเทียบความต่างระหว่างราคาและ RSI band ได้ดังนี้
ในแนวโน้มขาลง : ให้เปรียบเทียบความต่างระหว่างราคากับ RSI band ของ Lower Low ปัจจุบันกับ Low ก่อนหน้า โดยถ้าความต่างของ Low ลดลงเรื่อย ๆ จนราคาเข้าใกล้เส้น RSI band ให้พิจารณาเข้าซื้อ
ในแนวโน้มขาขึ้น : ให้เปรียบเทียบความต่างระหว่างราคากับ RSI band ของ Higher High ปัจจุบันกับ High ก่อนหน้า โดยถ้าความต่างของ High ดลงเรื่อย ๆ จนราคาเข้าใกล้เส้น RSI band ให้พิจารณาขายออก
ทั้งนี้ผมได้สร้าง Signal alert ไว้เพื่อให้ง่ายต่อการสังเกต โดยสร้างมาจากเงื่อนไขดังนี้ (ห้ามทำการซื้อขายตาม Signal alert เด็ดขาด เพราะเค้าแค่บอกจุดตามเงื่อนไขที่ตั้งไว้ บางทีอาจมีสัญญาณซื้อแล้วให้ซื้อต่อโดยไม่มีสัญญาณขายเลยก็ได้)
Buy : เมื่อ RSI14 ตัดขึ้นที่ค่า 50 พร้อมกับ RSI14 ตัดขึ้น Signal ที่ผมตั้งไว้ (ผมใช้ EMA7 ของ RSI14)
Prepare to Sell : เมื่อ RSI14 ตัดลง Signal ในขณะที่ RSI14 นั้น มีค่ามากกว่า 70
Sell/Short Top : เมื่อ RSI14 ตัดลงที่ค่า 70 พร้อมกับ RSI14 ตัดลง Signal (จะมีขึ้นแสดงว่า Peak ในกราฟ)
Buy : เมื่อ RSI14 ตัดลงที่ค่า 50 พร้อมกับ RSI14 ตัดลง Signal
Prepare to Buy : เมื่อ RSI14 ตัดขึ้น Signal ในขณะที่ RSI14 นั้น มีค่าน้อยกว่า 30
TP Short/Buy Bottom : เมื่อ RSI14 ตัดขึ้นที่ค่า 30 พร้อมกับ RSI14 ตัดขึ้น Signal (จะมีขึ้นแสดงว่า Deep ในกราฟ)
# สาเหตุที่ใส่ข้อความใน Signal alert เพียงแค่ตอน Sell/Short Top และ TP Short/Buy Bottom เพื่อลดโอกาสเกิดการแพนิคที่เกิดจากการสังเกตได้ โดยในสัญญาณตัวอื่นจะมีแค่เครื่องหมาย * เพียงอย่างเดียว
ขอให้โชคดีครับ
Firstssk
////////////////////////////////////////////////////////////////////////////////////////////////////////////////////////////////////////////////////////////////////////////////////
//en (Google Translate)
Hello, Trader
First of all, I have to say that this indicator is built on the basis of a real RSI, just using the EMA27 value to create it, since I still can't write an RSI band that is tied to the price in this section.
But please be patient and listen to me a bit. Since I previously noticed that EMA27 is exactly equal to RSI14 at 50, so I chose to build it with EMA27 because it's easier to write.
Here's how to use it:
This indicator works like RSI14. The reading method is to count the EMA27 line as the 50 value of RSI14, so let's consider the following trading. (After this I will call the created EMA27 RSI band)
Consider buying : When the price breaks the RSI band up and makes a Higher low above the RSI band.
Consider selling : When the price breaks the RSI band down and rebounds to make a Lower high below the RSI band.
# However, I have colored the candlesticks to make them easier to spot. By applying it may remove the color of the candlestick border. Then for the wick part, use a color that does not specify the price plus and minus color #434651
We can see the divergence by comparing the difference between the price and the RSI band as follows.
In a downtrend : Compare the difference between the price and the RSI band of the current Lower Low and the previous Low. If the divergence of the Low continues to decrease until the price approaches the RSI band, consider buying.
In an uptrend : Compare the price difference between the RSI band of the current Higher High and the previous high. If the divergence of the High continues to decrease until the price approaches the RSI band, consider selling.
I have created a Signal alert for easy observation. It was created from the following conditions: (Do not trade according to Signal alert strictly because they just tell the point according to the conditions set There may be a buy signal and then buy again without a sell signal.)
Buy : When RSI14 crosses above 50 with RSI14 crosses up the signal I set (I use EMA7 of RSI14).
Prepare to Sell : When RSI14 crosses signal while RSI14 is greater than 70.
Sell/Short Top : When RSI14 crosses down at 70 with RSI14 crosses down Signal (it will show "Peak" on the chart)
Buy : When RSI14 crosses down to 50 with RSI14 crosses down signal.
Prepare to Buy : When RSI14 crosses signal while RSI14 is less than 30.
TP Short/Buy Bottom : When RSI14 crosses above 30 with RSI14 crosses up signal (it will show "Deep" in the chart).
# The reason why I put the message in Signal alert only at Sell/Short Top and TP Short/Buy Bottom to reduce the chance of panic occurring from observation. In other signals, there will only be a * sign.
Good luck.
Firstssk
