Liquidity Zone IndicatorLiquidity Zone Indicator
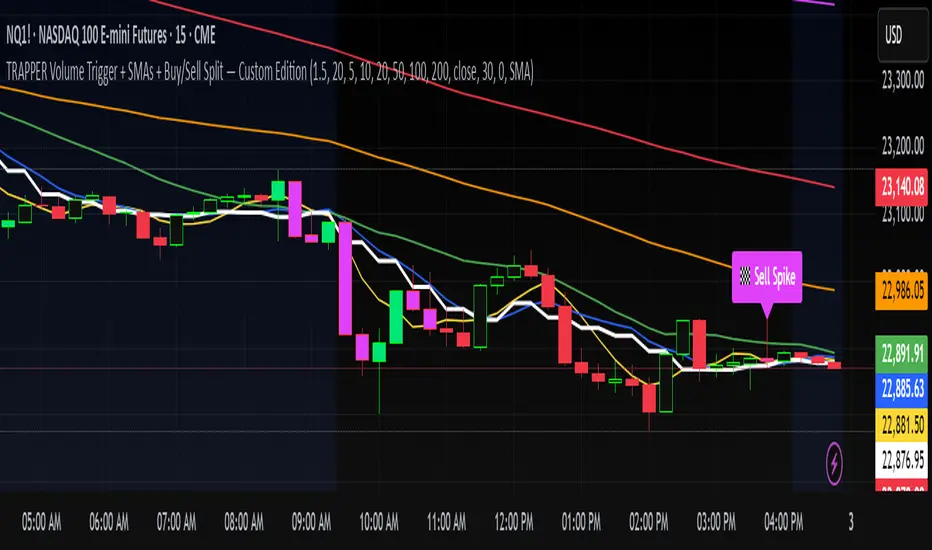
This PineScript indicator for TradingView identifies liquidity zones in the market where significant trading activity occurs, based on volume spikes and price levels. It highlights areas where large orders may be filled, useful for day traders and scalpers.
Features:
Detects bullish and bearish liquidity zones using a lookback period (default: 50 bars) and volume threshold (default: 1.5x average volume).
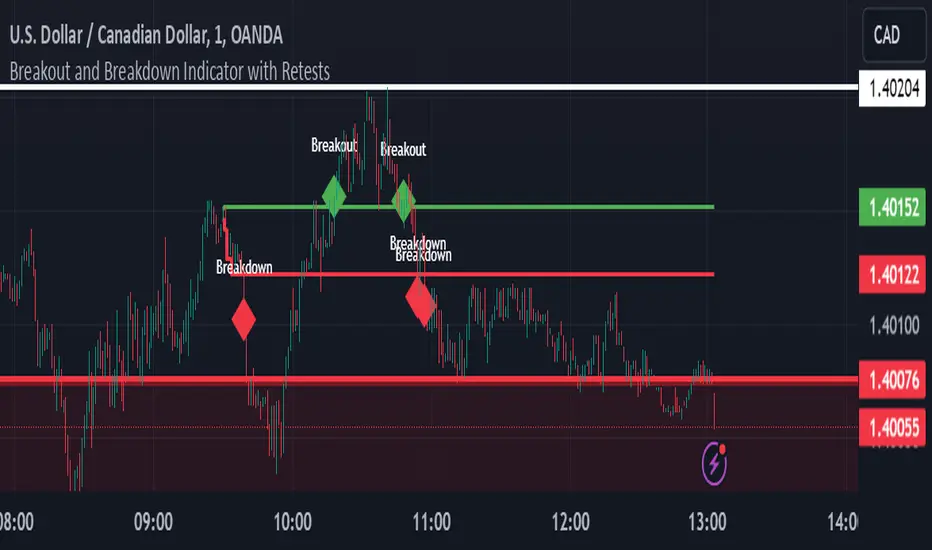
Displays zones as shaded boxes or diamond markers above/below bars, customizable by color.
Option to extend zones until price breaks through, with dynamic transparency for better visualization.
Includes an alert for when a liquidity zone is hit.
Settings:
Liquidity Lookback: Number of bars to analyze for high/low price levels.
Volume Threshold: Multiplier for detecting volume spikes.
Display as Zone: Toggle between zone boxes or markers.
Extend Zone: Keep zones active until price crosses them.
Zone Color: Customize the color of zones or markers.
Ideal for traders looking to spot potential reversal or breakout areas driven by liquidity.
Pine Script® indicator