Search in scripts for "scalping"

ORB Fusion Adaptive🎯 ORB Fusion Adaptive Strategy
Professional Opening Range Breakout Trading System
═══════════════════════════════════════════════════════════════════════════════
The first fully-automated, multi-instrument ORB strategy on TradingView.
💡 WHAT IT DOES:
Automatically trades Opening Range breakouts and failed breakout reversals with intelligent position sizing, professional risk management, and complete trade lifecycle tracking. Built for serious backtesting and live trading.
⚡ KEY FEATURES:
✓ Automated Entry & Exit (breakouts + reversals)
✓ Adaptive Position Sizing (3 modes: Fixed, Risk-Based, Risk-Based Initial)
✓ Multi-Instrument Support (Futures, Forex, Crypto, Stocks)
✓ Advanced Risk Management (daily limits, drawdown protection)
✓ ML-Powered Breakout Filtering (pContinue/pFail scoring)
✓ Failed Breakout Detection (high-probability reversals)
✓ Native Trailing Stops (Pine Script v5)
✓ Multi-Target Management (T1, T2, T3)
✓ Real-Time Performance Dashboard
✓ Comprehensive Backtesting (5+ years tested)
🎯 STRATEGY LOGIC:
Entry Signals
The strategy enters trades on two high-probability setups:
1. ORB Breakouts
• Detects when price breaks above/below Opening Range
• Confirms with volume (configurable threshold)
• ML filter scores probability of continuation
• Enters within 3 bars of breakout (no late entries)
• Stop placed at ORB midpoint or ATR-based
• Targets at Fibonacci extensions (1.0x, 1.618x, 2.5x ORB range)
2. Failed Breakout Reversals
• Monitors for breakouts that fail and reverse
• Confirms failure after price returns inside ORB
• Automatic reversal entry with tight stops
• Three profit targets (0.5x, 1.0x, 1.5x ORB range)
• Historical 65-75% win rate on reversals
Exit Management
• Stop Loss: Multiple methods (ATR, ORB Mid, ORB Opposite, Hybrid)
• Native Trailing Stop: Activates after configurable R-multiple profit
• Profit Targets: Single target or scaled exits at T1/T2/T3
• Daily Stop: Halts trading after max daily loss
• Drawdown Protection: Circuit breaker at max drawdown threshold
🔧 ADAPTIVE POSITION SIZING:
The strategy's most powerful feature - intelligent position sizing that adapts to your instrument and account:
Mode 1: Fixed
• Simple contract/lot size
• Best for: Testing, stable position sizing
• Use case: "Always trade 2 contracts"
Mode 2: Risk-Based (Current Equity)
• Size = (Current Equity × Risk%) / (Stop Distance × Point Value)
• Compounds with wins, reduces with losses
• Best for: Aggressive compounding
• Use case: Maximize geometric growth
Mode 3: Risk-Based (Initial Capital)
• Size = (Initial Capital × Risk%) / (Stop Distance × Point Value)
• No compounding - consistent risk exposure
• Best for: Professional risk management
• Use case: Live trading with stable risk
Multi-Instrument Intelligence
Auto-detects and calculates correctly for:
• Futures: Uses contract point value (ES $50/pt, NQ $20/pt, MES $5/pt, MNQ $2/pt)
• Forex: Uses pip value per lot (Standard/Mini/Micro/Nano)
• Crypto: Uses contract multiplier (1.0 BTC, 0.001 BTC, etc)
• Stocks: Uses $1 per share
Manual override available if auto-detect fails.
📊 RISK MANAGEMENT:
Multi-Layer Protection
• Per-Trade Risk: 0.5-2% of capital (configurable)
• Daily Risk Limit: Max 4% loss per day (halts trading)
• Max Drawdown Pause: Circuit breaker at 12% drawdown
• Position Size Limits: Min/max contracts enforced
• Max Stop Distance: ATR-based hard limit (prevents catastrophic losses)
Trailing Stop System
• Uses Pine Script's native trail_price and trail_offset
• Activates after configurable R-multiple profit (default 0.5R)
• Trail distance: ATR-based (tight 0.5 ATR to loose 2.0 ATR)
• Works reliably in backtesting AND live trading
• No manual stop management needed
🌍 GLOBAL MARKET SUPPORT:
Configurable Sessions
Unlike basic ORB indicators, this strategy works globally:
• US Equities: 9:30 AM ET default
• Forex London: Custom session 08:00-08:30 GMT
• Forex NY: Custom session 13:30-14:00 GMT
• Asian Markets: Custom session with Tokyo timezone
• Crypto: 24/7 support with custom ORB windows
Timezone support includes:
America/New_York, Europe/London, Asia/Tokyo, Asia/Hong_Kong, UTC, and more.
Session ORBs
• Asian Session ORB (Tokyo open)
• London Session ORB (Forex primary)
• NY Session ORB (US market hours)
Critical for Forex traders working multiple sessions.
📈 BACKTESTING CAPABILITIES:
Realistic Simulation
• Commission: Configurable (default $1 per order)
• Slippage: 2 ticks default (adjustable)
• Volume Confirmation: Prevents unrealistic fills
• RTH Filtering: Optional Regular Trading Hours only
• Bar Magnifier: Improved intrabar execution
Performance Metrics Dashboard
Real-time statistics displayed:
• Total Trades & Win Rate
• Net P&L & Profit Factor
• Current Drawdown
• Daily P&L tracking
• Position details (if in trade)
• Position sizing mode & current size
Historical Testing
• Supports 5000+ bars of history
• Test across multiple market conditions
• Bull markets, bear markets, range-bound periods
• Optimize by day type (trend vs rotation)
🎛️ CUSTOMIZATION OPTIONS:
ORB Settings
• Timeframe: 5, 15, 30, or 60 minutes
• Confirmation: Close, Wick, or Body
• Volume: On/off with multiplier threshold
• LTF Precision: Sub-minute high/low detection
• RTH Filter: Regular Trading Hours only option
Breakout Detection
• ML Filtering: Enable/disable with thresholds
• Failed Breakout: Sensitivity (2-10 bars)
• Failure Buffer: ATR-based confirmation
• Entry Window: Bars after signal (prevents late entries)
Stop Methods
• ATR: Tight dynamic stops (recommended)
• ORB Mid: Structural stop at midpoint
• ORB Opposite: Wide stop at opposite boundary
• Hybrid: Best of ATR and structural
Target Methods
• Single: One target, full exit
• Scaled: Partial exits at T1/T2/T3 (recommended)
• Trail Only: No fixed targets, trail to exit
🔬 OPTIMIZATION GUIDE:
For Futures (ES, NQ, MNQ, MES)
• ORB: 30 min
• Confirmation: Close
• Volume: ON (1.5x)
• Stop Method: ATR (1.0x multiplier)
• Position Mode: Risk-Based (Initial)
• Risk Per Trade: 1.5%
• Failed Breakouts: ENABLE
For Forex Majors
• ORB: 60 min (or 15 min at London open)
• Confirmation: Close
• Volume: OFF (tick volume unreliable)
• Stop Method: ATR (1.5x multiplier)
• Position Mode: Risk-Based (Initial)
• Risk Per Trade: 1.0%
• Custom Session: 0800-0900 GMT
• Timezone: Europe/London
For Crypto (BTC, ETH)
• ORB: 60 min
• Confirmation: Close
• Volume: OFF or ON (1.2x)
• Stop Method: ATR (2.0x wider stops)
• Position Mode: Fixed or Risk-Based
• Risk Per Trade: 2.0% (higher volatility)
• Custom Session: Define your preferred window
For Stocks/ETF
• ORB: 15-30 min
• Confirmation: Body (most conservative)
• Volume: ON (2.0x threshold)
• Stop Method: Hybrid
• Position Mode: Risk-Based (Initial)
• Risk Per Trade: 1.0%
• RTH Only: ENABLED
• Gap Analysis: ENABLED
💎 ADVANCED FEATURES:
Initial Balance Analysis
• First hour range tracking (A + B periods)
• IB extensions at 0.5x, 1.0x, 1.5x, 2.0x
• Day type classification (Trend/Normal/Rotation)
• Adjusts strategy behavior by day type
ORB Extensions
• Fibonacci targets: 1.272x, 1.5x, 1.618x, 2.0x, 2.618x, 3.0x
• Dynamic monitoring for take-profit zones
• Extension tracking in statistics
VWAP Integration
• Institutional benchmark reference
• Standard deviation bands (1σ and 2σ)
• Breakout alignment scoring
• Context for trade quality
Gap Analysis
• Overnight gap detection
• Gap fill target projection
• Gap fill rate statistics
• Direction bias from gap type
Comprehensive Statistics
• Bull/Bear breakout win rates
• Reversal win rate (typically 65-75%)
• Day type distribution
• Extension statistics
• Gap fill rate
• Real-time performance tracking
🎨 VISUAL FEEDBACK:
Enhanced Plots
• ORB levels (High/Low/Mid continuous lines)
• Entry markers (L for long, S for short, 🔥 for reversals)
• Extension levels with labels
• Session ORBs (Asian/London/NY)
• IB levels and extensions
• VWAP with bands
• Failed breakout markers
Color-Coded Momentum Boxes
• Blue: Inside ORB (consolidation)
• Green: Above ORB (bullish momentum)
• Red: Below ORB (bearish momentum)
• Orange: Failed breakout zones
• Variable intensity based on distance
Dynamic Dashboards
• Main Dashboard: ORB status, breakout info, setup details, market context
• Strategy Dashboard: Trades, Win%, P&L, Profit Factor, Daily P&L, Drawdown, Position info
• Narrative Dashboard: Plain-language market interpretation
Three Display Modes
• Simple: Clean chart, essential ORB only
• Standard: ORB + IB + Sessions + VWAP (recommended)
• Advanced: All features + statistics
🔔 ALERT SYSTEM:
Strategy Alerts
• Breakout Entry (with ML probabilities)
• Failed Breakout Entry (with targets)
• Stop Hit (position closed)
• Target Hit (T1, T2, T3 partials)
• Extension Reached (profit zone)
• IB Break (potential trend day)
All alerts include:
• Direction and setup type
• Entry price and position size
• Stop and target levels
• ML scores (if enabled)
• Setup grade (A+ to D)
• Win rate context
⏱️ TIMEFRAMES: 1m-15m optimal (works on all)
💎 INSTRUMENTS: Futures, Forex, Crypto, Stocks, Indices
🎓 SKILL LEVEL: Intermediate to Advanced
📚 WHAT'S INCLUDED:
Comprehensive Documentation
• 200+ lines of detailed tooltips
• Every setting fully explained
• Optimization guides by market
• Position sizing calculator explanations
• Risk management framework
• Best practices and common pitfalls
Ready-to-Use Configurations
• Default settings optimized for ES/NQ
• Recommended settings for each instrument type
• Conservative vs Aggressive profiles
• Scalping vs Swing configurations
Full Transparency
• All calculations shown in dashboard
• Position sizing visible in real-time
• Strategy performance metrics live
• No black boxes or hidden logic
🚨 RISK DISCLAIMERS:
CRITICAL INFORMATION - PLEASE READ:
• This is a trading strategy that executes real trades in backtesting
• Past performance does NOT guarantee future results
• All trading involves substantial risk of loss
• Never risk money you cannot afford to lose
• This is NOT financial advice - for educational purposes only
• Requires understanding of ORB methodology and risk management
• Test thoroughly on paper/demo account before live trading
• Position sizing must be configured correctly for your account
• Stop losses are NOT guaranteed in all market conditions
• Slippage and commissions will affect live results
• Volatile markets may trigger circuit breakers (drawdown pause)
Strategy-Specific Risks:
• Opening range breakouts can fail (hence the reversal system)
• Volume confirmation may limit signals in low-volume instruments
• Custom sessions must match your market's actual hours
• Multi-instrument support requires correct point value configuration
• Trailing stops may exit early in volatile conditions
• Daily limits may prevent recovery trades
• Backtesting results may not match live execution
Position Sizing Warnings:
• Risk-Based modes can size large positions if stops are tight
• Always set max position size limits appropriate for your account
• Verify point values are correct for your instrument
• Test with small size first
• Monitor position size in dashboard before every trade
🎓 WHO THIS IS FOR:
Best Suited For:
• Traders with ORB methodology knowledge
• Those seeking a fully-automated system
• Backtesting enthusiasts
• Multi-instrument traders
• Risk-conscious systematic traders
• Traders who understand position sizing
Not Recommended For:
• Complete beginners to trading
• Those seeking "set and forget" with zero monitoring
• Traders unwilling to backtest first
• Those who don't understand risk management
• Accounts under $5,000 (position sizing too small)
💡 PRO TIPS:
Backtesting Best Practices
• Start with 2+ years of data
• Include both bull and bear markets
• Test on same timeframe you'll trade (5-min for 5-min ORB)
• Account for commissions/slippage realistically
• Verify win rate >45% and profit factor >1.3
Position Sizing
• Use Risk-Based (Initial Capital) for most consistent results
• Start with 1% risk per trade, increase to 1.5-2% if comfortable
• Set max position size to prevent oversizing
• Verify point values are correct before live trading
• Monitor dashboard for actual size before each trade
Risk Management
• NEVER disable daily loss limit
• Keep max drawdown pause at 12% or lower
• Use ATR stop method for best R:R
• Enable trailing stops for trend capturing
• Take partial profits at T1 (at least 30-40%)
Failed Breakout Trading
• These are your highest win-rate setups (65-75%)
• Always enable this feature
• Use tighter stops on reversals than breakouts
• Don't chase if you miss the entry window
• Three targets allow you to scale out profitably
ML Filtering
• Dramatically improves breakout quality
• Reduce signals but increase win rate
• Start with default thresholds (pCont≥0.55, pFail≤0.35)
• Lower signals = higher quality in choppy markets
• Can disable for more signals in strong trends
⚙️ TECHNICAL DETAILS:
Strategy Engine
• Pine Script v5
• Native strategy.entry() and strategy.exit()
• Trailing stops use trail_price/trail_offset (no repainting)
• Proper position sizing with strategy.position_size
• Realistic fills with commission and slippage
• Bar magnifier for improved intrabar execution
Performance
• Optimized for 1-minute to 15-minute charts
• Supports 5000+ bars of history
• Efficient calculations (no arrays in hot loops)
• Max 500 visual objects (boxes/lines/labels)
• No repainting - all signals confirmed on bar close
Position Sizing Engine
• Auto-detects Futures, Forex, Crypto, Stocks
• Uses syminfo.pointvalue when available
• Falls back to manual configuration
• Proper rounding to exchange increments
• Min/max limits enforced
Risk System
• Per-trade risk percentage enforced
• Daily P&L tracking
• Drawdown from peak equity
• Circuit breakers halt trading when limits hit
• Resets daily for fresh start
🔄 VERSION HISTORY:
Current Version: 1.0 (Initial Release)
• Complete ORB breakout + reversal strategy
• Adaptive position sizing (3 modes)
• Multi-instrument support
• Advanced risk management
• Native trailing stops
• ML filtering integration
• Comprehensive backtesting
• Real-time performance dashboard
Planned Updates:
• Additional session templates (Tokyo, Sydney)
• More stop methods
• Enhanced ML model training
• Volatility regime detection
• Trade journal export
═══════════════════════════════════════════════════════════════════════════════
Trade the opening range with institutional precision.
Automated entries. Intelligent sizing. Professional risk management.
Test first. Trade smart. Scale safely.
Taking you to school. — Dskyz, Trade with insight. Trade with anticipation.

Trend Pulse Channel StrategyOverview
Trend Pulse Channel Strategy is a long-only trend-following breakout strategy built around an adaptive multi-pole smoothing filter and a volatility-adjusted price channel.
The strategy is designed to participate in sustained directional moves by entering only when price confirms momentum strength beyond a dynamic upper boundary, while avoiding mean-reversion and low-quality consolidation phases.
This script is published as a strategy and includes realistic backtesting assumptions for position sizing, commissions, and slippage.
Core Concept
At the heart of the strategy is a multi-pole adaptive EMA-based filter, inspired by advanced digital signal smoothing techniques.
Using multiple poles allows the filter to reduce noise while preserving responsiveness to genuine trend changes.
To adapt the channel width to changing market conditions, the strategy applies the same filtering logic to True Range, producing a volatility-aware envelope rather than a static or fixed-percentage band.
This combination allows the strategy to:
Track directional bias using a smoothed central filter
Adjust channel width dynamically based on market volatility
Trigger entries only when price expansion confirms trend strength
Entry Logic
A long position is opened when:
Price crosses above the upper channel band
The signal occurs within the user-defined date range
This condition represents a volatility-confirmed breakout aligned with the prevailing directional filter.
Exit Logic
The long position is closed when:
Price crosses back below the upper band
This exit logic aims to stay in trending moves while exiting when upside momentum weakens.
The strategy does not open short positions by design.
Inputs and Defaults
The default inputs are selected to balance smoothness, responsiveness, and stability:
Source (HLC3): Reduces single-price noise by averaging high, low, and close
Period (144): Defines the primary smoothing horizon of the adaptive filter
Poles (4): Controls the smoothness vs. responsiveness trade-off
Range Multiplier (1.414): Scales the volatility envelope using filtered True Range
Reduced Lag (optional): Applies lag compensation to improve responsiveness
Fast Response (optional): Blends multi-pole and single-pole filters for quicker reaction at the cost of smoothness
All inputs are fully configurable and can be adjusted to suit different instruments and timeframes.
Risk Management & Position Sizing
The strategy uses:
Position size: 10% of equity per trade
No pyramiding
Long positions only
This sizing approach is intended to reflect sustainable risk exposure rather than aggressive capital deployment. Users may further adjust position size based on their own risk tolerance.
Backtesting Assumptions
The strategy is tested using :
Initial capital: 10,000
Commission: 0.1%
Slippage: 1 tick
Order fill model: Standard OHLC
These settings are chosen to provide more realistic performance estimates compared to idealized backtests.
This strategy is best suited for :
Trend-oriented markets
Higher timeframes where breakouts are more reliable
Users seeking systematic trend participation rather than frequent scalping
In sideways or range-bound market conditions, price may cross the channel boundaries frequently.
This can result in a higher number of entry and exit signals that do not develop into sustained trends.
For this reason, the strategy should be used with an understanding of basic technical analysis concepts, including market structure, trend identification, and consolidation behavior.
It is intended as a decision-support tool, not a standalone trading system.
Users—whether beginners or experienced traders—should avoid relying solely on this strategy and are encouraged to combine it with broader market context and additional analysis methods.
Disclaimer
This script is provided for educational and analytical purposes only. It does not constitute financial advice. Past performance does not guarantee future results.

Liquidity Sweep pro📌 Liquidity Sweep Pro – Strategy Description
Liquidity Sweep Pro is a price–action based trading strategy designed to identify liquidity grabs and smart money reversals around key swing highs and lows.
This strategy focuses on moments where price takes out resting liquidity above recent highs or below recent lows, then shows clear rejection and directional intent, which often precedes strong reversals or continuations.
🔍 Core Logic
The strategy is built on three main concepts:
1️⃣ Liquidity Sweep Detection
Identifies recent swing highs and swing lows using pivot structure
Detects when price sweeps above a high or below a low, signaling liquidity collection
2️⃣ CISD Confirmation (Change in State of Delivery)
After a liquidity sweep, the strategy waits for:
Bearish confirmation after sweeping highs
Bullish confirmation after sweeping lows
This confirmation is based on candle behavior and price closing back inside the structure, filtering out false breakouts.
3️⃣ Optional Trend Filter (Hull MA)
An optional Hull Moving Average filter can be enabled to trade:
Longs in bullish conditions
Shorts in bearish conditions
This helps reduce counter-trend trades while keeping the strategy flexible.
🎯 Risk Management
Stop Loss and Take Profit are calculated dynamically using ATR
Fully customizable Risk : Reward ratio
Designed to adapt to different market conditions and volatility levels
⚙️ Recommended Usage
Best suited for intraday and scalping trading
Works well on:
XAUUSD (Gold) – M3 / M5
Crypto – M5 / M15
Indices – M5
The strategy does not repaint and only generates signals after candle close.
⚠️ Disclaimer
This strategy is for educational and research purposes only.
Always test and optimize parameters for your specific market and timeframe before using it in live trading.

UK Public Oneside V2This strategy combines RSI, Stochastic Oscillator, and a 50 EMA trend filter to identify moderate-risk trading opportunities in trending markets.
How it works:
Long entries occur when RSI and Stochastic are in oversold conditions while price is above the 50 EMA.
Short entries occur when RSI and Stochastic are in overbought conditions while price is below the 50 EMA.
Trades are confirmed on the previous candle, avoiding premature entries and exits.
Risk management is handled using fixed percentage stop-loss with configurable risk-to-reward targets.
Optional RSI-based exits close positions early during overbought or oversold conditions.
Key Features:
Trend-filtered entries using EMA 50
Non-repainting logic (confirmed candle signals)
Configurable stop-loss and reward ratio
Works well for scalping and intraday trading
Suitable for crypto, forex, and indices
Recommended Timeframes:
5m, 15m, 30m
Note:
This strategy is designed for educational and research purposes. Always forward-test and apply proper risk management before using in live trading.

UK Public OnesideRSI + Stochastic V1 (Moderate) Strategy
This strategy combines RSI, Stochastic Oscillator, and a 50 EMA trend filter to identify moderate-risk trading opportunities in trending markets.
How it works:
Long entries occur when RSI and Stochastic are in oversold conditions while price is above the 50 EMA.
Short entries occur when RSI and Stochastic are in overbought conditions while price is below the 50 EMA.
Trades are confirmed on the previous candle, avoiding premature entries and exits.
Risk management is handled using fixed percentage stop-loss with configurable risk-to-reward targets.
Optional RSI-based exits close positions early during overbought or oversold conditions.
Key Features:
Trend-filtered entries using EMA 50
Non-repainting logic (confirmed candle signals)
Configurable stop-loss and reward ratio
Works well for scalping and intraday trading
Suitable for crypto, forex, and indices
Recommended Timeframes:
5m, 15m, 30m
Note:
This strategy is designed for educational and research purposes. Always forward-test and apply proper risk management before using in live trading.

TDZZ ETH 15min Vault: No-Loss Martin Gale StrategyStrategy Overview
The ETH 15min Vault is an enhanced, high-frequency Martin Gale strategy designed specifically for Ethereum on the 15-minute chart. Its core innovation lies in integrating pre-calculated margin management with a multi-layer exit system, transforming the traditional high-risk Martingale approach into a controlled, calculated growth engine. The strategy aims for sustainable compound growth of small capitals (e.g., 1000U) in ranging markets while systematically eliminating the risk of account blow-up.
Core Concept: The "No-Loss" Guarantee
Unlike conventional Martingale systems that risk infinite losses, this strategy pre-calculates and logically reserves the total margin required for all potential layers (configurable, e.g., up to 30) at the initial entry. This ensures sufficient capital is always available for the next averaging order, preventing liquidation due to margin shortage. Combined with intelligent, proactive take-profit and safety-net closures, it creates a theoretically "No-Loss" framework for the Martin Gale method.
Key Mechanisms
1、Smart Position Averaging:
Averaging distances expand geometrically (configurable multiplier), preventing rapid layer depletion during sharp drops.
Averaging order size increases progressively (configurable multiplier) to effectively lower the break-even point.
2、Dynamic Multi-Stage Exit Logic:
Rebound TP: Partially closes a position when price rebounds a certain percentage from its entry, locking in profits early during oscillations.
Cycle TP: Closes the remaining position upon reaching the primary profit target, which is dynamically recalculated after each average to reflect the new aggregate cost.
Safety-Net Close (Defense Mode): Activates after a defined number of averages. Triggers a full exit if price: a) rallies significantly from the lowest point, b) retraces from a recent high, or c) fails to make a new low within a set time. This forms the final protective layer for capital preservation.
Main Advantages
✅ True Risk Isolation: Transforms Martingale's "unlimited risk" into a "defined and manageable drawdown" via pre-calculated margins and safety-net exits.
✅ Active Profit Capture: The "Rebound TP" mechanism increases win rate and capital efficiency in ranging markets.
✅ Adaptive to Volatility: Adjustable parameters for averaging distance and size allow tuning for different market conditions.
✅ High-Frequency Compounding Potential: Operates on the 15-min timeframe, offering numerous opportunities to complete profit cycles in consolidating phases.
Configuration & Parameters
Key adjustable inputs include: Initial Capital %, Averaging Distance % and Multiplier, Order Size Multiplier, Max Layers, Take-Profit %, Rebound Close %, and all Defense Mode thresholds.
This strategy significantly reduces liquidation risk through its design but does not eliminate trading risk. Substantial drawdowns can occur during strong, sustained trends. "No-Loss" refers to prevention of margin-call liquidation, not guaranteed profitability. Always conduct thorough backtesting and forward testing in a simulated environment before committing real capital. Past performance is not indicative of future results. Trade responsibly.

Session Volume Profile Sniffer: HVN & Rejection ZonesA simple tool built for traders who rely on intraday volume structure.
What this script does
This script tracks volume distribution inside a selected session and highlights two key price levels:
High Volume Nodes (HVNs) — areas where price spent time building heavy participation.
Low Volume Nodes (LVNs) — thin zones where price moved quickly with very little interest.
Instead of plotting a full profile, this tool gives you the exact rejection-level lines you usually hunt manually.
Why these levels matter
HVN → price tends to react, stall, or flip direction
LVN → price often rejects strongly since liquidity is thin
Rejection patterns around these areas give clean entry signals
Positioning trades around HVN/LVN helps filter noise in choppy sessions
This script removes the trouble of drawing profiles, counting bins, or guessing node levels. Everything is calculated inside the session you choose.
How the detection works
Inside your session window, the script:
1. Tracks each tick-based price bucket
2. Accumulates raw volume for every bucket
Identifies:
HVNs = buckets with volume above a tier
LVNs = buckets with volume below a tier
3. Prints each level as a single clean line
4. Generates:
Long signal → bounce from LVN
Short signal → rejection from HVN
Built-in exits use ATR-based conditions for quick testing.
Features
Session-based volume mapping
HVN + LVN levels drawn automatically
Entry triggers based on rejection
ATR exits for experimental backtests
Clean, minimal visual output
Best use cases
Intraday futures
Index scalping
FX sessions (London / NY)
Crypto sessions (user-timed)
Anyone who trades around volume structure
Adjustable settings
Session window
Volume bin size
HVN multiplier
LVN multiplier
Enable/disable zone lines
This keeps it flexible enough for both scalpers and slow-paced intraday setups.
Important note
This script is built for study + idea testing.
It is not intended as a final system.
Once you identify how price behaves around these nodes, you can blend this tool into your own setup.

PMax - Asymmetric MultipliersDescription: This script is an enhanced version of the popular PMax (Profit Maximizer) indicator, originally developed by KivancOzbilgic. It has been converted into a full strategy with advanced customization options for backtesting and trend following.
Key Features & Modifications:
Asymmetric ATR Multipliers: Unlike the standard version, this script allows you to set different ATR multipliers for Upper (Short/Resistance) and Lower (Long/Support) bands.
Default Upper: 1.5 (Tighter trailing for Short positions)
Default Lower: 3.0 (Wider trailing for Long positions to avoid whipsaws)
Expanded MA Types: Added HULL (HMA) and VAR (Variable Index Dynamic Average) options.
VAR is highly recommended for filtering out noise in ranging markets.
HULL is ideal for scalping and faster reactions.
Built-in Risk Management: A fixed 5% Stop Loss mechanism is integrated into the strategy. It protects your capital by closing positions if the price moves 5% against you, even if the trend hasn't reversed yet.
Visibility Fix: Solved the issue where the PMax line would disappear or start at zero in the initial bars.
How to Use:
Use the VAR MA type for trend following in volatile markets.
Adjust the "Stop Loss Percent" input to fit your risk appetite.
The strategy employs an "Always In" logic (Long/Short) but respects the hard Stop Loss.
Credits: Original PMax logic by KivancOzbilgic.

Trend Following $BTC - Multi-Timeframe Structure + ReversTREND FOLLOWING STRATEGY - MULTI-TIMEFRAME STRUCTURE BREAKOUT SYSTEM
Strategy Overview
This is an enhanced Turtle Trading system designed for cryptocurrency spot trading. It combines Donchian Channel breakouts with multi-timeframe structure filtering and ATR-based dynamic risk management. The strategy trades both long and short positions using reverse signal exits to maximize trend capture.
Core Features
Multi-Timeframe Structure Filtering
The strategy uses Swing High/Low analysis to identify market structure trends. You can customize the structure timeframe (default: 3 minutes) to match your trading style. Only enters trades aligned with the identified trend direction, avoiding counter-trend positions that often lead to losses.
Reverse Signal Exit System
Instead of using fixed stop-losses or time-based exits, this strategy exits positions only when a reverse entry signal triggers. This approach maximizes trend profits and reduces premature exits during normal market retracements.
ATR Dynamic Pyramiding
Automatically adds positions when price moves 0.5 ATR in your favor. Supports up to 2 units maximum (adjustable). This pyramid scaling enhances profitability during strong trends while maintaining disciplined risk management.
Complete Risk Management
Fixed position sizing at 5000 USD per unit. Includes realistic commission fees of 0.06% (Binance spot rate). Initial capital set at 10,000 USD. All backtest parameters reflect real-world trading conditions.
Trading Logic
Entry Conditions
Long Entry: Close price breaks above the 20-period high AND structure trend is bullish (price breaks above Swing High)
Short Entry: Close price breaks below the 20-period low AND structure trend is bearish (price breaks below Swing Low)
Position Scaling
Long positions: Add when price rises 0.5 ATR or more
Short positions: Add when price falls 0.5 ATR or more
Maximum 2 units including initial entry
Exit Conditions
Long Exit: Triggers when short entry signal appears (price breaks 20-period low + structure turns bearish)
Short Exit: Triggers when long entry signal appears (price breaks 20-period high + structure turns bullish)
Default Parameters
Channel Settings
Entry Channel Period: 20 (Donchian Channel breakout period)
Exit Channel Period: 10 (reserved parameter)
ATR Settings
ATR Period: 20
Stop Loss ATR Multiplier: 2.0
Add Position ATR Multiplier: 0.5
Structure Filter
Swing Length: 300 (Swing High/Low calculation period)
Structure Timeframe: 3 minutes
Adjust these based on your trading timeframe and asset volatility
Position Management
Maximum Units: 2 (including initial entry)
Capital Per Unit: 5000 USD
Visualization Features
Background Colors
Light Green: Bullish market structure
Light Red: Bearish market structure
Dark Green: Long position entry
Dark Red: Short position entry
Optional Display Elements (Default: OFF)
Entry and exit channel lines
Structure high/low reference lines
ATR stop-loss indicator
Next position add level
Entry/exit labels
Alert Message Format
The strategy sends notifications with the following format:
Entry: "5m Long EP:90450.50"
Add Position: "15m Add Long 2/2 EP:91000.25"
Exit: "5m Close Long Reverse Signal"
Where the first part shows your current chart timeframe and EP indicates Entry Price
Backtest Settings
Capital Allocation
Initial Capital: 10,000 USD
Per Entry: 5,000 USD (split into 2 potential entries)
Leverage: 0x (spot trading only)
Trading Costs
Commission: 0.06% (Binance spot VIP0 rate)
Slippage: 0 (adjust based on your experience)
Best Use Cases
Ideal Scenarios
Trending markets with clear directional movement
Moderate to high volatility assets
Timeframes from 1-minute to 4-hour charts
Best suited for major cryptocurrencies with good liquidity
Not Recommended For
Highly volatile choppy/ranging markets
Low liquidity small-cap coins
Extreme market conditions or black swan events
Usage Recommendations
Timeframe Guidelines
1-5 minute charts: Use for scalping, consider Swing Length 100-160
15-30 minute charts: Good for short-term trading, Swing Length 50-100
1-4 hour charts: Suitable for swing trading, Swing Length 20-50
Optimization Tips
Always backtest on historical data before live trading
Adjust swing length based on asset volatility and your timeframe
Different cryptocurrencies may require different parameter settings
Enable visualization options initially to understand entry/exit points
Monitor win rate and drawdown during backtesting
Technical Details
Built on Pine Script v6
No repainting - uses proper bar referencing with offset
Prevents lookahead bias with lookahead=off parameter
Strategy mode with accurate commission and slippage modeling
Multi-timeframe security function for structure analysis
Proper position state tracking to avoid duplicate signals
Risk Disclaimer
This strategy is provided for educational and research purposes only. Past performance does not guarantee future results. Backtesting results may differ from live trading due to slippage, execution delays, and changing market conditions. The strategy performs best in trending markets and may experience drawdowns during ranging conditions. Always practice proper risk management and never risk more than you can afford to lose. It is recommended to paper trade first and start with small position sizes when going live.
How to Use
Add the strategy to your TradingView chart
Select your desired timeframe (1m to 4h recommended)
Adjust parameters based on your risk tolerance and trading style
Review backtest results in the Strategy Tester tab
Set up alerts for automated notifications
Consider paper trading before risking real capital
Tags
Trend Following, Turtle Trading, Donchian Channel, Structure Breakout, ATR, Cryptocurrency, Spot Trading, Risk Management, Pyramiding, Multi-Timeframe Analysis
---
Strategy Name: Trend Following BTC
Version: v1.0
Pine Script Version: v6
Last Updated: December 2025

Trend Following $ZEC - Multi-Timeframe Structure Filter + Revers# Trend Following CRYPTOCAP:ZEC - Strategy Guide
## 📊 Strategy Overview
Trend Following CRYPTOCAP:ZEC is an enhanced Turtle Trading system designed for cryptocurrency spot trading, combining Donchian Channel breakouts, multi-timeframe structure filtering, and ATR-based dynamic risk management for both long and short positions.
---
## 🎯 Core Features
1. Multi-Timeframe Structure Filtering
- Uses Swing High/Low to identify market structure
- Customizable structure timeframe (default: 1 minute)
- Only enters trades in the direction of the trend, avoiding counter-trend positions
2. Reverse Signal Exit
- No fixed stop-loss or fixed-period exits
- Exits only when a reverse entry signal triggers
- Maximizes trend profits, reduces premature exits
3. ATR Dynamic Pyramiding
- Adds positions when price moves 0.5 ATR in favorable direction
- Supports up to 2 units maximum (adjustable)
- Pyramid scaling to enhance profitability
4. Complete Risk Management
- Fixed position size (5000 USD per unit)
- Commission fee 0.06% (Binance spot rate)
- Initial capital 10,000 USD
---
## 📈 Trading Logic
Entry Conditions
✅ Long Entry:
- Close price breaks above 20-period high
- Structure trend is bullish (price breaks above Swing High)
✅ Short Entry:
- Close price breaks below 20-period low
- Structure trend is bearish (price breaks below Swing Low)
Add Position Conditions
- Long: Price rises ≥ 0.5 ATR
- Short: Price falls ≥ 0.5 ATR
- Maximum 2 units including initial entry
Exit Conditions
- Long Exit: When short entry signal triggers (price breaks 20-period low + structure turns bearish)
- Short Exit: When long entry signal triggers (price breaks 20-period high + structure turns bullish)
---
## ⚙️ Parameter Settings
Channel Settings
- Entry Channel Period: 20 (Donchian Channel breakout period)
- Exit Channel Period: 10 (reserved parameter, actually uses reverse signal exit)
ATR Settings
- ATR Period: 20
- Stop Loss ATR Multiplier: 2.0 (reserved parameter)
- Add Position ATR Multiplier: 0.5
Structure Filter
- Swing Length: 160 (Swing High/Low calculation period)
- Structure Timeframe: 1 minute (can change to 5/15/60, etc.)
Position Management
- Maximum Units: 2 (including initial entry)
- Capital Per Unit: 5000 USD
---
## 🎨 Visualization Features
Background Colors
- Light Green: Bullish structure
- Light Red: Bearish structure
- Dark Green: Long entry
- Dark Red: Short entry
Optional Display (Default: OFF)
- Entry/exit channel lines
- Structure high/low lines
- ATR stop-loss line
- Next add position indicator
- Entry/exit labels
---
## 📱 Alert Message Format
Strategy sends notifications on entry/exit with the following format:
- Entry: `1m Long EP:428.26`
- Add Position: `15m Add Long 2/2 EP:429.50`
- Exit: `1m Close Long Reverse Signal`
Where:
- `1m`/`15m` = Current chart timeframe
- `EP` = Entry Price
---
## 💰 Backtest Settings
Capital Allocation
- Initial Capital: 10,000 USD
- Per Entry: 5,000 USD (split into 2 entries)
- Leverage: 0x (spot trading)
Trading Costs
- Commission: 0.06% (Binance spot VIP0)
- Slippage: 0
---
## 🎯 Use Cases
✅ Best Scenarios
- Trending markets
- Moderate volatility assets
- 1-minute to 4-hour timeframes
⚠️ Not Suitable For
- Highly volatile choppy markets
- Low liquidity small-cap coins
- Extreme market conditions (black swan events)
---
## 📊 Usage Recommendations
Timeframe Suggestions
| Timeframe | Trading Style | Suggested Parameter Adjustment |
|-----------|--------------|-------------------------------|
| 1-5 min | Scalping | Swing Length 100-160 |
| 15-30 min | Short-term | Swing Length 50-100 |
| 1-4 hour | Swing Trading | Swing Length 20-50 |
Optimization Tips
1. Adjust swing length based on backtest results
2. Different coins may require different parameters
3. Recommend backtesting on 1-minute chart first before live trading
4. Enable labels to observe entry/exit points
---
## ⚠️ Risk Disclaimer
1. Past Performance Does Not Guarantee Future Results
- Backtest data is for reference only
- Live trading may be affected by slippage, delays, etc.
2. Market Condition Changes
- Strategy performs better in trending markets
- May experience frequent stops in ranging markets
3. Capital Management
- Do not invest more than you can afford to lose
- Recommend setting total capital stop-loss threshold
4. Commission Impact
- Frequent trading accumulates commission fees
- Recommend using exchange discounts (BNB fee reduction, etc.)
---
## 🔧 Troubleshooting
Q: No entry signals?
A: Check if structure filter is too strict, adjust swing length or timeframe
Q: Too many labels displayed?
A: Turn off "Show Labels" option in settings
Q: Poor backtest performance?
A:
1. Check if the coin is suitable for trend-following strategies
2. Adjust parameters (swing length, channel period)
3. Try different timeframes
Q: How to set alerts?
A:
1. Click "Alert" in top-right corner of chart
2. Condition: Select "Strategy - Trend Following CRYPTOCAP:ZEC "
3. Choose "Order filled"
4. Set notification method (Webhook/Email/App)
---
## 📞 Contact Information
Strategy Name: Trend Following CRYPTOCAP:ZEC
Version: v1.0
Pine Script Version: v6
Last Updated: December 2025
---
## 📄 Copyright Notice
This strategy is for educational and research purposes only.
All risks of using this strategy for live trading are borne by the user.
Commercial use without authorization is prohibited.
---
## 🎓 Learning Resources
To understand the strategy principles in depth, recommended reading:
- "The Complete TurtleTrader" - Curtis Faith
- "Trend Following" - Michael Covel
- TradingView Pine Script Official Documentation
---
Happy Trading! Remember to manage your risk 📈

SMC Pro [Stansbooth]
🔮 SMC × Fibonacci Confluence Engine — The Hidden Algorithm of the Markets
Welcome to a level of chart analysis where mathematics , market psychology , and institutional logic merge into one ultra-intelligent system.
This indicator decodes the true structure of price delivery by combining Smart Money Concepts with the timeless precision of Fibonacci ratios , revealing what retail traders can’t see — *the algorithmic heartbeat of the market*.
✨ What Makes This Indicator Different
Instead of drawing random lines or reacting to late signals, this tool **anticipates** market behavior by reading the footprints left behind by institutional algorithms. Every element is placed with purpose — every zone, every shift, every fib level — all forming a seamless narrative that explains *why* price moves the way it does.
🔥 Core Intelligence Features
Advanced BOS/CHOCH Auto-Detection — Spot structure shifts before momentum even forms.
Institutional Liquidity Mapping
— Identify liquidity pools, engineered sweeps, equal highs/lows, and trap zones designed by smart money.
Fibonacci-Aligned Precision Zones
— Auto-generated fib grids synced with SMC levels for pinpoint reversal and continuation setups.
Imbalance Engine
— FVGs, displacement, inefficiencies, and mitigation blocks displayed with crystal clarity.
Premium/Discount Algorithm
— Understand instantly whether price is in a zone of accumulation or distribution.
🚀 Designed for Traders Who Want an Edge
Whether you're scalping fast moves, capturing intraday swings, or holding higher-timeframe plays, this indicator provides a professional lens into the market. It turns complex price action into a structured, predictable system where every move has logic and every entry has confluence.
You don’t just see the chart —
you see the intention behind every push, pull, manipulation, and reversal.
💎 Why It Feels Like a Cheat Code
Because it mirrors the way institutions analyze the market:
— Identify liquidity
— Seek equilibrium
— Deliver price
— Create inefficiency
— Mitigate
— Continue the narrative
Using SMC and Fibonacci together unlocks the “algorithmic geometry” behind price movement, giving you clarity where others see chaos.
⚡ Trade With Confidence, Confluence & Control
This indicator isn’t just a tool.
It’s a complete trading framework — structured, intelligent, and deadly accurate.
Master the markets.
Decode the algorithm.
Trade like smart money .

StrategyScript77 Is a rule-based strategy built on top of an Ichimoku based engine.
Ichimoku concepts are used as the backbone for trend and momentum filtering, so the strategy tends to stay on the side of the dominant move instead of fighting it.
The name “Super77” comes from the behavior I consistently observed in testing because the win rate tends to hover around the 70–80% range, often clustering around ~77% when used as intended.
It’s not a promise or guarantee, but it reflects the core design philosophy: frequent, relatively small but steady wins, with controlled and manageable losses.
Trading Style – Built for Conservative Traders
Super77 is intentionally designed for traders who prefer a conservative and calm approach:
Entries only at bar close
The strategy waits for bar close confirmation before entering a position. No intrabar guessing, no chasing half-formed signals. If the signal is still valid at close, only then will it enter.
Exits automated on bar close
Exits are also managed on bar close, which makes the logic transparent, easy to review on the chart, and more robust in backtesting compared to tick-based or intrabar hacks.
Semi-auto friendly
If you like to keep some discretion, you can treat it as semi-automatic:
Let the strategy generate entry signals
Manually cancel or skip certain trades if market context changes (news, extreme volatility, etc.)
This combination makes Super77 suitable for traders who don’t want to stare at the screen all day but still want structure and automation.
How to Use
Works best with bar-close execution (avoid trying to simulate intrabar fills if you want consistent behavior).
Designed for conservative, trend-aligned trading, not for hyper-scalping or news gambling.
Can be used as:
Fully automated (let all entries/exits trigger on bar close), or
Semi-automated (use alerts/signals but manually cancel some entries).
Step-by-Step: Automation with Cornix (Webhook Setup)
You can automate Super77 using Cornix by connecting TradingView alerts to your Cornix group via webhook.
Note: Exact button names may differ slightly depending on Cornix / TradingView updates, but the flow is always the same:
Cornix group → get webhook URL & mapping → TradingView alerts → signals sent to Cornix.
(Optional) Map specific pairs / directions
If you use UUID / signal mapping per symbol and per side (long/short), set them up in Cornix according to your own template.
Super77 can be used either:
On a single pair (simple setup), or
On multiple pairs if your alert / webhook structure supports that. So you can pick many pairs with 1 script.
Final Notes & Disclaimer
Super77 is an educational and experimental trading tool, not financial advice.
Past performance in back tests does not guarantee future results.
Always:
Test on demo or paper first
Adjust risk to match your own profile
Accept that losses and drawdowns are a natural part of any strategy
If you’re looking for a strategy that reflects a conservative, confirmation-based trading style with a focus on steady win rate and smoother equity behavior, Super77 was built exactly with that mindset in mind.

VWolf - Raptor ClawOVERVIEW
The 'VWolf - Raptor Claw' is a straightforward scalping strategy designed for high-frequency trades based on the Stochastic RSI indicator. It focuses exclusively on identifying potential trend reversals through stochastic cross signals in extreme zones, without the need for additional confirmations. This makes it highly responsive to market movements, capturing rapid price shifts while maintaining simplicity.
This strategy is best suited for highly liquid and volatile markets like forex, indices, and major cryptocurrencies, where quick momentum shifts are common. It is ideal for experienced scalpers who prioritize fast entries and exits, but it can also be adapted for swing trading in lower timeframes.
Entry Conditions:
Long Entry:Stochastic RSI crosses above the oversold threshold (typically 20), indicating a potential bullish reversal.
Short Entry:Stochastic RSI crosses below the overbought threshold (typically 80), indicating a potential bearish reversal.
Exit Conditions:
Stop Loss: Set at the minimum (for longs) or maximum (for shorts) within a configurable lookback window to reduce risk.
Take Profit: Defined by a risk-reward ratio (RRR) input to optimize potential gains relative to risk.
CONCLUSION
The 'VWolf - Raptor Claw' strategy is perfect for traders seeking a simple yet aggressive approach to the markets. It capitalizes on sharp momentum shifts in extreme zones, relying on precise stop loss and take profit settings to capture rapid profits while minimizing risk. This approach is highly effective in high-volatility environments where quick decision-making is essential.
FOR MORE INFORMATION VISIT vwolftrading.com

ATR ZigZag BreakoutATR ZigZag Breakout
This strategy uses my ATR ZigZag indicator (powered by the ZigZagCore library) to scalp breakouts at volatility-filtered highs and lows.
Everyone knows stops cluster around clear swing highs and lows. Breakout traders often pile in there, too. These levels are predictable areas where aggressive orders hit the tape. The idea here is simple:
→ Let ATR ZigZag define clean, volatility-filtered pivots
→ Arm a stop market order at those pivots
→ Join the breakout when the crowd hits the level
The key to greater success in this simple strategy lies in the ZigZag. Because the pivots are filtered by ATR instead of fixed bar counts or fractals, the levels tend to be more meaningful and less noisy.
This approach is especially suited for intraday trading on volatile instruments (e.g., NQ, GC, liquid crypto pairs).
How It Works
1. Pivot detection
The ATR ZigZag uses an ATR-based threshold to confirm swing highs and lows. Only when price has moved far enough in the opposite direction does a pivot become “official.”
2. Candidate breakout level
When a new swing direction is detected and the most recent high/low has not yet been broken in the current leg, the strategy arms a stop market order at that pivot.
• Long candidate → most recent swing high
• Short candidate → most recent swing low
These “candidate trades” are shown as dotted lines.
3. Entry, SL, and TP
If price breaks through the level, the stop order is filled and a bracket is placed:
• Stop loss = ATR × SL multiplier
• Take profit = SL distance × RR multiplier
Once a level has traded, it is not reused in the same swing leg.
4. Cancel & rotate
If the market reverses and forms a new swing in the opposite direction before the level is hit, the pending order is cancelled and a new candidate is considered in the new direction.
Additional Features
• Optional session filter for backtesting specific trading hours

Sniper PRO: The "Buffett Mode" VFI System"The stock market is a device for transferring money from the impatient to the patient." — Warren Buffett
Most traders lose money because they try to catch every small move. Sniper PRO is designed for the opposite: It identifies the massive, multi-week and multi-month trends driven by Institutional "Smart Money", and keeps you in the trade until the real move is over.
This is not a scalping tool. This is a Wealth Compounding Engine.
🚀 Why is this the "Secret Weapon"?
We combined the most searched and respected indicators into a single, high-probability algorithm:
VFI (Smart Money Flow): Tracks what the "Whales" are doing, not the retail traders.
Fibonacci Golden Ratio: Uses math to secure profits, not guesswork.
Trend Protocol: Filters out 90% of market noise.
🔥 The "Diamond Hands" Logic (VFI Shield)
The biggest problem in long-term trading is getting shaken out by a temporary dip. Sniper PRO solves this with the VFI Shield:
Even if price drops below your Stop Loss, the algorithm checks the Institutional Volume.
If Big Money is still holding? The Shield holds. You stay in the trade.
This feature alone allows you to ride trends for Weeks and Months (like NVDA, TSLA, BTC runs) without exiting prematurely.
⚙️ How It Works
1. The "Buffett" Entry We only enter when the odds are stacked in our favor:
Trend: Price must be above the EMA 50 (Bull Market).
Volume: VFI must be Positive (Accumulation Phase).
Volatility: The market must be active, not chopping sideways.
2. The Compounding Exit (Fibonacci Ladder) Instead of selling too early, the system builds a Fibonacci Ladder behind the price.
As the asset grows, your Stop Loss climbs automatically to the next Fibonacci level (0.382 -> 0.5 -> 0.618).
This locks in profits step-by-step while giving the asset room to breathe and grow.
3. Asymmetric Safety Shorting is risky in a long-term bull market. The system automatically reduces the size of Short trades to protect your capital, while maximizing exposure to Long rallies.
📊 Visual Guide
🔵 Blue Line: The Trend Baseline.
🔴 Red Steps: Your "Locked" Profit Level (Trailing Stop).
🟣 Purple 'X': Where the trade finally closed (Transparency).
Background Color:
Green: Bull Market (Safe to hold).
Orange: Choppy/Dangerous (Cash is King).
Best For:
Swing Traders & Investors (1D, 4H Timeframes).
People who want to catch the Big Moves and ignore the noise.
Disclaimer: This tool is designed for trend following. Past performance is not indicative of future results. Always manage your risk.

Momentum FlowThis is a rule-based, fully automated trading strategy** developed **exclusively for BANKNIFTY** and optimized strictly for the **2-Hour (2H) timeframe**. The system is designed to identify **high-quality directional opportunities** while filtering out low-probability market noise.
The strategy is built for traders who prefer:
* Clean positional trading
* Limited, high-quality signals
* Fully mechanical execution
* No discretionary decision-making
This system is **locked by design** and will **only operate on BANKNIFTY – 2H timeframe** to preserve performance integrity. Usage on any other symbol or timeframe is intentionally restricted.
---
### ✅ SUITABLE FOR:
* Positional traders
* Swing traders
* Working professionals
* Traders seeking structured, disciplined systems
---
### ❌ NOT SUITABLE FOR:
* Scalping
* Low-timeframe trading
* High-frequency setups
* Traders seeking daily signals
---
### ⚠️ IMPORTANT DISCLAIMER:
This strategy is provided strictly for **educational and research purposes only**. Trading in financial markets involves significant risk, and losses are possible. Past performance does not guarantee future results. The creator is not responsible for any financial losses incurred by the use of this strategy. Always trade with proper risk management.
---

Indian Scalper 2025 – PSAR + SMA50 + RSI≤50 + High Volume (75%)Best 1-min / 2-min scalping strategy for NIFTY, BANKNIFTY, FINNIFTY & liquid stocks in 2025
✓ PSAR flip + SMA-50 trend filter
✓ RSI ≤50 (avoids chasing)
✓ Only high-volume candles (bright colour)
✓ Loud mobile alerts with price & SL
✓ 1:2+ RR with PSAR trailing
Works like magic 9:15–11:30 AM and 2–3:20 PM
Made with love for the Indian trading community ♥

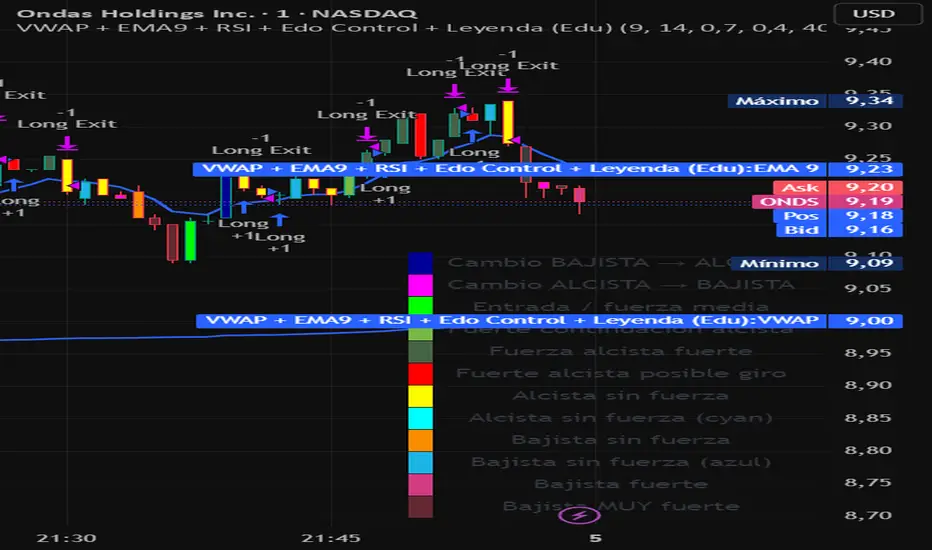
VWAP + EMA9 + RSI + Edo Control (Edu)VWAP + EMA9 + RSI + Edo Control (Edu)
A complete intraday scalping system that combines institutional levels, fast trend signaling and enhanced candle-color analysis for maximum clarity and confirmation.
This indicator includes:
1. VWAP (Volume Weighted Average Price)
The institutional reference line used to determine value zones, liquidity bias and directional pressure.
2. EMA9 (Fast Exponential Moving Average)
A micro-trend guide that reacts quickly to short-term movements and improves timing on pullback entries.
3. RSI (Relative Strength Index)
A clean momentum filter using the classic >50 (bullish) and <50 (bearish) bias.
Edo Control – Advanced Colored Candle System
This version integrates Edo Control, a custom candle-color engine that visualizes market strength shifts based on Williams %R, directional movement and ADX behavior.
Each candle color represents a different market condition, such as:
Trend acceleration
Trend weakening
Possible reversals
Momentum spikes
Bullish or bearish pressure
Transition zones
A built-in movable legend explains the meaning of each color directly on the chart, so traders can identify conditions instantly without guessing.
Why this indicator works
The combination of VWAP + EMA9 + RSI + colored candle strength creates a multi-layer confirmation system that cuts noise and highlights only meaningful setups.
Designed for 1m, 3m, 5m charts, but also effective on higher timeframes.
Suitable for: stocks, indices, futures, forex, crypto.
ETH INFINITY TREND [1H]: The Institutional Anti-Crash AlgorithmSTOP TRADING AGAINST THE TREND. AUTOMATE YOUR SUCCESS.
Are you tired of strategies that make big gains one month and give it all back the next? Are you looking for an algorithm capable of beating the market while strictly protecting your capital during Crashes?
Discover ETH Infinity Trend , the H1 Swing Trading strategy designed for consistency, safety, and long-term performance.
This is not a nervous scalping bot eaten alive by fees. It is an intelligent Trend Following system, calibrated to capture major Ethereum directional moves while staying liquid (Cash) when the market becomes dangerous.
🏆 WHY IS THIS STRATEGY UNIQUE?
✅ "Bulletproof" History (2017-2025) Unlike the market, which suffered massive losses in 2018 (-80%) and 2022 (-65%), this algorithm successfully protected capital during EVERY major bearish phase.
✅ Bull Run Outperformance The algorithm doesn't just follow; it accelerates gains during parabolic phases (like 2021 and 2025) by staying in position as long as the bullish structure remains intact.
✅ Zero Stress / Zero Overtrading The strategy is patient. It filters out market "noise" to take only high-probability moves. No more stress from holding open positions during crashes.
⚙️ THE "SMART TREND" ENGINE (Proprietary Logic)
This script uses a combination of 3 algorithmic engines to secure your entries. Exact settings are protected to ensure a competitive advantage for members:
Adaptive Trend Engine: Detects flow direction with a wide safety factor to avoid "scam wicks" and stop hunts typical of crypto exchanges. Institutional Long-Term Filter: We only trade in the direction of big investment funds. If the Macro trend is bearish, the algorithm forces a Cash (USDT) position to preserve capital. Dynamic Momentum Filter: The algorithm stays inactive during flat markets (Ranging) to avoid grinding down capital with fees. It only enters if the movement has genuine impulsive strength.
📊 CERTIFIED PERFORMANCE (Historical Backtests)
The numbers speak for themselves. Here is how the strategy behaves under extreme market conditions:
🟢 Current Profitability (2025 YTD): +91% While the classic market (Buy & Hold) shows about +55%, the algorithm massively outperforms by avoiding intermediate corrections.
🛡️ Crash Resistance (2018 Bear Market): +29% This is the most important statistic. In 2018, Ethereum lost -82% of its value. Most traders were wiped out. This strategy not only protected capital but finished the year in profit.
💎 Zero Negative Years (2017-2025) Over a complete 8-year history, including two major market cycles, the strategy has never closed a year with a loss.
📉 RISK MANAGEMENT
Profit Factor: > 2.0 (For every $1 lost, the strategy earns more than $2). Controlled Drawdown: The strategy cuts losing positions quickly using a dynamic Trailing Stop, keeping equity drawdown far below that of the market. Fees Included: All results include transaction fees (Taker) and slippage estimates.
🤖 READY FOR AUTOMATION
This script is turnkey ready to be connected to bots via Webhooks (3Commas, Alertatron, or Custom Python Bot on Vultr/AWS).
No Repainting: Signals are fixed at candle close. What you see is what executes. Clear Signals: Buy (Long) and Exit alerts are fully configurable. Zero Leverage Needed: The strategy is designed to be profitable on Spot or 1x Futures.
🔒 ACCESS & INVITATION
This script is available via Invite Only to guarantee exclusivity and preserve signal quality.
👉 HOW TO GET ACCESS? Send me a private message here on TradingView to inquire about access conditions.
Disclaimer: Past performance is not indicative of future results. Cryptocurrency trading involves risk. Only invest what you can afford to lose.

Titan EMA Liquidity [Stansbooth]
🔥 Precision EMA + FVG Liquidity Sweep System
Advanced Buy/Sell Signal Engine for High-Probability Trade Entries
Unlock a new level of precision with this all-in-one market structure indicator built for traders who demand accuracy, clarity, and confidence.
This tool combines EMA trend filtration , Fair Value Gap (FVG) detection , and liquidity sweep analysis to deliver powerful buy and sell signals that align with institutional price behavior.
✅ Key Features
Dynamic EMA Trend Filter:
Identifies true trend direction and filters out low-quality trades. Signals only trigger when momentum aligns with higher-timeframe directional bias.
Smart FVG Detection:
Automatically highlights bullish and bearish Fair Value Gaps, helping you spot premium/discount zones where institutional traders seek entries.
Liquidity Sweep Identification:
Detects equal highs/lows, stop hunts, and engineered liquidity grabs—then confirms reversals when price sweeps liquidity and returns inside structure.
High-Accuracy Signal Engine:
Buy/Sell alerts trigger only when three layers agree:
1. EMA trend alignment
2. FVG confirmation
3. Liquidity sweep completion
This results in cleaner signals , fewer false entries, and strong trend continuation setups.
Optimized for All Market Conditions:
Works for scalping, day trading, and swing trading across Forex, Crypto, Indices, and Stocks.
What This Indicator Helps You Achieve
Capture smart-money style entries with reduced drawdown
Enter after liquidity grabs instead of before them
Avoid chop with EMA-filtered market direction
Spot precision premium/discount zones using automatic FVG mapping
Obtain high-confidence Buy/Sell signals based on institutional concept
Why Traders Love It
This system isn’t just another signal generator—it’s a market-structure aware model that reads the chart the same way professional traders do.
Every signal is based on probability stacking , giving you the clarity and confidence to take the best setups while ignoring noise.

BTR Auto Buy/Sell Trend System
BTR Auto Buy/Sell Trend System — Your New Profit Machine!
Discover the only TradingView system you need to spot powerful trend reversals with precision, confidence, and automation.
Designed for Stocks, Crypto & Commodities, this strategy consistently delivers 60%–80% accuracy in trending markets.
This is not just a script…
👉 It’s your complete plug-and-play trading system.
💡 Why Traders Love This System
✔ Early Trend Identification
Catch major reversals before the crowd.
✔ Non-Repainting Confirmed Signals
All entries are triggered only on candle close, so what you see is what you trade.
✔ Smart ATR + Momentum Engine
Filters bad trades automatically, giving you only high-quality signals.
✔ Works on All Timeframes
From 5-minute scalping to daily swing trading.
✔ Full Auto-Trading Ready
Pre-built JSON alerts for API Algo Trading.
No coding. No setup headache. Just copy → paste → trade.
⚡ How You Make Money With This Strategy
Step 1: Wait for Trend Flip
🔵 BUY when the system flips from bearish → bullish
🔴 SELL when it flips from bullish → bearish
Step 2: Enter on Confirmed Signal
Trade only on the bar after signal closes.
Step 3: Ride the Trend
Let the strategy take the move.
It avoids sideways markets and shines in strong trends.
Step 4: Auto Alerts (Optional)
Turn on Dhan alerts and let the system execute trades automatically.
📈 What You Can Expect (Typical Performance)
✔ 60–80% success rate in trending markets
✔ Works in Stocks, Crypto, Commodities
✔ High accuracy in 15m, 30m, 1H, 4H charts
✔ Avoids most fake breakouts & sideways noise
This system is built for consistency, simplicity, and scalable automation.
⭐ Perfect For:
Beginner traders
Algo traders
Swing traders
Scalpers
Systematic
API users
Anyone who wants clean, high-probability trend signals
⚠ Disclaimer
Trading involves risk. Past results do not guarantee future returns.
Use proper risk management for best results.

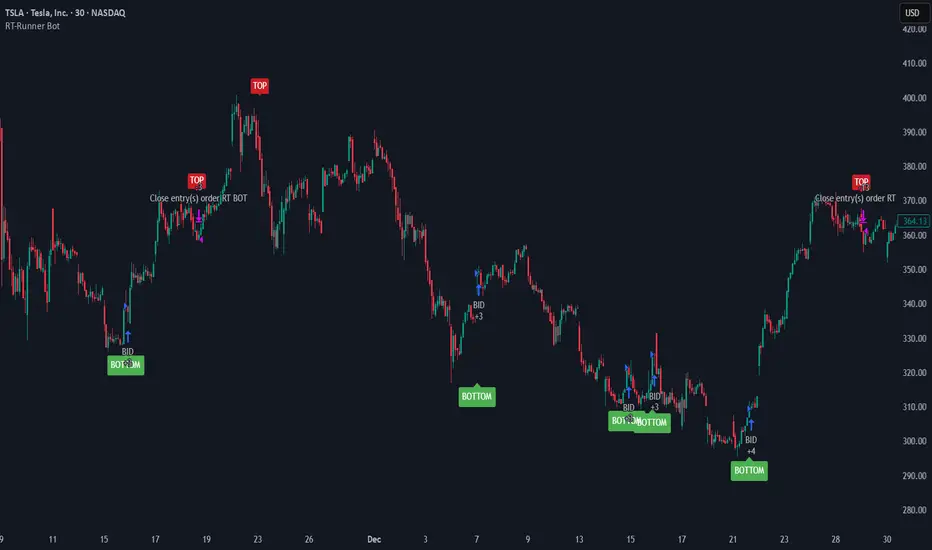
RT-Runner BotRunner Bot is a trend following tool designed to highlight when price shifts from normal back and forth rotation into stronger directional moves. It is built to help traders focus on higher quality trend legs, stay patient during chop, and avoid forcing trades when conditions are not aligned.
Blurring The Lines - Indicator vs Bot
Rainbow Trends set out to combine some of the ideas behind automated trading bots with the flexibility of trading indicators. After years of development, Runner Bot was built as an "indicator bot" that can be applied across multiple assets and multiple timeframes from the same interface.
How It Works
This tool aims to identify points where large market players - the "whales" - may be more likely to reverse the trend. It generates BOTTOM signals when its conditions suggest a potential market bottom has formed, and TOP signals when it detects that a potential top has been reached.
These signals are plotted directly on the chart so traders can visually review where Runner Bot has flagged prior tops and bottoms and compare them with their own levels, structure, and risk management.
How It Changes With Timeframe
Runner Bot identifies trend reversals based on the selected timeframe. The same logic can be applied across intraday, swing, and macro views, but its behavior will naturally change:
For macro level reversals, many traders focus on higher timeframes such as H4 to H12.
If you are scalping, you can switch to much lower timeframes, but keep in mind that bottoms detected on shorter intervals are less reliable at predicting a true long term bottom.
Choosing the timeframe intentionally is important: higher timeframes tend to highlight larger structural tops and bottoms, while lower timeframes are more sensitive to short term noise.
Tuning The Bot
Runner Bot was built to be relatively turnkey, but it does allow users to tune it for specific timeframes and assets.
To adjust the sensitivity of the TOP/BOTTOM prints, adjust the first two values in the settings column:
Decreasing these values (negative adjustments) will generally increase the number of TOP/BOTTOM signals the bot will fire.
Increasing these values will do the opposite and make TOP/BOTTOM signals less common.
This lets traders decide whether they want Runner Bot to be more selective (fewer, higher conviction style signals) or more frequent (more signals for active traders).
The trader also has the option to toggle the signals On/Off as desired. Some traders prefer to only plot TOPs and not BOTTOMs, or only BOTTOMs and not TOPs, depending on their strategy.
Limitations Of The Tool
Under the hood, Runner Bot uses internal algorithms working together to analyze price action. It can be applied across multiple timeframes, but like any tool, it has its sweet spots:
On higher ranges like 12H to 1D, you will mostly see TOP signals, which can be useful for monitoring extended moves.
On ultra low timeframes under 15 minutes, market noise can increase and short term bottoms are less reliable as long term turning points.
Fine tuning your settings to match your strategy, asset, and timeframe is recommended rather than relying on one configuration for every situation.
Preferred Settings
Over time, a few configurations have become common starting points:
H4 - A core timeframe to start catching both Tops and Bottoms across TradFi, Crypto, and Commodities.
H2/H4 Combo - Monitoring Bottoms on H2 and taking profits on H4 has been a popular combination among Rainbow Theory traders. H2 can provide earlier entries, while H4 offers a more conservative, lagging exit.
1D/H24 - Helpful for macro Tops in both TradFi and Crypto when combined with other higher timeframe context.
These are not rules, but practical examples of how some traders choose to deploy Runner Bot.
Automating Alerts
Runner Bot can also be connected to standard TradingView alerts so TOP and BOTTOM signals do not need to be watched manually on every bar.
A typical alert setup:
Symbol - Set to the asset you are charting.
Condition - Set to Runner Bot (this will use the settings you currently have on the chart).
Condition detail - Use the alert() function calls only so the tool can send alerts when TOP or BOTTOM signals fire.
Interval - Same as chart (this locks alerts to the timeframe you set them up on).
Once alerts are configured, TradingView can notify you according to your alert preferences whenever Runner Bot detects a new TOP or BOTTOM based on your current settings.
Important Note
Runner Bot is intended to provide additional context around tops, bottoms, and broader trend behavior. It is not a standalone signal generator and should always be used together with your own analysis, testing, and risk management. Historical Runner Bot signals and past market reversals do not guarantee future results.
🐋 Tight lines and happy trading!