ROC_PA_Strategy (A3Sh)Hi there,
An experiment with rate of price change in combination with price averaging. The strategy is inspired by Price Change Scalping Strategy developed by Prosum Solutions and Scalping Dips On Trend Strategy developed by Coinrule. Both strategies look at the percentage of price change to open orders.
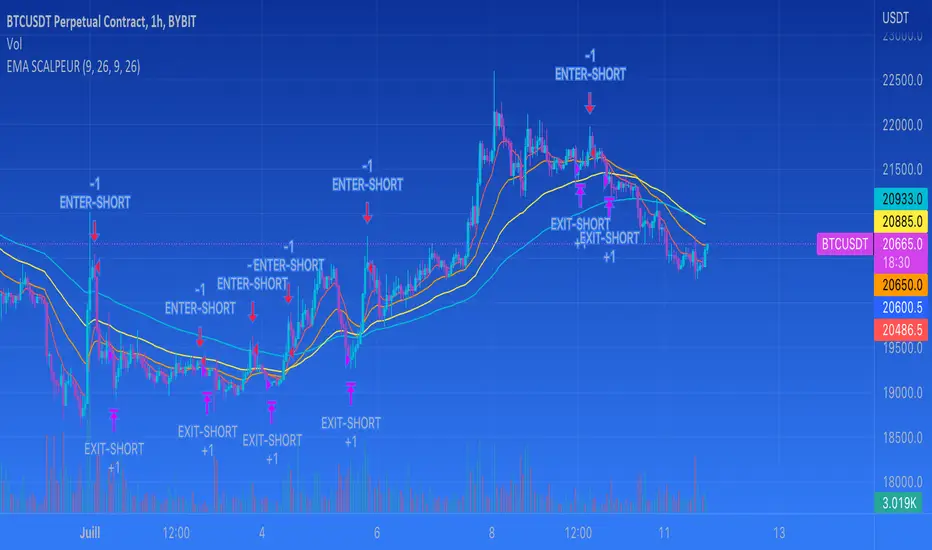
When the price drops beyond a specified percentage, a order entry threshold (yellow line) is setup. The order entry threshold is only active for a specified number of bars and will de-activate when not crossed within the specified number of bars. When the price drops further and crosses the entry threshold with a minimum of a specified percentage, a long position is entered. The same reverse logic (white line) used to close the long position.
I first ran the strategy without stop loss and take profit and that worked very well in a bullish market. I later added stop loss and take profit and that seems to work better in a side ways or bearisch market. There are a lot of tweaking possibilities in the settings.
In the settings you can specify the percentage of portfolio to use for each trade to spread the risk and for each order a trading fee of 0.075% is calculated.
Pine Script® strategy