Bayesian Liquidity Pain & Gain [Instit. Vol Weighted]Bayesian Liquidity Pain & Gain Indicator
Stop guessing where support and resistance are.
The Bayesian Liquidity Pain & Gain indicator moves beyond arbitrary lines and raw price action. It quantifies Institutional Intent by calculating the exact price levels where large volume has been accumulated and visualizes the "Pain" (stress) those participants feel when the market moves against them.
The Logic: Quantified Institutional Stress
Institutions don't trade single candles; they accumulate positions over time. This indicator tracks their Volume-Weighted Average Cost Basis to answer two critical questions:
Where did they enter? (The Cost Basis Lines)
Are they underwater? (The Pain Clouds)
By normalizing price distance using volatility (ATR) and statistical deviation (Z-Score), we filter out noise and only highlight zones where "Smart Money" is statistically forced to defend their positions or capitulate.
How to Read the Chart
1. The Cost Basis Lines (Anchors)
• 🟢 Green Line (Buyer Cost Basis): The average price where institutions accumulated long positions. This acts as dynamic Support.
• 🔴 Red Line (Seller Cost Basis): The average price where institutions accumulated short positions. This acts as dynamic Resistance.
2. The Pain Clouds (Signals)
When price moves significantly away from the cost basis (Z-Score > 2.0), "Clouds" appear to visualize the PnL status of the participants:
• 🔴 Red Cloud (Buyer Pain): Price is below the buyer's entry. Buyers are losing money (in the red). This creates a "Discount" zone where they may defend support.
• 🟢 Green Cloud (Seller Pain): Price is above the seller's entry. Sellers are losing money (shorts are squeezed). This indicates strong bullish momentum.
3. The Multi-Timeframe Dashboard
A real-time HUD showing the Z-Score status across 4 timeframes (1m, 5m, 15m, 1h):
• 🟢 Green: Profitable/Neutral (Trend Continuation)
• 🟠 Orange: Warning (Pressure Building)
• 🔴 Red: Critical Pain (High Probability Reversal)
Trading Strategies
Setup 1: The Defensive Bounce (Long)
• Context: Price drops into a 🔴 Red Cloud (Buyer Pain).
• Trigger: Price touches the 🟢 Green Line (Buyer Cost Basis) and shows a rejection wick.
• Logic: Institutional buyers defend their cost basis to avoid realizing losses.
Setup 2: The Short Squeeze (Momentum)
• Context: Price rallies into a 🟢 Green Cloud (Seller Pain).
• Trigger: Price holds above the 🔴 Red Line (Seller Cost Basis).
• Logic: Short sellers are trapped and forced to buy back (cover), fueling the rally.
Fractal Alignment:
For high-conviction trades, wait for the Dashboard to show "Pain" signals on both the 1h (Anchor) and 5m (Trigger) timeframes simultaneously.
Settings
• Memory Length (Default 144): The lookback period for the institutional cost basis. Increase for swing trading, decrease for scalping.
• Sigma Threshold (Default 2.0): The statistical confidence level for "Pain". Higher values = fewer, stronger signals.
• Volume Amp: When enabled, high volume amplifies the pain signal, giving more weight to institutional footprints.
Search in scripts for "scalping"

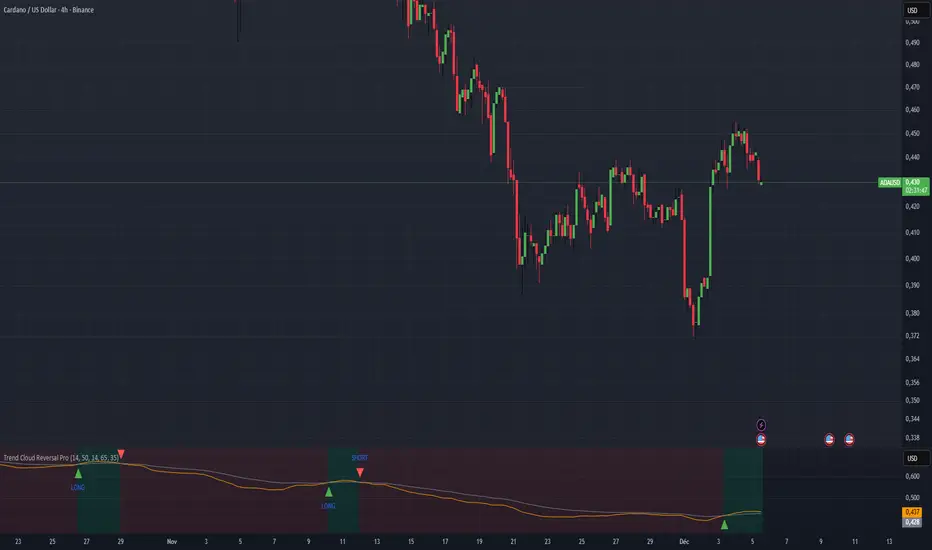
Color Trend Reversal by [Orthodox777]Provides a reversal signal (arrow + “LONG” or “SHORT”) when the trend changes.
Can be used for swing trading, intraday trading, or scalping.
MTF Dashboard Pro - Sachin ThakareMTF Dashboard Pro — Sachin Thakare
Version: 1.0
Overview:
A compact multi-timeframe dashboard built for intraday and swing traders. Shows per-TF values + signals:
- Change, %Chg, VWAP, EMA9/21, 200MA distance (with user threshold), SuperTrend, RSI, MACD, ADX, Alligator, Stochastic, ATR, PH/PL and Bias.
- Optional TrendShift flag (MSS + EMA9/21 confirmation) appears alongside Bias.
Notes:
- Pine Script v5. Adjust inputs to match your asset/timeframe. Default EMAs: 9 (red) and 21 (green).
- ma200Thresh parameter filters noise around 200MA (unit = percent). Recommended: 0.3–0.7 for intraday scalping.
- Use on desktop charts — table is not optimized for small mobile screens.
Disclaimer:
This indicator is educational and provided “as is”. Not financial advice. Test before trading.
Changelog:
1.0 — Public release
Author:
Sachin Yashwant Thakare

Range Lattice## RangeLattice
RangeLattice constructs a higher-timeframe scaffolding on any intraday chart, locking in structural highs/lows, mid/quarter grids, VWAP confluence, and live acceptance/break analytics. It provides a non-repainting overlay that turns range management into a disciplined process.
HOW IT WORKS
Structure Harvesting – Using request.security() , the script samples highs/lows from a user-selected timeframe (default 240 minutes) over a configurable lookback to establish the dominant range.
Grid Construction – Midpoint and quarter levels are derived mathematically, mirroring how institutional traders map distribution/accumulation zones.
Acceptance Detection – Consecutive closes inside the range flip an acceptance flag and darken the cloud, signaling balanced auction conditions.
Break Confirmation – Multi-bar closes outside the structure raise break labels and alerts, filtering the countless fake-outs that plague breakout traders.
VWAP Fan Overlay – Session VWAP plus ATR-based bands provide a live measure of flow centering relative to the lattice.
HOW TO USE IT
Range Plays : Fade taps of the outer rails only when acceptance is active and VWAP sits inside the grid—this is where mean-reversion works best.
Breakout Plays : Wait for confirmed break labels before entering expansion trades; the dashboard's Width/ATR metric tells you if the expansion has enough fuel.
Market Prep : Carry the same lattice from pre-market into regular trading hours by keeping the structure timeframe fixed; alerts keep you notified even when managing multiple tickers.
VISUAL FEATURES
Range Tap and Mid Pivot markers provide a tape-reading breadcrumb trail for journaling.
Cloud fill opacity tightens when acceptance persists, visually signaling balance compressions ready to break.
Dashboard displays absolute width, ATR-normalized width, and current state (Balanced vs Transitional) so you can glance across charts quickly.
Acceptance Flag toggle: Keep the repeated acceptance squares hidden until you need to audit balance.
PARAMETERS
Structure Timeframe (default: 240): Choose the timeframe whose ranges matter most (4H for indices, Daily for stocks).
Structure Lookback (default: 60): Bars sampled on the structure timeframe.
Acceptance Bars (default: 8): How many consecutive bars inside the range confirm balance.
Break Confirmation Bars (default: 3): Bars required outside the range to validate a breakout.
ATR Reference (default: 14): ATR period for width normalization.
Show Midpoint Grid (default: enabled): Display the midpoint and quarter levels.
Show Adaptive VWAP Fan (default: enabled): Toggle the VWAP channel for assets where volume distribution matters most.
Show Acceptance Flags (default: disabled): Turn the acceptance markers on/off for maximum visual control.
Show Range Dashboard (default: enabled): Disable if screen space is limited, re-enable during prep sessions.
ALERTS
The indicator includes five alert conditions:
Range High Tap: Price interacted with the RangeLattice high
Range Low Tap: Price interacted with the RangeLattice low
Range Mid Tap: Price interacted with the RangeLattice mid
Range Break Up: Confirmed upside breakout
Range Break Down: Confirmed downside breakout
Where it works best
This indicator works best on liquid instruments with clear structural levels. On very low timeframes (1-minute and below), the structure may update too frequently to be useful. The acceptance/break confirmation system requires patience—faster traders may find the multi-bar confirmation too slow for scalping. The VWAP fan is session-based and resets daily, which may not suit all trading styles.

FluxPulse Beacon## FluxPulse Beacon
FluxPulse Beacon applies a microstructure lens to every bar, combining directional thrust, realized volatility, and multi-timeframe liquidity checks to decide whether the tape is being pushed by real sponsorship or just noise. The oscillator's color-coded columns and adaptive burst thresholds transform complex flow dynamics into a single actionable flux score for futures and equities traders.
HOW IT WORKS
Momentum Extraction – Price differentials over a configurable pulse distance are smoothed using exponential moving averages to isolate directional thrust without reacting to single prints.
Volatility + Liquidity Normalization – The momentum stream is divided by realized volatility and multiplied by both local and higher-timeframe EMA volume ratios, ensuring pulses only appear when volatility and liquidity align.
Adaptive Thresholding – A volatility-derived standard deviation of flux is blended with the base threshold so bursts scale automatically between low-volatility and high-volatility market conditions.
Divergence Engine – Linear regression slopes compare price vs. flux to tag bullish/bearish divergences, highlighting stealth accumulation or distribution zones.
HOW TO USE IT
Continuation Entries : Go with the trend when histogram bars stay above the adaptive threshold, the signal line confirms, and trend bias agrees—this is where liquidity-backed follow-through lives.
Fade Plays : Watch for divergence alerts and shrinking compression values; when flux prints below zero yet price grinds higher, hidden selling pressure often precedes rollovers.
Session Filter : Compression percentage in the diagnostics table instantly tells you whether to trade thin overnight sessions—low compression means stand down.
VISUAL FEATURES
Dynamic background heat maps flux magnitude, while threshold lines provide a quick read on whether a pulse is statistically significant.
Diagnostics table displays live flux, signal, adaptive threshold, and compression for quick reference.
Alert-first workflow: The surface is intentionally clean—bursts and divergences are delivered via alerts instead of on-chart clutter.
PARAMETERS
Trend EMA Length (default: 34): Defines the macro bias anchor; increase for higher-timeframe confirmation.
Pulse Distance (default: 8): Controls how sensitive momentum extraction becomes.
Volatility Window (default: 21): Sample window for realized volatility normalization.
Liquidity Window (default: 55): Volume smoothing window that proxies liquidity expansion.
Liquidity Reference TF (default: 60): Select a higher timeframe to cross-check whether current volume matches institutional flows.
Adaptive Threshold (default: enabled): Disable for fixed thresholds on slower markets; enable for high-volatility assets.
Base Burst Threshold (default: 1.25): Minimum flux magnitude that qualifies as an actionable pulse.
ALERTS
The indicator includes four alert conditions:
Bull Burst: Detects upside liquidity pulses
Bear Burst: Detects downside liquidity pulses
Bull Divergence: Flags bullish delta divergence
Bear Divergence: Flags bearish delta divergence
LIMITATIONS
This indicator is designed for liquid futures and equity markets. Performance may degrade in low-volume or highly illiquid instruments. The adaptive threshold system works best on timeframes where sufficient volatility history exists (typically 15-minute charts and above). Divergence signals are probabilistic and should be confirmed with price action.
INSERT_CHART_SNAPSHOT_URL_HERE
---
## RangeLattice Mapper
RangeLattice Mapper constructs a higher-timeframe scaffolding on any intraday chart, locking in structural highs/lows, mid/quarter grids, VWAP confluence, and live acceptance/break analytics. It provides a non-repainting overlay that turns range management into a disciplined process.
HOW IT WORKS
Structure Harvesting – Using request.security() , the script samples highs/lows from a user-selected timeframe (default 240 minutes) over a configurable lookback to establish the dominant range.
Grid Construction – Midpoint and quarter levels are derived mathematically, mirroring how institutional traders map distribution/accumulation zones.
Acceptance Detection – Consecutive closes inside the range flip an acceptance flag and darken the cloud, signaling balanced auction conditions.
Break Confirmation – Multi-bar closes outside the structure raise break labels and alerts, filtering the countless fake-outs that plague breakout traders.
VWAP Fan Overlay – Session VWAP plus ATR-based bands provide a live measure of flow centering relative to the lattice.
HOW TO USE IT
Range Plays : Fade taps of the outer rails only when acceptance is active and VWAP sits inside the grid—this is where mean-reversion works best.
Breakout Plays : Wait for confirmed break labels before entering expansion trades; the dashboard's Width/ATR metric tells you if the expansion has enough fuel.
Market Prep : Carry the same lattice from pre-market into regular trading hours by keeping the structure timeframe fixed; alerts keep you notified even when managing multiple tickers.
VISUAL FEATURES
Range Tap and Mid Pivot markers provide a tape-reading breadcrumb trail for journaling.
Cloud fill opacity tightens when acceptance persists, visually signaling balance compressions ready to break.
Dashboard displays absolute width, ATR-normalized width, and current state (Balanced vs Transitional) so you can glance across charts quickly.
Acceptance Flag toggle: Keep the repeated acceptance squares hidden until you need to audit balance.
PARAMETERS
Structure Timeframe (default: 240): Choose the timeframe whose ranges matter most (4H for indices, Daily for stocks).
Structure Lookback (default: 60): Bars sampled on the structure timeframe.
Acceptance Bars (default: 8): How many consecutive bars inside the range confirm balance.
Break Confirmation Bars (default: 3): Bars required outside the range to validate a breakout.
ATR Reference (default: 14): ATR period for width normalization.
Show Midpoint Grid (default: enabled): Display the midpoint and quarter levels.
Show Adaptive VWAP Fan (default: enabled): Toggle the VWAP channel for assets where volume distribution matters most.
Show Acceptance Flags (default: disabled): Turn the acceptance markers on/off for maximum visual control.
Show Range Dashboard (default: enabled): Disable if screen space is limited, re-enable during prep sessions.
ALERTS
The indicator includes five alert conditions:
Range High Tap: Price interacted with the RangeLattice high
Range Low Tap: Price interacted with the RangeLattice low
Range Mid Tap: Price interacted with the RangeLattice mid
Range Break Up: Confirmed upside breakout
Range Break Down: Confirmed downside breakout
LIMITATIONS
This indicator works best on liquid instruments with clear structural levels. On very low timeframes (1-minute and below), the structure may update too frequently to be useful. The acceptance/break confirmation system requires patience—faster traders may find the multi-bar confirmation too slow for scalping. The VWAP fan is session-based and resets daily, which may not suit all trading styles.
---

SMT Alert MTF [Elykia]SMT Alert MTF - Smart Money Divergence Scanner
Overview
The SMT Alert MTF is an essential productivity tool for traders applying ICT (Inner Circle Trader) and SMC (Smart Money Concepts).
An SMT divergence ("Smart Money Technique") is one of the most powerful signals to confirm a trend reversal or market manipulation. It occurs when two highly correlated assets (e.g., Nasdaq and S&P500) move out of sync.
Instead of monitoring 3 different charts across 5 different timeframes manually, this indicator scans everything in the background and alerts you the moment a divergence appears.
💎 The Strategy: How to trade SMT?
SMT is not a blind entry signal; it is a confirmation tool.
1. The Context: Wait for price to reach a Key Level (POI, Order Block) or perform a Liquidity Sweep.
2. The Signal (Desynchronization):
Bullish SMT: Asset A makes a Lower Low, but correlated Asset B makes a Higher Low (Refusal to go lower). This indicates institutional accumulation.
Bearish SMT: Asset A makes a Higher High, but correlated Asset B makes a Lower High (Weakness). This indicates distribution.
Execution: Once the SMT alert triggers on your timeframe (e.g., M1 or M5), look for a Change of Character (CHoCH) to enter the trade.
Key Features & Benefits
⚡ Multi-Timeframe Scanner (MTF): Monitor up to 5 timeframes simultaneously (e.g., 1m, 5m, 15m, 1h, 4h) on a single chart.
🔄 Smart Asset Detection: The script automatically recognizes your current chart and selects the relevant comparison assets:
Trading NQ (Nasdaq) -> Compares with ES (S&P500).
Trading 6E (Euro) -> Compares with 6B (British Pound).
Trading Gold -> Compares with Silver.
(You can also manually override with any symbol).
👀 Visual Clarity: A divergence line is drawn directly on price action (Red for Bearish, Blue for Bullish) labeled with the divergent ticker.
🔔 Comprehensive Alerts: Set up specific alerts for each timeframe (e.g., "Alert me only for M5 or M15 SMT").
Recommended Settings
1. Enable M1, M5, and M15 timeframes for intraday scalping.
2. Keep the automatic symbol detection enabled for Indices and Futures.
⚠️ DISCLAIMER
This indicator is for educational purposes only. Trading involves a high level of risk. SMT divergences should be used in confluence with other technical analysis factors. The author is not responsible for any financial losses.

Sigma-X Algo [Main] - SMC & Volume Heatmap
**简介 / Short Description:**
A professional institutional trading system combining Statistical Mean Reversion (Sigma), Smart Money Concepts (SMC), and Volume Analysis. Designed for XAUUSD and BTC M5 scalping.
一套结合了统计学均值回归、SMC机构订单流以及量能热力图的专业交易系统。专为黄金(XAUUSD)和比特币(BTC)的M5短线交易设计。
**详细描述 / Description:**
---
### ** 中文说明**
**Sigma-X Algo** 是一套为高波动市场(如黄金、比特币)量身定制的狙击型交易系统。它不预测行情,而是通过捕捉价格的**“统计学极值”**与**“机构订单痕迹”**,寻找高胜率的反转机会。
#### **核心功能 (Core Features)**
1. **📊 统计学均值回归 (Sigma Extremes):**
* 基于 **TRIMA** 算法计算价格偏离度。
* 当价格触及 **3.0σ** 极值时,图表会出现 **钻石信号**。
* **S+ (彩色钻石):** 顺势极值,胜率加成。
* **Risk (灰色钻石):** 逆势极值,提示风险。
2. **🏛️ 多周期 SMC 订单块 (MTF Order Blocks):**
* **4H OB (绿色/橙色):** 大级别“城墙”,也是核心反转区。
* **1H OB (蓝色/红色):** 短线“战术掩体”,用于日内观察。
* **逻辑:** 采用“穿透即删除”逻辑,只保留未被截取 (Unmitigated) 的有效结构。
3. **🔥 量能热力图 (Volume Heatmap):**
* 通过 K 线染色识别主力行为。
* **亮紫色/亮黄色 K 线:** 代表成交量超过平均值的 **2.0倍**。这是机构入场护盘或出货的关键信号。
4. **🌊 趋势过滤器 (Trend Filter):**
* 内置 **EMA 50/144** 斐波那契均线组,自动判定当前是顺势还是逆势。
#### **实战策略 (How to Trade)**
* **做多狙击 (Long Setup):**
1. 价格回踩 **4H 看涨 OB (绿色框)**。
2. 主图出现 **绿色 S+ 钻石** 信号。
3. **K 线变色 (亮紫)**,确认主力爆量承接。
* **做空狙击 (Short Setup):**
1. 价格反抽 **4H 看跌 OB (橙色框)**。
2. 主图出现 **红色 S+ 钻石** 信号。
3. **K 线变色 (亮黄)**,确认主力出货。
---
### ** English Description**
**Sigma-X Algo** is a sniper-style trading system tailored for high-volatility assets like Gold (XAUUSD) and Bitcoin (BTC). Instead of predicting, it identifies high-probability reversals by combining **Statistical Extremes** with **Institutional Footprints**.
#### **Key Features**
1. **📊 Statistical Mean Reversion (Sigma Extremes):**
* Calculates price deviation based on the **TRIMA** algorithm.
* **Diamond Signals** appear when price hits the **3.0σ** extreme.
* **S+ (Colored Diamond):** Trend-following signals (High Probability).
* **Risk (Gray Diamond):** Counter-trend signals (Caution required).
2. **🏛️ MTF Smart Money Concepts (SMC):**
* **4H Order Blocks (Green/Orange):** The "HTF Wall". Primary reversal zones.
* **1H Order Blocks (Blue/Red):** Intraday tactical zones.
* **Logic:** Uses "Delete on Break" logic to keep the chart clean, showing only unmitigated zones.
3. **🔥 Volume Heatmap:**
* Highlights institutional activity by coloring candles.
* **Bright Purple/Yellow Candles:** Indicate volume is **2.0x** greater than average. This confirms "Stopping Volume" or "Climax" behavior.
4. **🌊 Trend Filter:**
* Built-in **EMA 50/144** Fibonacci ribbon to filter noise and identify the dominant trend.
#### **Trading Strategy**
* **Long Setup:**
1. Price dips into a **4H Bullish OB (Green Box)**.
2. A **Green S+ Diamond** appears.
3. **Highlighter Candle (Purple)** appears, confirming institutional absorption.
* **Short Setup:**
1. Price rallies into a **4H Bearish OB (Orange Box)**.
2. A **Red S+ Diamond** appears.
3. **Highlighter Candle (Yellow)** appears, confirming institutional distribution.
---
**Disclaimer:**
Trading involves high risk. This indicator is a tool for analysis, not financial advice. Always use stop losses.
---
# 2. 副图指标说明书 (Sub Indicator)
**标题 / Title:**
**Sigma-X Algo - Divergence & Momentum**
**简介 / Short Description:**
The companion oscillator for the Sigma-X system. Features absolute momentum (TRIMA), structural trend filtering, and automatic divergence detection.
Sigma-X 系统的配套副图指标。包含绝对动能算法、趋势结构过滤以及自动背离检测功能。
**详细描述 / Description:**
---
### ** 中文说明**
这是 **Sigma-X Algo** 系统的专用副图震荡指标,用于辅助主图进行动能确认和背离识别。
#### **核心功能**
1. **动能柱 (Momentum Histogram):**
* 基于价格与 TRIMA 均线的偏离度绘制。
* **实心柱:** 动能增强。
* **空心/浅色柱:** 动能衰竭(这是进场的重要参考)。
2. **👀 自动背离检测 (Auto Divergence):**
* 自动识别价格与动能之间的 **底背离 (Bullish)** 和 **顶背离 (Bearish)**。
* **绿线:** 底背离,提示潜在上涨。
* **红线:** 顶背离,提示潜在下跌。
3. **🦅 鹰眼预警 (Warning Zones):**
* 当动能突破 **1.8σ** 警戒线时,背景会变色,提示即将进入变盘区。
#### **如何配合主图使用**
当主图出现 **S+ 信号** 时,观察副图:
* 如果副图同时出现 **绿线 (底背离)**,胜率极高。
* 如果副图动能柱颜色变浅 (衰竭),确认反转即将发生。
---
### ** English Description**
This is the companion oscillator for the **Sigma-X Algo** system, designed to confirm momentum and identify divergences.
#### **Key Features**
1. **Momentum Histogram:**
* Calculated based on the deviation between Price and TRIMA.
* **Solid Colors:** Momentum is increasing.
* **Pale Colors:** Momentum is exhausting (A key trigger for entry).
2. **👀 Auto Divergence Detection:**
* Automatically plots **Regular Bullish (Green Line)** and **Regular Bearish (Red Line)** divergences between Price and Oscillator.
3. **🦅 Warning Zones:**
* Background changes color when momentum breaches the **1.8σ** warning threshold, signaling potential volatility.
#### **How to Use with Main Chart**
When a **S+ Signal** appears on the Main Chart:
* Look for a **Green Line (Bullish Divergence)** on this oscillator for high-probability confirmation.
* Wait for the histogram bars to fade (exhaustion) before pulling the trigger.
---

ichimoku complex value Signal [Levels 1-3]This is a signal indicator utilizing composite values of the Ichimoku kinko hyo
The signal is generated when it reaches the period of ichimoku kinko hyo I set.
Lv1: Low reliability. Recommended for scalping.
Lv2: Higher reliability than Level 1, but unsuitable for holding positions for a long duration.
Lv3: High reliability. Suitable for holding positions for a long duration.
Important Note: Do not set your stop-loss too tight. You may get stopped out during a retest or a fakeout movement.
EURUSD, USDJPY, and other Forex pairs: 4-Hour (4H)
BTCUSD, ETHUSD, and other Crypto assets: 1-Hour (1H)
XAUUSD (GOLD): 5-Minute (5m)
NQ1!: 4-Hour (4H)

Hybrid Flow Master📊 Hybrid Flow Master - Professional Trading Indicator
Overview
Hybrid Flow Master is an advanced all-in-one trading indicator that combines Smart Money Concepts, institutional order flow analysis, and multi-timeframe confluence scoring to identify high-probability trade setups. Designed for both scalpers and swing traders across all markets (Forex, Crypto, Stocks, Indices).
🎯 Key Features
1. Intelligent Confluence System (0-100% Scoring) Proprietary scoring algorithm that weighs multiple factors Only signals when minimum confidence threshold is met
Real-time probability calculations for each setup Signal quality grading: A+, A, B, C ratings
2. Smart Money Concepts (SMC)
Automatic Order Block detection (bullish/bearish) Fair Value Gap (FVG) identification
Market structure analysis (Higher Highs, Lower Lows) Swing high/low tracking with visual markers
3. Multi-Timeframe Analysis
Higher timeframe trend filter for confluence Customizable HTF periods (1H, 4H, Daily, etc.)
Prevents counter-trend trades Aligns entries with major trends
4. Volume Flow Analysis
Volume spike detection with customizable thresholds Volume delta calculations (buying vs selling pressure) Institutional footprint identification Background highlighting for high-volume bars
5. Advanced Risk Management
ATR-based stop loss calculation Automatic take profit levels Customizable risk/reward ratios (1:1, 1:2, 1:3+) Visual SL/TP lines on chart Position sizing guidance
6. Professional Dashboard
Real-time HUD displaying:
Market bias (Bullish/Bearish/Neutral)
Higher timeframe trend status
Current confluence percentage
Volume status (Normal/High)
RSI reading with color coding
ATR volatility measure
Signal quality grade
7. Smart Alert System
Bullish confluence signals
Bearish confluence signals
Volume spike notifications
Customizable alert messages
Works with mobile app notifications
📈 What Makes It Unique?
✅ No Repainting - All signals are confirmed and final
✅ Probability-Based - Shows confidence level, not just binary signals
✅ Multi-Factor Confluence - Combines structure, volume, momentum, and HTF analysis
✅ Clean Interface - Toggle individual components on/off
✅ Works on All Timeframes - From 1-minute scalping to daily swing trading
✅ Universal Markets - Forex, Crypto, Stocks, Indices, Commodities
🎨 Customization Options
Adjustable swing detection length
Volume threshold settings
Minimum confluence score filter
Custom color schemes
Dashboard position (4 corners)
Show/hide individual components
Risk/reward ratio adjustment
ATR multiplier for stops
📊 Best Used For:
✔️ Scalping (1m - 15m charts)
✔️ Day Trading (15m - 1H charts)
✔️ Swing Trading (4H - Daily charts)
✔️ Trend Following
✔️ Reversal Trading
✔️ Breakout Trading
💡 How to Use:
Add indicator to chart - Works immediately with default settings Set your timeframe - Choose your trading style Wait for signals - Green BUY or Red SELL labels with confidence %
Check confluence score - Higher % = better quality setup Review dashboard - Confirm market bias and HTF trend Manage risk - Use provided SL/TP levels or adjust to your preference
Set alerts - Get notified of high-probability setups
⚙️ Recommended Settings:
For Scalping (1m-5m):
Swing Length: 5-7
Min Confluence: 70%
HTF: 15m or 1H
For Day Trading (15m-1H):
Swing Length: 10-15
Min Confluence: 60%
HTF: 4H or Daily
For Swing Trading (4H-Daily):
Swing Length: 15-20
Min Confluence: 50-60%
HTF: Weekly
📚 Indicator Components:
✦ Market Structure Detection
✦ Order Block Identification
✦ Fair Value Gaps (FVG)
✦ Volume Analysis
✦ RSI (14)
✦ MACD (12, 26, 9)
✦ ATR (14)
✦ Multi-Timeframe Trend
✦ Confluence Scoring Algorithm
🚀 Performance Notes:
Optimized for speed and efficiency Minimal CPU usage Clean chart presentation
Limited drawing objects (no chart clutter) Works on all TradingView plans
⚠️ Important Notes:
This indicator is a tool to assist trading decisions, not financial advice Always use proper risk management (1-2% per trade recommended) Backtest on your preferred market and timeframe
Combine with your own analysis and strategy Past performance does not guarantee future results
🔔 Alert Setup:
Right-click indicator name → "Add Alert" → Choose:
"Bullish Confluence Signal" for buy setups
"Bearish Confluence Signal" for sell setups
"Volume Spike Alert" for unusual activity
💬 Support:
For questions, suggestions, or custom modifications, feel free to message me directly through TradingView.

Moving VWAP-KAMA CloudMoving VWAP-KAMA Cloud
Overview
The Moving VWAP-KAMA Cloud is a high-conviction trend filter designed to solve a major problem with standard indicators: Noise. By combining a smoothed Volume Weighted Average Price (MVWAP) with Kaufman’s Adaptive Moving Average (KAMA), this indicator creates a "Value Zone" that identifies the true structural trend while ignoring choppy price action.
Unlike brittle lines that break constantly, this cloud is "slow" by design—making it exceptionally powerful for spotting genuine trend reversals and filtering out fakeouts.
How It Works
This script uses a unique "Double Smoothing" architecture:
The Anchor (MVWAP): We take the standard VWAP and smooth it with a 30-period EMA. This represents the "Fair Value" baseline where volume has supported price over time.
The Filter (KAMA): We apply Kaufman's Adaptive Moving Average to the already smoothed MVWAP. KAMA is unique because it flattens out during low-volatility (choppy) periods and speeds up during high-momentum trends.
The Cloud:
Green/Teal Cloud: Bullish Structure (MVWAP > KAMA)
Purple Cloud: Bearish Structure (MVWAP < KAMA)
🔥 The "Reversal Slingshot" Strategy
Backtests reveal a powerful behavior during major trend changes, particularly after long bear markets:
The Resistance Phase: During a long-term downtrend, price will repeatedly rally into the Purple Cloud and get rejected. The flattened KAMA line acts as a "concrete ceiling," keeping the bearish trend intact.
The Breakout & Flip: When price finally breaks above the cloud with conviction, and the cloud flips Green, it signals a structural regime change.
The "Slingshot" Retest: Often, immediately after this flip, price will drop back into the top of the cloud. This is the "Slingshot" moment. The old resistance becomes new, hardened support.
The Rally: From this support bounce, stocks often launch into a sustained, multi-month bull run. This setup has been observed repeatedly at the bottom of major corrections.
How to Use This Indicator
1. Dynamic Support & Resistance
The KAMA Wall: When price retraces into the cloud, the KAMA line often flattens out, acting as a hard "floor" or "wall." A break of this wall usually signals a genuine trend change, not just a stop hunt.
2. Trend Confirmation (Regime Filter)
Bullish Regime: If price is holding above the cloud, only look for Long setups.
Bearish Regime: If price is holding below the cloud, only look for Short setups.
No-Trade Zone: If price is stuck inside the cloud, the market is traversing fair value. Stand aside until a clear winner emerges.
3. Multi-Timeframe Versatility
While designed for trend confirmation on higher timeframes (4H, Daily), this indicator adapts beautifully to lower timeframes (5m, 15m) for intraday scalping.
On Lower Timeframes: The cloud reacts much faster, acting as a dynamic "VWAP Band" that helps intraday traders stay on the right side of momentum during the session.
Settings
Moving VWAP Period (30): The lookback period for the base VWAP smoothing.
KAMA Settings (10, 10, 30): Controls the sensitivity of the adaptive filter.
Cloud Transparency: Adjust to keep your chart clean.
Alerts Included
Price Cross Over/Under MVWAP
Price Cross Over/Under KAMA
Cloud Flip (Bullish/Bearish Trend Change)
Tip for Traders
This is not a signal entry indicator. It is a Trend Conviction tool. Use it to filter your entries from faster indicators (like RSI or MACD). If your fast indicator signals "Buy" but the cloud is Purple, the probability is low. Wait for the Cloud Flip

KLS Ultimate V.1"KLS Ultimate V.1" is a meticulously designed trading indicator. It is built specifically for "Scalpers" (traders who want quick in-and-out profits).
**🚀 How it Works: The 3-Level Logic**
This indicator doesn't just rely on one tool. It gathers several indicators to have a "meeting" and confirm everything before giving you a Buy or Sell signal.
**🎯 Level 1: Core Trend (The Gatekeepers)**
This is the first checkpoint. If the price doesn't pass this stage, no signal gets generated.
- EMA: Is the price standing above the trend line? (Uptrend needs to be above, Downtrend below).
- MACD: Checks momentum and looks at the Histogram to see if real buying/selling volume is coming in.
- ADX: Measures trend strength (it won’t trade in boring, sideways markets).
**🔥 Level 2: Momentum (Finding the Best Entry)**
The second checkpoint to find the perfect spot to jump in.
- RSI: Checks if the price is Oversold (too cheap) or Overbought (too expensive).
- Stochastic: Finds short-term reversal crossovers.
**⭐ Level 3: Signal Boosters (For Strict Mode)**
A special bonus stage for those who want high accuracy (enable this in settings).
- RSI Divergence: Spots conflicts between price and RSI (e.g., Price drops but RSI rises = ready to pump).
- Price Action: Checks for strong candlestick patterns that show a clear winner between buyers and sellers.
------------------------------------------------------------
**🎮 User Guide**
Once you add this code to TradingView, here is what you will see and how to use it:
**A. Entry Signals**
🟢 Green BUY Label: Pops up below the candle.
* Means: Uptrend + Momentum + All filters passed.
🔴 Red SELL Label: Pops up above the candle.
* Means: Downtrend + Selling pressure + All filters passed.
**B. TP/SL Lines (Profit & Loss)**
The system calculates these automatically—no need to measure manually!
- Blue Line: Entry point.
- Light Green (TP1, TP2): Short-term profit targets.
- Dark Green (TP3): Long-term profit target.
- Red Line (SL): Stop Loss point.
**C. Special Mode: Strict Filter**
- Normal (False): Uses only Level 1 + Level 2. You get more signals.
- Strict (True): Needs Level 1 + 2 + 3 to trigger. Fewer signals, but much higher accuracy.
------------------------------------------------------------
**🛠️ Settings & Customization**
Click the gear icon to tweak the settings as you like:
1. Show BUY/SELL Signals: Uncheck if you don't want to see the labels.
2. Use Strict Filter: Check this for high precision (but you'll wait longer for signals).
3. Point Size: **Very Important!** This defines the TP/SL distance.
- For Gold (XAUUSD): Use **0.01**.
- For Forex pairs: Try **0.0001**.
- *Tip: Adjust this number until the TP/SL lines look reasonable on your chart.*
4. TP/SL Points: Set your desired profit/loss distance (e.g., TP1 = 50 points).
------------------------------------------------------------
💡 **Pro Tips**
- Trading Time: This code is smart—it checks sessions (based on GMT+7/Thai Time). It only gives signals during active markets (Sydney, Tokyo, London, NY). It stays quiet during dead hours.
- Recommended Timeframe: Since it's for Scalping, it works best on **M5, M15, or M30**.
- Money Management: Even with SL lines, always calculate your Lot Size properly. Don't overtrade!
------------------------------------------------------------
"KLS Ultimate V.1" เป็นเครื่องมือช่วยเทรด (Indicator) ที่ออกแบบมาอย่างปราณีตและซับซ้อนพอสมควร โดยเน้นไปที่ "สาย Scalping" (เทรดสั้นทำกำไรเร็ว) โดยเฉพาะ
🚀 เจาะลึกการทำงาน: ระบบกรอง 3 ชั้น (The 3-Level Logic)
อินดิเคเตอร์ตัวนี้ไม่ได้ใช้แค่เครื่องมือเดียวตัดสินใจ แต่มันเอาอินดิเคเตอร์หลายตัวมา "คอนเฟิร์ม" กันก่อนจะบอกให้คุณ Buy หรือ Sell ครับ
🎯 Level 1: ตัวคุมเทรนด์หลัก (Core Indicators)
นี่คือด่านแรก ถ้าไม่ผ่านด่านนี้ จะไม่มีสัญญาณเกิดขึ้น
- EMA (เส้นค่าเฉลี่ย): เช็คว่าราคายืนเหนือเส้นเทรนด์ไหม? (ขาขึ้นต้องยืนเหนือ, ขาลงต้องอยู่ใต้)
- MACD (โมเมนตัม): ดูแรงส่งของกราฟ และดู Histogram ว่ามีแรงซื้อ/ขาย เข้ามาจริงไหม
- ADX: วัดความแข็งแรงของเทรนด์ (ถ้าตลาดไซด์เวย์น่าเบื่อๆ ADX ต่ำๆ มันจะไม่เทรด)
🔥 Level 2: จุดกลับตัว (Momentum Indicators) ด่านที่สอง หาจังหวะเข้าที่ได้เปรียบ
- RSI: ดูว่าราคาถูกเกินไป (Oversold) หรือแพงเกินไป (Overbought) หรือยัง
- Stochastic: หาจุดตัดเพื่อยืนยันจุดกลับตัวระยะสั้น
⭐ Level 3: ตัวบูสต์สัญญาณ (Boost Indicators - สำหรับโหมด Strict)
ด่านพิเศษ สำหรับคนที่ต้องการความชัวร์ระดับสูง (เปิดใช้ได้ในตั้งค่า)
- RSI Divergence: หาสัญญาณขัดแย้งระหว่างราคากับ RSI (เช่น ราคาลงแต่ RSI ยกขึ้น = เตรียมพุ่ง)
- Price Action: ดูรูปแบบแท่งเทียนว่ามีแรงซื้อ/ขาย ชนะขาดลอยหรือไม่
------------------------------------------------------------
🎮 คู่มือการใช้งาน (User Guide)
เมื่อคุณแปะโค้ดนี้ลงใน TradingView แล้ว สิ่งที่คุณจะเห็นและการใช้งานมีดังนี้ครับ:
A. สัญญาณเข้าออเดอร์ (Entry Signals)
🟢 ป้าย BUY (สีเขียว): จะโผล่ใต้แท่งเทียน
แปลว่า: เทรนด์เป็นขาขึ้น + โมเมนตัมมา + ผ่านเงื่อนไขกรองต่างๆ แล้ว
🔴 ป้าย SELL (สีแดง): จะโผล่เหนือแท่งเทียน
แปลว่า: เทรนด์เป็นขาลง + แรงขายมา + ผ่านเงื่อนไขกรองต่างๆ แล้ว
B. เส้นเป้าหมายกำไร/ขาดทุน (TP/SL Lines)
ระบบคำนวณให้อัตโนมัติ ไม่ต้องนั่งวัดเอง!
- เส้นสีน้ำเงิน: จุดเข้า (Entry)
- เส้นสีเขียวอ่อน (TP1, TP2): เป้าทำกำไรระยะใกล้
เส้นสีเขียวเข้ม (TP3): เป้าทำกำไรระยะไกล
เส้นสีแดง (SL): จุดยอมแพ้ (Stop Loss)
C. โหมดพิเศษ: Strict Filter (โหมดเข้มงวด)
- ค่าปกติ (False): ใช้แค่ Level 1 + Level 2 ก็เกิดสัญญาณแล้ว (สัญญาณเยอะหน่อย)
- ถ้าเปิดใช้ (True): ต้องผ่าน Level 1 + 2 + 3 ถึงจะเกิดสัญญาณ (สัญญาณน้อย แต่แม่นยำสูงมาก)
------------------------------------------------------------
🛠️ วิธีตั้งค่าและปรับแต่ง (Settings)
ในหน้าตั้งค่า (รูปเฟือง) คุณสามารถปรับจูนได้ตามใจชอบ:
1. Show BUY/SELL Signals: ติ๊กออกถ้าไม่อยากเห็นป้ายสัญญาณ
2. Use Strict Filter: ติ๊กถูกถ้าอยากได้สัญญาณแม่นๆ (แต่รอนานหน่อย)
3. Point Size: สำคัญมาก! ใช้กำหนดระยะ TP/SL
- ถ้าเทรดทอง (XAUUSD) ตั้งค่าพื้นฐาน 0.01 เท่านั้น
- ถ้าเทรดคู่เงิน (Forex) อาจจะปรับเป็น 0.0001
- แนะนำให้ลองปรับจนเส้น TP/SL บนกราฟดูสมเหตุสมผล
4. TP/SL Points: กำหนดระยะจุดกำไรขาดทุนที่ต้องการ (เช่น TP1 = 50 จุด)
------------------------------------------------------------
💡 คำแนะนำเพิ่มเติม (Tips)
- เวลาเทรด: โค้ดนี้ฉลาดมาก มันมีการเช็คเวลา (Session) ให้ด้วย โดยอิงเวลา GMT+7 (เวลาไทย) โดยจะเทรดเฉพาะช่วงที่มีตลาดหลักเปิด (Sydney, Tokyo, London, NY) ช่วงตลาดวายดึกๆ หรือเช้ามืดเงียบๆ มันจะไม่บอกสัญญาณ
- Timeframe ที่แนะนำ: เนื่องจากเขียนมาเพื่อ Scalping แนะนำให้ใช้กับ M5, M15 หรือ M30 จะเห็นผลดีที่สุดครับ
- การบริหารเงิน (MM): แม้ระบบจะมี SL ให้ แต่คุณควรคำนวณ Lot Size ให้เหมาะสม ไม่ควร Overtrade ครับ

Simple Line📌 Understanding the Basic Concept
The trend reverses only when the price moves up or down by a fixed filter size.
It ignores normal volatility and noise, recognizing a trend change only when price moves beyond a specified threshold.
Trend direction is visually intuitive through line colors (green: uptrend, red: downtrend).
⚙️ Explanation of Settings
Auto Brick Size: Automatically determines the brick/filter size.
Fixed Brick Size: Manually set the size (e.g., 15, 30, 50, 100, etc.).
Volatility Length: The lookback period used for calculations (default: 14).
📈 Example of Identifying Buy Timing
When the line changes from gray or red to green, it signals the start of an uptrend.
This indicates that the price has moved upward by more than the required threshold.
📉 Example of Identifying Sell Timing
When the line changes from green to red, it suggests a possible downtrend reversal.
At this point, consider closing long positions or evaluating short entries.
🧪 Recommended Use Cases
Use as a trend filter to enhance the accuracy of existing strategies.
Can be used alone as a clean directional indicator without complex oscillators.
Works synergistically with trend-following strategies, breakout strategies, and more.
🔒 Notes & Cautions
More suitable for medium- to long-term trend trading than for fast scalping.
If the brick size is too small, the indicator may react to noise.
Sensitivity varies greatly depending on the selected brick size, so backtesting is essential to determine optimal values.
❗ The Trend Simple Line focuses solely on direction—remove the noise and focus purely on the trend.
초대 전용 스크립트
이 스크립트에 대한 접근이 제한되어 있습니다. 사용자는 즐겨찾기에 추가할 수 있지만 사용하려면 사용자의 권한이 필요합니다. 연락처 정보를 포함하여 액세스 요청에 대한 명확한 지침을 제공해 주세요.
이 비공개 초대 전용 스크립트는 스크립트 모더레이터의 검토를 거치지 않았으며, 하우스 룰 준수 여부는 확인되지 않았습니다. 트레이딩뷰는 스크립트의 작동 방식을 충분히 이해하고 작성자를 완전히 신뢰하지 않는 이상, 해당 스크립트에 비용을 지불하거나 사용하는 것을 권장하지 않습니다. 커뮤니티 스크립트에서 무료 오픈소스 대안을 찾아보실 수도 있습니다.
작성자 지시 사항
.
c9indicator
면책사항
해당 정보와 게시물은 금융, 투자, 트레이딩 또는 기타 유형의 조언이나 권장 사항으로 간주되지 않으며, 트레이딩뷰에서 제공하거나 보증하는 것이 아닙니

Ultimate Market Structure + MTF Dashboard [FIXED]Ultimate Market Structure + MTF Dashboard — Indicator Description
🔶 Overview
Ultimate Market Structure + MTF Dashboard is a fully-automated Smart Money Concepts (SMC) market-structure indicator designed to give traders extremely clean and accurate structural mapping on any timeframe.
It intelligently detects:
External (Swing) Structure
Internal Structure
BOS / CHoCH (Break of Structure / Change of Character)
HH/HL/LH/LL swing labels
Strong/Weak Highs & Lows
Equal Highs (EQH) & Equal Lows (EQL)
Internal BOS/CHoCH (micro-structure)
Multi-Timeframe Structure Dashboard (D, H4, H1, M15, M5)
This indicator eliminates clutter, repaints nothing, and provides crystal-clear visual understanding of market direction.
🎯 What This Indicator Solves
Most structure indicators fail because they:
✔ spam BOS/CHoCH everywhere
✔ repaint pivots
✔ mix internal and external structure
✔ draw messy lines
✔ ignore confluence
✔ don’t show higher timeframe structure
This script solves all of that by using:
Gap-proof pivot detection
Strict internal/external structure separation
Proper BOS/CHoCH logic using previous break
“LastBreak memory” system (no double BOS on same leg)
ATR-filtered internal pivots
Candle-context confluence filter
User-controlled filters for BOS/CHoCH only
Everything is designed for clean, reliable structure.
🧠 How It Works (Logic Explained Clearly)
1️⃣ Swing Structure – External
Based on user-defined swing length (default: 50).
Detects major turning points and evaluates:
HH / HL → Bullish structure
LH / LL → Bearish structure
Once a swing high/low is confirmed, the indicator tracks:
Has price crossed that pivot?
If yes → BOS or CHoCH depending on previous break direction.
2️⃣ Internal Structure – Micro Trend
A second layer using small length pivots (default: 5).
Useful for:
Entries
Scalp-level reversals
Early CHoCH detection
Internal structure uses ATR distance from swing pivots to avoid overlap.
3️⃣ BOS / CHoCH Logic
The script uses a very strict rule:
If previous break direction was opposite → CHoCH
If previous break direction was same → BOS
This eliminates false CHoCH spam and improves trend clarity.
4️⃣ Strong & Weak High/Low Detection
Each time a BOS occurs:
In bearish trend → last swing high = Strong High
In bullish trend → last swing low = Strong Low
Opposite becomes Weak High/Weak Low
These are important Smart Money Concepts levels for:
Premium/discount zones
Liquidity targets
Stop hunts
5️⃣ Equal Highs & Equal Lows (EQH/EQL)
The script automatically identifies EQH/EQL using:
Percentage threshold
Confirmation bar count
Useful for:
Liquidity sweep setups
Inducement
Stop runs
6️⃣ Multi-Timeframe Dashboard
Displays Internal & External structure for:
D (Daily)
H4
H1
M15
M5
Each cell is color-coded:
🟢 Bullish
🔴 Bearish
⚪ Neutral
This gives you instant top-down analysis without switching charts.
📌 What You Can Use This Indicator For
✔ Trend Trading
Keep trades aligned with:
Higher timeframe external trend
Lower timeframe internal entries
For example:
Daily → Bullish
H1 → Bullish
M5 → CHoCH bullish
Entry → Pullback to strong low
✔ Scalping
Internal structure (i-BOS, i-CHoCH) gives:
Fast reversals
Micro CHoCH entries
High-frequency trend shifts
Works extremely well on 1M–5M.
✔ Smart Money Concepts Trading
This indicator gives every SMC component you need:
Liquidity (EQH/EQL)
Swing structure
Internal structure
BOS/CHoCH
Strong/Weak High/Low
Multi-TF context
Perfect for ICT/SMC trading style.
✔ Institutional Order Flow Mapping
Using strong/weak highs/lows and BOS, you can easily determine:
Where smart money targets your stops
Where displacement started
Where structure shifted
Where mitigation may occur
✔ High-Timeframe Confirmation
The dashboard prevents you from trading against:
Daily trend
H4 liquidity levels
H1 structure direction
📈 Who Is This Indicator For?
Beginners
Learn structure visually instead of guessing.
Advanced Traders
Combine structure with:
Liquidity sweeps
FVG
OB
Breaker blocks
Momentum shifts
Scalpers
Use internal BOS/CHoCH for sniper entries.
Swing Traders
Use swing BOS to hold trades for large R:R moves.
ICT / SMC Traders
Perfect for order-block & FVG models.
📌 Recommended Settings
Swing Structure
Length: 50–100
Best for BTC, FX, XAU
Internal Structure
Length: 3–7
Best for scalping
EQ Threshold
FX: 0.10% – 0.25%
Crypto: 0.35% – 0.5%
Confirm Method
Close = safer
Wick = aggressive (scalping)
🧩 Unique Features (Compared to Other Indicators)
✔ Advanced gap-proof pivot engine
✔ Proper historical vs. present structure mode
✔ ATR-filtered internal pivots
✔ Smart confluence filter (detect candle context)
✔ Chart remains clean & minimal
✔ Works on all timeframes including 1-second
✔ No repaint structure
✔ Optimised for high-volatility assets like XAUUSD
🔚 Final Notes
This indicator was engineered to give traders a complete structure toolkit with professional-grade accuracy normally found only in premium paid tools.
With:
Clean BOS/CHoCH
Perfect swing tracking
Full multi-TF dashboard
Smart liquidity detection
Strong/weak level mapping
You can analyse any market with clarity and confidence.

Carlos Money Printer (CMP 4.5)⭐ Carlos Money Printer (CMP 4.5) – Overview
Designed for precision day trading, swing filtering, and high-accuracy scalping.
Carlos Money Printer (CMP) 4.5 is a next-generation trading system engineered to identify high-probability trend expansions and disciplined exits using a multi-layer confirmation engine. CMP is built for traders who want clean visual signals, reduced noise, and a systematic approach that avoids emotional decision-making.
What CMP 4.5 Does
CMP analyzes market structure across multiple dimensions and automatically highlights:
🔥 1. High-Accuracy Entry Zones
CMP detects early-stage price expansions using a proprietary volatility engine (“BAM” signals) plus directional confirmation, giving traders visibility into explosive trend opportunities before most indicators react.
📈 2. Trend Direction & Strength
CMP reads trend behavior using a dynamic trend spine, allowing the system to clearly distinguish between pullbacks, trend continuation, and early reversal conditions.
🧠 3. Multi-Timeframe Confirmation
The built-in 6-timeframe dashboard shows whether higher-timeframes agree with the chart you're trading — giving you a fast snapshot of market alignment without flipping charts.
🎯 4. Sniper Entry System (Full/Moderate Modes)
CMP 4.5 offers two confluence-based entry models:
FULL Sniper Mode – highest confidence, strongest confluence
MOD Sniper Mode – more frequent entries with controlled risk
Both modes emphasize clean structure and avoid low-quality signals.
🚀 5. Intelligent Exit Engine (5m-Based)
CMP includes a hybrid exit model that combines:
Trend deceleration
Momentum reversal
Volatility exhaustion
Structural flip signals
This gives you objective, systematic exit points — no guessing, no chasing.
📊 6. Built-In Tools for Traders
ORB High/Low Zones (first 15 minutes)
ADR / ADT Daily Range Tracking
VWAP
Trend coloring
Clean chart-optimized visuals
Everything is integrated so you can trade from a single indicator.
🌟 Why Traders Like CMP
CMP is engineered to remove noise from the chart and show only the most useful information:
No clutter
No complicated settings
No lagging confirmation
No hype indicators
Just clean trend signals, controlled entries, and disciplined exits.
⚠️ Important Notice
CMP 4.5 is proprietary and licensed exclusively under the K&T Trust.
This is a private-use system intended for educational and non-commercial analysis.
Reproduction or redistribution of the source code is prohibited.
⚠️ Disclaimer
The Carlos Money Printer (CMP 4.5) indicator is a technical analysis tool designed for educational and informational purposes only. It does not constitute financial advice, investment advice, or trading recommendations. Like all trading indicators, CMP 4.5 cannot guarantee future performance, profitability, or accuracy. Markets involve risk, including the potential loss of capital.
By using CMP 4.5, the trader acknowledges and agrees that:
All trading decisions are made at their own risk,
Past performance does not guarantee future results,
CMP 4.5 is not a substitute for personal research or professional financial advice,
Neither the creator, K&T Trust, nor any affiliates are responsible for losses, damages, or outcomes resulting from its use.
CMP 4.5 is a tool — powerful, refined, and more advanced than many indicators — but it is not a promise, not a guarantee, and not liability-bearing.
Use it with proper risk management, discipline, and personal judgment.
Quant RSIQuant RSI MTF - Professional Multi-Timeframe RSI Analysis
A sophisticated RSI indicator built for serious traders who need more than basic overbought and oversold levels. This tool combines advanced filtering techniques with multi-timeframe analysis to give you a clearer picture of momentum across different time horizons.
What Makes This Different
Most RSI indicators use simple moving averages that lag behind price action. This version uses Laguerre filtering, which is a mathematical technique that reduces lag while maintaining smooth signals. The result is an RSI that responds faster to genuine momentum shifts without getting whipped around by noise.
The system monitors five different timeframes simultaneously, checking whether momentum is aligned or diverging across short-term, medium-term, and long-term perspectives. When all timeframes agree on direction, you have significantly higher probability setups. When they disagree, you know to be cautious.
Core Features
The indicator calculates three separate RSI values using different lookback periods - short, medium, and long term. Each one serves a specific purpose. The short-term catches quick reversals, the medium-term identifies swing trading opportunities, and the long-term keeps you aware of the bigger trend.
Dynamic threshold adjustment is built in based on ATR volatility measurements. During high volatility periods, the overbought and oversold levels automatically expand because extreme readings become more common. During low volatility, the thresholds tighten up. This prevents you from getting false signals just because market conditions changed.
Volume confirmation is integrated into every signal. The system analyzes volume delta to determine whether price movements are supported by actual buying or selling pressure. A divergence between RSI and volume often signals weak momentum that is likely to reverse.
Advanced divergence detection goes beyond basic hidden and regular divergences. The system calculates divergence strength as a percentage, so you know which setups have the most potential. A weak divergence barely worth noting gets scored low, while a major divergence with significant price-RSI separation scores high.
Signal Intelligence
Every potential signal gets assigned a confidence score from 0 to 100. This score factors in trend strength, momentum, volume confirmation, divergence presence, ADX readings, and timeframe alignment. A score above 70 means all the pieces are in place. Below 40 means something important is missing.
The indicator calculates ADX automatically to measure trend strength. Even if RSI shows oversold conditions, a weak ADX reading suggests the market is ranging and mean reversion might not work. Strong ADX with extreme RSI readings often produces the best setups.
Market condition classification tells you whether you are in a strong bull trend, bear trend, pullback, sideways chop, or volatility expansion phase. Each condition requires different trading approaches, and the indicator adapts its signals accordingly.
Volatility Analysis
Real-time volatility state monitoring shows you whether volatility is exploding, expanding, stable, or contracting. Contracting volatility often precedes big moves. Exploding volatility suggests you should reduce position size or stay out entirely.
The system compares current volatility to historical levels using percentile rankings. If current ATR is in the 90th percentile, you know volatility is unusually high even if you have not traded this asset before.
Volume profile approximation analyzes where volume is accumulating at different price levels. While not as detailed as true market profile software, it gives you insight into support and resistance zones based on actual trading activity.
What This Indicator Does Well
The Laguerre filtering genuinely reduces lag compared to standard RSI. You will notice signals forming 1-3 bars earlier than traditional RSI implementations, which can make a significant difference in fast-moving markets.
Multi-timeframe confluence is calculated automatically instead of forcing you to manually switch between charts. When all five timeframes align, the visual confirmation is immediate and the probability of success increases dramatically.
Dynamic threshold adjustment based on volatility is something most RSI indicators lack entirely. This prevents you from taking low-probability trades just because RSI hit 30 or 70 during unusual market conditions.
Volume integration with every signal helps filter out weak setups. RSI might show oversold, but if volume delta is negative and selling pressure continues, the indicator knows not to generate a buy signal.
Divergence strength calculation goes beyond just marking divergences with arrows. Knowing that a divergence has 75% strength versus 20% strength completely changes how you should trade it.
The ADX integration prevents you from trying to trade reversals in ranging markets where mean reversion strategies fail. ADX below 20 with extreme RSI readings typically results in continued chop rather than reversals.
What This Indicator Does Not Do Well
The multi-timeframe data requests can cause slight delays on lower-end computers or slow internet connections. If you are running multiple indicators simultaneously, you might notice brief calculation lags.
Divergence detection requires at least 10-15 bars of history to identify pivot points accurately. On brand new charts or immediately after timeframe changes, divergence signals may be absent for several bars.
The Laguerre filtering, while reducing lag, can occasionally produce false signals during extreme volatility spikes like news releases or market opens. The smoothing cannot completely eliminate noise during truly chaotic conditions.
Dynamic thresholds work well most of the time but can occasionally adapt too slowly during rapid volatility regime changes. If ATR suddenly doubles, it might take 5-10 bars for the thresholds to fully adjust.
The indicator uses significant processing power with five timeframe requests plus all the calculations for volatility, volume analysis, divergences, and signal scoring. On very low timeframes like 1-second or tick charts, this could cause performance issues.
There is no built-in backtesting functionality. You can see historical signals on the chart, but you cannot generate statistical performance reports without exporting data and analyzing it separately.
Best Use Cases
This indicator excels for scalpers and day traders who need fast, reliable RSI signals with proper context. The reduced lag from Laguerre filtering combined with volume confirmation catches reversals quickly enough to matter on 1-5 minute charts.
Swing traders benefit from the multi-timeframe alignment feature. Before entering a multi-day position, you can verify that momentum is aligned across your entry timeframe, swing timeframe, and position timeframe. This significantly improves win rates.
Range traders can use the dynamic thresholds and volatility analysis to identify when markets are coiling up for breakout moves. Contracting volatility with neutral RSI readings often precedes the best trending moves.
The divergence detection with strength calculations makes this valuable for reversal traders. Instead of taking every divergence, you can filter for only high-strength divergences above 60% for better risk-reward setups.
What This Is Not
This is not a standalone trading system. It provides momentum analysis and signal quality scoring, but you still need proper risk management, position sizing, and confluence with price action or other technical factors.
This is not a high-frequency trading tool. While the Laguerre filtering reduces lag, it is not designed for sub-second timeframes or algorithmic trading where microseconds matter.
This is not a volatility prediction system. It measures current and recent volatility states, but it cannot forecast whether volatility will expand or contract in the future beyond basic statistical tendencies.
This is not a replacement for understanding market structure. RSI divergences and extreme readings mean different things at major support and resistance versus in the middle of nowhere. You need context.
Technical Details Worth Knowing
The Laguerre filter uses a gamma parameter that you can adjust. Higher gamma values (0.8-0.9) produce smoother lines with more lag. Lower values (0.5-0.6) respond faster but with more noise. The default of 0.7 balances both reasonably well.
The three RSI lengths serve different purposes. The 5-period catches very short-term momentum for scalping. The 14-period is standard for swing trading. The 21-period keeps you aligned with longer-term trends. You can adjust these based on your trading timeframe.
ATR normalization divides current ATR by a 50-period moving average of ATR. This creates a volatility factor that adjusts thresholds dynamically. When volatility doubles, overbought might move from 70 to 85 automatically.
Volume delta is calculated as volume times the percentage where price closed within the bar's range. An up-close at the high gets full positive delta. A down-close at the low gets full negative delta. This approximates buying and selling pressure without tick data.
Signal strength scoring uses weighted factors. Trend direction gets 30% weight, momentum gets 20%, volume confirmation 15%, divergence presence 15%, ADX strength 10%, and timeframe alignment 10%. This creates a 0-100 composite score.
ADX calculation uses the standard Wilder smoothing method with directional movement indicators. The trend classification shows whether bulls or bears have control, while the strength rating (weak, moderate, strong, extreme) tells you how much conviction is behind the move.
Final Assessment
This is a well-designed RSI indicator that adds genuine value beyond what basic RSI provides. The Laguerre filtering works as advertised for lag reduction. The multi-timeframe analysis saves time and provides clarity. The dynamic thresholds adapt intelligently to changing volatility.
The signal scoring system is particularly useful because it prevents you from chasing low-quality setups. A 35% confidence score tells you immediately that something is wrong with the trade even if RSI looks tempting.
However, this is definitely not a beginner indicator. There are a lot of moving parts and the learning curve is real. You need to understand RSI basics, divergences, volume analysis, and volatility regimes to use this effectively. Someone new to trading would be overwhelmed.
For experienced traders who already understand momentum indicators and want more sophisticated analysis, this is legitimately valuable. The combination of features is not commonly found in free indicators, and the implementation quality is solid.
The main limitation is that it is still just an RSI indicator at its core. No amount of filtering, multi-timeframe analysis, or scoring can overcome the fundamental limitations of oscillator-based trading. You need confluence with price action, support and resistance, and proper market context.
If you trade primarily based on momentum and reversals, this indicator provides most of what you would need in one package. If you are a pure price action trader or trend follower, this probably would not change your approach significantly.
Overall, this is a 7.5 out of 10 indicator. It does what it claims to do well, adds meaningful improvements over basic RSI, and provides useful analysis tools. It is not revolutionary, but it is a solid professional-grade tool for the right type of trader.

Nexural JMAHere's a natural description for TradingView:
Nexural JMA - Jurik Moving Average with Multi-Factor Analysis
WHAT IT DOES
This is a Jurik Moving Average indicator that I've enhanced with multi-factor scoring to help you identify high-quality trade setups. JMA is known for being smoother and more responsive than traditional moving averages, which means less lag without the whipsaw you get from faster EMAs.
The indicator plots the JMA line on your chart with dynamic support and resistance zones, entry signals, and a real-time dashboard that scores market conditions from 0 to 100 across five key factors.
KEY FEATURES
Jurik Moving Average - A sophisticated moving average that adapts quickly to price changes while staying smooth. You can adjust the phase and power settings to control its responsiveness.
Dynamic Zones - Creates a cloud around the JMA based on ATR. Think of it as a buffer zone that shows where price typically bounces or breaks through.
Multi-Factor Scoring - Real-time scores for Momentum, Volume, Volatility, and Trend Strength. All metrics are normalized to 0-100 so you can quickly see what's strong and what's weak.
Strength-Based Gradient - The JMA line and cloud change opacity based on trend strength. Bright and solid means strong conviction, faded means weak or transitional.
Filtered Signals - Entry signals only appear when multiple factors align - price crosses the JMA, volume confirms, and trend strength is adequate.
HOW TO USE IT
The JMA Line - This is your trend filter. When the line is green and rising, look for long opportunities. When it's red and falling, look for shorts. The brighter the color, the stronger the trend.
The Cloud - Price typically bounces off the cloud edges in trends. When price breaks through the cloud against the trend, it often signals exhaustion or reversal.
Entry Signals - Green triangles below price are long signals. Red triangles above price are short signals. These only fire when volume, momentum, and trend strength are adequate.
The Dashboard - This is your market health monitor. Check it before taking a trade. You want to see high scores (70+) in momentum and trend strength for the best setups. Volume above 50 adds confirmation.
Volatility Score - High volatility (70+) means wider stops and bigger targets. Low volatility (below 30) means tighter ranges and smaller moves.
BEST PRACTICES
Use the dashboard to filter trades. If trend strength is below 40, the market is choppy and you're better off waiting for clarity.
Pay attention to the gradient intensity. A bright solid JMA line with a visible cloud means the trend has conviction. A faded line means the trend is weak or transitioning.
Volume matters. Signals with volume scores above 70 tend to have better follow-through than those with weak volume.
Don't force trades when momentum is low. Below 40 momentum score means the market is consolidating or drifting.
Use the cloud as a stop loss guide in trends. Price reclaiming the cloud against the trend is often your signal to exit or tighten stops.
UNDERSTANDING THE SCORES
Momentum Score - Measures the rate of change over 10 bars compared to recent history. High scores mean price is moving decisively.
Volume Score - Compares current volume to the last 100 bars. Above 70 means volume is strong, below 30 means it's weak.
Volatility Score - Based on ATR percentile. High scores mean the market is moving with larger swings, low scores mean it's quiet.
Trend Strength - Combines how far price is from the JMA plus the slope of the JMA itself. This is your conviction meter.
SETTINGS BREAKDOWN
JMA Length - Default is 7, which is quite responsive. Increase to 14 or 21 for smoother trends on higher timeframes. Lower to 5 for faster response on scalping timeframes.
Phase - Default is 50 which is balanced. Higher values (70-100) make it more responsive but can increase whipsaws. Lower values (0-30) make it smoother but add lag.
Power - Controls the JMA curve calculation. Default is 2 which works well. Higher values make it more responsive at the cost of smoothness.
Source - Default is close, but you can experiment with hlc3 or ohlc4 for different characteristics.
PROS
Clean visual presentation - The gradient system makes trend strength obvious at a glance.
No guesswork on market conditions - The scored dashboard tells you exactly what's working and what's not.
Filtered signals - Unlike basic moving average crosses, these signals require multiple confirmations.
Adaptable - Works on stocks, crypto, forex, and futures. Just adjust the length for your timeframe.
Low lag - JMA responds faster than SMA or EMA of the same length, so you get earlier entries.
CONS
JMA can be sensitive - On the default settings, you might see some false signals in choppy markets. Consider increasing the length if this happens.
Requires interpretation - The dashboard gives you data, but you still need to make the trading decision. It's not a one-click solution.
Works best in trends - Like most moving average systems, it struggles in tight sideways ranges. Low trend strength scores will warn you when this is happening.
Not ideal for very fast scalping - The default length of 7 works for 5-minute and above, but for 1-minute scalping, you might need to drop it to 3-5 and accept more noise.
Volume data quality matters - On some assets or timeframes, volume data is unreliable or unavailable. The volume score will be less useful in those cases.
TIPS FROM MY TESTING
The indicator works best on the 5-minute to daily timeframes. I've had the most success on 15-minute and 1-hour charts.
When all scores are above 60, you're in prime trading conditions. These are your A+ setups.
Use it with support and resistance. When a signal fires at a key level with high trend strength, the probability increases significantly.
The cloud is your friend in trends. In strong trends, price will use the cloud edges as support or resistance for continuation entries.
Don't ignore weak signals in strong trends. Sometimes a low momentum score during a pullback in a strong trend is your best re-entry point.
Watch for divergence between price and the JMA. If price makes a new high but the JMA is fading in color and trend strength is dropping, that's often a warning sign.
ALERT SYSTEM
The alerts include the trend strength score in the message, so you know immediately if it's a high-conviction signal or a marginal one. Set your alerts to "once per bar close" to avoid repainting.
COMBINING WITH OTHER TOOLS
This works great with RSI or stochastic for timing entries. Use the JMA for trend direction and zones for context, then use an oscillator to time the exact entry.
It pairs well with volume profile. The JMA shows you the trend, volume profile shows you where the battle is happening.
Consider using a higher timeframe JMA for bias and a lower timeframe for entries. If the 1-hour JMA is bullish with 80 trend strength, look for long entries on the 15-minute chart.
This indicator is designed to give you clarity in a noisy market. The JMA itself is a powerful tool, but adding the multi-factor scoring system helps you understand the quality of what you're seeing. It's not magic, but it's been helpful for filtering out the junk and focusing on the setups with the best probability.
As always, backtest it on your markets and timeframes. Adjust the settings to fit your trading style. What works for one person might not work for another, so make it your own.
Good luck and trade safe.

Systemic Net Liquidity (Macro Fuel for Crypto & Stocks)This indicator tracks Systemic Net Liquidity, the single most important macro factor for determining the long-term trend of risk assets like Bitcoin (BTC) and major indices (S&P 500). It measures the amount of actual cash available in the financial system to chase speculative assets, distinguishing between money that is circulating and money that is locked up at the Federal Reserve.
Mechanism (What It Measures)
The script uses direct data from the FRED (Federal Reserve Economic Data) to calculate the true state of market funding:
\text{Net Liquidity} = \text{Fed Assets (WALCL)} - \text{Treasury General Account (TGA)} - \text{Reverse Repo (RRP)}
1. Fed Assets (WALCL): The total balance sheet of the Fed (The overall supply of money).
2. Treasury General Account (TGA): Funds the US Treasury collects via bond issuance. When the TGA rises, liquidity is actively drained from the banking system (A major bearish pressure).
3. Overnight Reverse Repo (RRP): Cash parked by banks and money market funds at the Fed, effectively frozen and not contributing to market activity.
How to Interpret Signals
Treat the Net Liquidity line as the market's "Fuel Gauge":
📈 BULLISH SIGNAL (Liquidity Injection): When the Net Liquidity line is rising, money is flowing back into the system, signalling a tailwind for risk assets.
📉 BEARISH SIGNAL (Liquidity Drain): When the line is falling (often due to high TGA balances), cash is being removed. This signals major friction and pressure on price action.
⚠️ DIVERGENCE WARNING: A strong signal is generated when Price (e.g., BTC) rises, but Net Liquidity falls. This macro divergence strongly suggests a major trend reversal or correction is imminent.
Important Notes
Data Source: Data is directly sourced from FRED and updates daily/weekly. This tool is best used for macro analysis and identifying high-level cycles, not short-term scalping.
Disclaimer: Use this indicator as a confirmation tool within your broader strategy. It is not a standalone trading signal.

Mars Signals - Ultimate Institutional Suite v3.0(Joker)Comprehensive Trading Manual
Mars Signals – Ultimate Institutional Suite v3.0 (Joker)
## Chapter 1 – Philosophy & System Architecture
This script is not a simple “buy/sell” indicator.
Mars Signals – UIS v3.0 (Joker) is designed as an institutional-style analytical assistant that layers several methodologies into a single, coherent framework.
The system is built on four core pillars:
1. Smart Money Concepts (SMC)
- Detection of Order Blocks (professional demand/supply zones).
- Detection of Fair Value Gaps (FVGs) (price imbalances).
2. Smart DCA Strategy
- Combination of RSI and Bollinger Bands
- Identifies statistically discounted zones for scaling into spot positions or exiting shorts.
3. Volume Profile (Visible Range Simulation)
- Distribution of volume by price, not by time.
- Identification of POC (Point of Control) and high-/low-volume areas.
4. Wyckoff Helper – Spring
- Detection of bear traps, liquidity grabs, and sharp bullish reversals.
All four pillars feed into a Confluence Engine (Scoring System).
The final output is presented in the Dashboard, with a clear, human-readable signal:
- STRONG LONG 🚀
- WEAK LONG ↗
- NEUTRAL / WAIT
- WEAK SHORT ↘
- STRONG SHORT 🩸
This allows the trader to see *how many* and *which* layers of the system support a bullish or bearish bias at any given time.
## Chapter 2 – Settings Overview
### 2.1 General & Dashboard Group
- Show Dashboard Panel (`show_dash`)
Turns the dashboard table in the corner of the chart ON/OFF.
- Show Signal Recommendation (`show_rec`)
- If enabled, the textual signal (STRONG LONG, WEAK SHORT, etc.) is displayed.
- If disabled, you only see feature status (ON/OFF) and the current price.
- Dashboard Position (`dash_pos`)
Determines where the dashboard appears on the chart:
- `Top Right`
- `Bottom Right`
- `Top Left`
### 2.2 Smart Money (SMC) Group
- Enable SMC Strategy (`show_smc`)
Globally enables or disables the Order Block and FVG logic.
- Order Block Pivot Lookback (`ob_period`)
Main parameter for detecting key pivot highs/lows (swing points).
- Default value: 5
- Concept:
A bar is considered a pivot low if its low is lower than the lows of the previous 5 and the next 5 bars.
Similarly, a pivot high has a high higher than the previous 5 and the next 5 bars.
These pivots are used as anchors for Order Blocks.
- Increasing `ob_period`:
- Fewer levels.
- But levels tend to be more significant and reliable.
- In highly volatile markets (major news, war events, FOMC, etc.),
using values 7–10 is recommended to filter out weak levels.
- Show Fair Value Gaps (`show_fvg`)
Enables/disables the drawing of FVG zones (imbalances).
- Bullish OB Color (`c_ob_bull`)
- Color of Bullish Order Blocks (Demand Zones).
- Default: semi-transparent green (transparency ≈ 80).
- Bearish OB Color (`c_ob_bear`)
- Color of Bearish Order Blocks (Supply Zones).
- Default: semi-transparent red.
- Bullish FVG Color (`c_fvg_bull`)
- Color of Bullish FVG (upward imbalance), typically yellow.
- Bearish FVG Color (`c_fvg_bear`)
- Color of Bearish FVG (downward imbalance), typically purple.
### 2.3 Smart DCA Strategy Group
- Enable DCA Zones (`show_dca`)
Enables the Smart DCA logic and visual labels.
- RSI Length (`rsi_len`)
Lookback period for RSI (default: 14).
- Shorter → more sensitive, more noise.
- Longer → fewer signals, higher reliability.
- Bollinger Bands Length (`bb_len`)
Moving average period for Bollinger Bands (default: 20).
- BB Multiplier (`bb_mult`)
Standard deviation multiplier for Bollinger Bands (default: 2.0).
- For extremely volatile markets, values like 2.5–3.0 can be used so that only extreme deviations trigger a DCA signal.
### 2.4 Volume Profile (Visible Range Sim) Group
- Show Volume Profile (`show_vp`)
Enables the simulated Volume Profile bars on the right side of the chart.
- Volume Lookback Bars (`vp_lookback`)
Number of bars used to compute the Volume Profile (default: 150).
- Higher values → broader historical context, heavier computation.
- Row Count (`vp_rows`)
Number of vertical price segments (rows) to divide the total price range into (default: 30).
- Width (%) (`vp_width`)
Relative width of each volume bar as a percentage.
In the code, bar widths are scaled relative to the row with the maximum volume.
> Technical note: Volume Profile calculations are executed only on the last bar (`barstate.islast`) to keep the script performant even on higher timeframes.
### 2.5 Wyckoff Helper Group
- Show Wyckoff Events (`show_wyc`)
Enables detection and plotting of Wyckoff Spring events.
- Volume MA Length (`vol_ma_len`)
Length of the moving average on volume.
A bar is considered to have Ultra Volume if its volume is more than 2× the volume MA.
## Chapter 3 – Smart Money Strategy (Order Blocks & FVG)
### 3.1 What Is an Order Block?
An Order Block (OB) represents the footprint of large institutional orders:
- Bullish Order Block (Demand Zone)
The last selling region (bearish candle/cluster) before a strong upward move.
- Bearish Order Block (Supply Zone)
The last buying region (bullish candle/cluster) before a strong downward move.
Institutions and large players place heavy orders in these regions. Typical price behavior:
- Price moves away from the zone.
- Later returns to the same zone to fill unfilled orders.
- Then continues the larger trend.
In the script:
- If `pl` (pivot low) forms → a Bullish OB is created.
- If `ph` (pivot high) forms → a Bearish OB is created.
The box is drawn:
- From `bar_index ` to `bar_index`.
- Between `low ` and `high `.
- `extend=extend.right` extends the OB into the future, so it acts as a dynamic support/resistance zone.
- Only the last 4 OB boxes are kept to avoid clutter.
### 3.2 Order Block Color Guide
- Semi-transparent Green (`c_ob_bull`)
- Represents a Bullish Order Block (Demand Zone).
- Interpretation: a price region with a high probability of bullish reaction.
- Semi-transparent Red (`c_ob_bear`)
- Represents a Bearish Order Block (Supply Zone).
- Interpretation: a price region with a high probability of bearish reaction.
Overlap (Multiple OBs in the Same Area)
When two or more Order Blocks overlap:
- The shared area appears visually denser/stronger.
- This suggests higher order density.
- Such zones can be treated as high-priority levels for entries, exits, and stop-loss placement.
### 3.3 Demand/Supply Logic in the Scoring Engine
is_in_demand = low <= ta.lowest(low, 20)
is_in_supply = high >= ta.highest(high, 20)
- If current price is near the lowest lows of the last 20 bars, it is considered in a Demand Zone → positive impact on score.
- If current price is near the highest highs of the last 20 bars, it is considered in a Supply Zone → negative impact on score.
This logic complements Order Blocks and helps the Dashboard distinguish whether:
- Market is currently in a statistically cheap (long-friendly) area, or
- In a statistically expensive (short-friendly) area.
### 3.4 Fair Value Gaps (FVG)
#### Concept
When the market moves aggressively:
- Some price levels are skipped and never traded.
- A gap between wicks/shadows of consecutive candles appears.
- These regions are called Fair Value Gaps (FVGs) or Imbalances.
The market generally “dislikes” imbalance and often:
- Returns to these zones in the future.
- Fills the gap (rebalance).
- Then resumes its dominant direction.
#### Implementation in the Code
Bullish FVG (Yellow)
fvg_bull_cond = show_smc and show_fvg and low > high and close > high
if fvg_bull_cond
box.new(bar_index , high , bar_index, low, ...)
Core condition:
`low > high ` → the current low is above the high of two bars ago; the space between them is an untraded gap.
Bearish FVG (Purple)
fvg_bear_cond = show_smc and show_fvg and high < low and close < low
if fvg_bear_cond
box.new(bar_index , low , bar_index, high, ...)
Core condition:
`high < low ` → the current high is below the low of two bars ago; again a price gap exists.
#### FVG Color Guide
- Transparent Yellow (`c_fvg_bull`) – Bullish FVG
Often acts like a magnet for price:
- Price tends to retrace into this zone,
- Fill the imbalance,
- And then continue higher.
- Transparent Purple (`c_fvg_bear`) – Bearish FVG
Price tends to:
- Retrace upward into the purple area,
- Fill the imbalance,
- And then resume downward movement.
#### Trading with FVGs
- FVGs are *not* standalone entry signals.
They are best used as:
- Targets (take-profit zones), or
- Reaction areas where you expect a pause or reversal.
Examples:
- If you are long, a bearish FVG above is often an excellent take-profit zone.
- If you are short, a bullish FVG below is often a good cover/exit zone.
### 3.5 Core SMC Trading Templates
#### Reversal Long
1. Price trades down into a green Order Block (Demand Zone).
2. A bullish confirmation candle (Close > Open) forms inside or just above the OB.
3. If this zone is close to or aligned with a bullish FVG (yellow), the signal is reinforced.
4. Entry:
- At the close of the confirmation candle, or
- Using a limit order near the upper boundary of the OB.
5. Stop-loss:
- Slightly below the OB.
- If the OB is broken decisively and price consolidates below it, the zone loses validity.
6. Targets:
- The next FVG,
- Or the next red Order Block (Supply Zone) above.
#### Reversal Short
The mirror scenario:
- Price rallies into a red Order Block (Supply).
- A bearish confirmation candle forms (Close < Open).
- FVG/premium structure above can act as a confluence.
- Stop-loss goes above the OB.
- Targets: lower FVGs or subsequent green OBs below.
## Chapter 4 – Smart DCA Strategy (RSI + Bollinger Bands)
### 4.1 Smart DCA Concept
- Classic DCA = buying at fixed time intervals regardless of price.
- Smart DCA = scaling in only when:
- Price is statistically cheaper than usual, and
- The market is in a clear oversold condition.
Code logic:
rsi_val = ta.rsi(close, rsi_len)
= ta.bb(close, bb_len, bb_mult)
dca_buy = show_dca and rsi_val < 30 and close < bb_lower
dca_sell = show_dca and rsi_val > 70 and close > bb_upper
Conditions:
- DCA Buy – Smart Scale-In Zone
- RSI < 30 → oversold.
- Close < lower Bollinger Band → price has broken below its typical volatility envelope.
- DCA Sell – Overbought/Distribution Zone
- RSI > 70 → overbought.
- Close > upper Bollinger Band → price is extended far above the mean.
### 4.2 Visual Representation on the Chart
- Green “DCA” Label Below Candle
- Shape: `labelup`.
- Color: lime background, white text.
- Meaning: statistically attractive level for laddered spot entries or short exits.
- Red “SELL” Label Above Candle
- Warning that the market is in an extended, overbought condition.
- Suitable for profit-taking on longs or considering short entries (with proper confluence and risk management).
- Light Green Background (`bgcolor`)
- When `dca_buy` is true, the candle background turns very light green (high transparency).
- This helps visually identify DCA Zones across the chart at a glance.
### 4.3 Practical Use in Trading
#### Spot Trading
Used to build a better average entry price:
- Every time a DCA label appears, allocate a fixed portion of capital (e.g., 2–5%).
- Combining DCA signals with:
- Green OBs (Demand Zones), and/or
- The Volume Profile POC
makes the zone structurally more important.
#### Futures Trading
- Longs
- Use DCA Buy signals as low-risk zones for opening or adding to longs when:
- Price is inside a green OB, or
- The Dashboard already leans LONG.
- Shorts
- Use DCA Sell signals as:
- Exit zones for longs, or
- Areas to initiate shorts with stops above structural highs.
## Chapter 5 – Volume Profile (Visible Range Simulation)
### 5.1 Concept
Traditional volume (histogram under the chart) shows volume over time.
Volume Profile shows volume by price level:
- At which prices has the highest trading activity occurred?
- Where did buyers and sellers agree the most (High Volume Nodes – HVNs)?
- Where did price move quickly due to low participation (Low Volume Nodes – LVNs)?
### 5.2 Implementation in the Script
Executed only when `show_vp` is enabled and on the last bar:
1. The last `vp_lookback` bars (default 150) are processed.
2. The minimum low and maximum high over this window define the price range.
3. This price range is divided into `vp_rows` segments (e.g., 30 rows).
4. For each row:
- All bars are scanned.
- If the mid-price `(high + low ) / 2` falls inside a row, that bar’s volume is added to the row total.
5. The row with the greatest volume is stored as `max_vol_idx` (the POC row).
6. For each row, a volume box is drawn on the right side of the chart.
### 5.3 Color Scheme
- Semi-transparent Orange
- The row with the maximum volume – the Point of Control (POC).
- Represents the strongest support/resistance level from a volume perspective.
- Semi-transparent Blue
- Other volume rows.
- The taller the bar → the higher the volume → the stronger the interest at that price band.
### 5.4 Trading Applications
- If price is above POC and retraces back into it:
→ POC often acts as support, suitable for long setups.
- If price is below POC and rallies into it:
→ POC often acts as resistance, suitable for short setups or profit-taking.
HVNs (Tall Blue Bars)
- Represent areas of equilibrium where the market has spent time and traded heavily.
- Price tends to consolidate here before choosing a direction.
LVNs (Short or Nearly Empty Bars)
- Represent low participation zones.
- Price often moves quickly through these areas – useful for targeting fast moves.
## Chapter 6 – Wyckoff Helper – Spring
### 6.1 Spring Concept
In the Wyckoff framework:
- A Spring is a false break of support.
- The market briefly trades below a well-defined support level, triggers stop losses,
then sharply reverses upward as institutional buyers absorb liquidity.
This movement:
- Clears out weak hands (retail sellers).
- Provides large players with liquidity to enter long positions.
- Often initiates a new uptrend.
### 6.2 Code Logic
Conditions for a Spring:
1. The current low is lower than the lowest low of the previous 50 bars
→ apparent break of a long-standing support.
2. The bar closes bullish (Close > Open)
→ the breakdown was rejected.
3. Volume is significantly elevated:
→ `volume > 2 × volume_MA` (Ultra Volume).
When all conditions are met and `show_wyc` is enabled:
- A pink diamond is plotted below the bar,
- With the label “Spring” – one of the strongest long signals in this system.
### 6.3 Trading Use
- After a valid Spring, markets frequently enter a meaningful bullish phase.
- The highest quality setups occur when:
- The Spring forms inside a green Order Block, and
- Near or on the Volume Profile POC.
Entries:
- At the close of the Spring bar, or
- On the first pullback into the mid-range of the Spring candle.
Stop-loss:
- Slightly below the Spring’s lowest point (wick low plus a small buffer).
## Chapter 7 – Confluence Engine & Dashboard
### 7.1 Scoring Logic
For each bar, the script:
1. Resets `score` to 0.
2. Adjusts the score based on different signals.
SMC Contribution
if show_smc
if is_in_demand
score += 1
if is_in_supply
score -= 1
- Being in Demand → `+1`
- Being in Supply → `-1`
DCA Contribution
if show_dca
if dca_buy
score += 2
if dca_sell
score -= 2
- DCA Buy → `+2` (strong, statistically driven long signal)
- DCA Sell → `-2`
Wyckoff Spring Contribution
if show_wyc
if wyc_spring
score += 2
- Spring → `+2` (entry of strong money)
### 7.2 Mapping Score to Dashboard Signal
- score ≥ 2 → STRONG LONG 🚀
Multiple bullish conditions aligned.
- score = 1 → WEAK LONG ↗
Some bullish bias, but only one layer clearly positive.
- score = 0 → NEUTRAL / WAIT
Rough balance between buying and selling forces; staying flat is usually preferable.
- score = -1 → WEAK SHORT ↘
Mild bearish bias, suited for cautious or short-term plays.
- score ≤ -2 → STRONG SHORT 🩸
Convergence of several bearish signals.
### 7.3 Dashboard Structure
The dashboard is a two-column table:
- Row 0
- Column 0: `"Mars Signals"` – black background, white text.
- Column 1: `"UIS v3.0"` – black background, yellow text.
- Row 1
- Column 0: `"Price:"` (light grey background).
- Column 1: current closing price (`close`) with a semi-transparent blue background.
- Row 2
- Column 0: `"SMC:"`
- Column 1:
- `"ON"` (green) if `show_smc = true`
- `"OFF"` (grey) otherwise.
- Row 3
- Column 0: `"DCA:"`
- Column 1:
- `"ON"` (green) if `show_dca = true`
- `"OFF"` (grey) otherwise.
- Row 4
- Column 0: `"Signal:"`
- Column 1: signal text (`status_txt`) with background color `status_col`
(green, red, teal, maroon, etc.)
- If `show_rec = false`, these cells are cleared.
## Chapter 8 – Visual Legend (Colors, Shapes & Actions)
For quick reading inside TradingView, the visual elements are described line by line instead of a table.
Chart Element: Green Box
Color / Shape: Transparent green rectangle
Core Meaning: Bullish Order Block (Demand Zone)
Suggested Trader Response: Look for longs, Smart DCA adds, closing or reducing shorts.
Chart Element: Red Box
Color / Shape: Transparent red rectangle
Core Meaning: Bearish Order Block (Supply Zone)
Suggested Trader Response: Look for shorts, or take profit on existing longs.
Chart Element: Yellow Area
Color / Shape: Transparent yellow zone
Core Meaning: Bullish FVG / upside imbalance
Suggested Trader Response: Short take-profit zone or expected rebalance area.
Chart Element: Purple Area
Color / Shape: Transparent purple zone
Core Meaning: Bearish FVG / downside imbalance
Suggested Trader Response: Long take-profit zone or temporary supply region.
Chart Element: Green "DCA" Label
Color / Shape: Green label with white text, plotted below the candle
Core Meaning: Smart ladder-in buy zone, DCA buy opportunity
Suggested Trader Response: Spot DCA entry, partial short exit.
Chart Element: Red "SELL" Label
Color / Shape: Red label with white text, plotted above the candle
Core Meaning: Overbought / distribution zone
Suggested Trader Response: Take profit on longs, consider initiating shorts.
Chart Element: Light Green Background (bgcolor)
Color / Shape: Very transparent light-green background behind bars
Core Meaning: Active DCA Buy zone
Suggested Trader Response: Treat as a discount zone on the chart.
Chart Element: Orange Bar on Right
Color / Shape: Transparent orange horizontal bar in the volume profile
Core Meaning: POC – price with highest traded volume
Suggested Trader Response: Strong support or resistance; key reference level.
Chart Element: Blue Bars on Right
Color / Shape: Transparent blue horizontal bars in the volume profile
Core Meaning: Other volume levels, showing high-volume and low-volume nodes
Suggested Trader Response: Use to identify balance zones (HVN) and fast-move corridors (LVN).
Chart Element: Pink "Spring" Diamond
Color / Shape: Pink diamond with white text below the candle
Core Meaning: Wyckoff Spring – liquidity grab and potential major bullish reversal
Suggested Trader Response: One of the strongest long signals in the suite; look for high-quality long setups with tight risk.
Chart Element: STRONG LONG in Dashboard
Color / Shape: Green background, white text in the Signal row
Core Meaning: Multiple bullish layers in confluence
Suggested Trader Response: Consider initiating or increasing longs with strict risk management.
Chart Element: STRONG SHORT in Dashboard
Color / Shape: Red background, white text in the Signal row
Core Meaning: Multiple bearish layers in confluence
Suggested Trader Response: Consider initiating or increasing shorts with a logical, well-placed stop.
## Chapter 9 – Timeframe-Based Trading Playbook
### 9.1 Timeframe Selection
- Scalping
- Timeframes: 1M, 5M, 15M
- Objective: fast intraday moves (minutes to a few hours).
- Recommendation: focus on SMC + Wyckoff.
Smart DCA on very low timeframes may introduce excessive noise.
- Day Trading
- Timeframes: 15M, 1H, 4H
- Provides a good balance between signal quality and frequency.
- Recommendation: use the full stack – SMC + DCA + Volume Profile + Wyckoff + Dashboard.
- Swing Trading & Position Investing
- Timeframes: Daily, Weekly
- Emphasis on Smart DCA + Volume Profile.
- SMC and Wyckoff are used mainly to fine-tune swing entries within larger trends.
### 9.2 Scenario A – Scalping Long
Example: 5-Minute Chart
1. Price is declining into a green OB (Bullish Demand).
2. A candle with a long lower wick and bullish close (Pin Bar / Rejection) forms inside the OB.
3. A Spring diamond appears below the same candle → very strong confluence.
4. The Dashboard shows at least WEAK LONG ↗, ideally STRONG LONG 🚀.
5. Entry:
- On the close of the confirmation candle, or
- On the first pullback into the mid-range of that candle.
6. Stop-loss:
- Slightly below the OB.
7. Targets:
- Nearby bearish FVG above, and/or
- The next red OB.
### 9.3 Scenario B – Day-Trading Short
Recommended Timeframes: 1H or 4H
1. The market completes a strong impulsive move upward.
2. Price enters a red Order Block (Supply).
3. In the same zone, a purple FVG appears or remains unfilled.
4. On a lower timeframe (e.g., 15M), RSI enters overbought territory and a DCA Sell signal appears.
5. The main timeframe Dashboard (1H) shows WEAK SHORT ↘ or STRONG SHORT 🩸.
Trade Plan
- Open a short near the upper boundary of the red OB.
- Place the stop above the OB or above the last swing high.
- Targets:
- A yellow FVG lower on the chart, and/or
- The next green OB (Demand) below.
### 9.4 Scenario C – Swing / Investment with Smart DCA
Timeframes: Daily / Weekly
1. On the daily or weekly chart, each time a green “DCA” label appears:
- Allocate a fixed fraction of your capital (e.g., 3–5%) to that asset.
2. Check whether this DCA zone aligns with the orange POC of the Volume Profile:
- If yes → the quality of the entry zone is significantly higher.
3. If the DCA signal sits inside a daily green OB, the probability of a medium-term bottom increases.
4. Always build the position laddered, never all-in at a single price.
Exits for investors:
- Near weekly red OBs or large purple FVG zones.
- Ideally via partial profit-taking rather than closing 100% at once.
### 9.5 Case Study 1 – BTCUSDT (15-Minute)
- Context: Price has sold off down towards 65,000 USD.
- A green OB had previously formed at that level.
- Near the lower boundary of this OB, a partially filled yellow FVG is present.
- As price returns to this region, a Spring appears.
- The Dashboard shifts from NEUTRAL / WAIT to WEAK LONG ↗.
Plan
- Enter a long near the OB low.
- Place stop below the Spring low.
- First target: a purple FVG around 66,200.
- Second (optional) target: the first red OB above that level.
### 9.6 Case Study 2 – Meme Coin (PEPE – 4H)
- After a strong pump, price enters a corrective phase.
- On the 4H chart, RSI drops below 30; price breaks below the lower Bollinger Band → a DCA label prints.
- The Volume Profile shows the POC at approximately the same level.
- The Dashboard displays STRONG LONG 🚀.
Plan
- Execute laddered buys in the combined DCA + POC zone.
- Place a protective stop below the last significant swing low.
- Target: an expected 20–30% upside move towards the next red OB or purple FVG.
## Chapter 10 – Risk Management, Psychology & Advanced Tuning
### 10.1 Risk Management
No signal, regardless of its strength, replaces risk control.
Recommendations:
- In futures, do not expose more than 1–3% of account equity to risk per trade.
- Adjust leverage to the volatility of the instrument (lower leverage for highly volatile altcoins).
- Place stop-losses in zones where the idea is clearly invalidated:
- Below/above the relevant Order Block or Spring, not randomly in the middle of the structure.
### 10.2 Market-Specific Parameter Tuning
- Calmer Markets (e.g., major FX pairs)
- `ob_period`: 3–5.
- `bb_mult`: 2.0 is usually sufficient.
- Highly Volatile Markets (Crypto, news-driven assets)
- `ob_period`: 7–10 to highlight only the most robust OBs.
- `bb_mult`: 2.5–3.0 so that only extreme deviations trigger DCA.
- `vol_ma_len`: increase (e.g., to ~30) so that Spring triggers only on truly exceptional
volume spikes.
### 10.3 Trading Psychology
- STRONG LONG 🚀 does not mean “risk-free”.
It means the probability of a successful long, given the model’s logic, is higher than average.
- Treat Mars Signals as a confirmation and context system, not a full replacement for your own decision-making.
- Example of disciplined thinking:
- The Dashboard prints STRONG LONG,
- But price is simultaneously testing a multi-month macro resistance or a major negative news event is imminent,
- In such cases, trade smaller, widen stops appropriately, or skip the trade.
## Chapter 11 – Technical Notes & FAQ
### 11.1 Does the Script Repaint?
- Order Blocks and Springs are based on completed pivot structures and confirmed candles.
- Until a pivot is confirmed, an OB does not exist; after confirmation, behavior is stable under classic SMC assumptions.
- The script is designed to be structurally consistent rather than repainting signals arbitrarily.
### 11.2 Computational Load of Volume Profile
- On the last bar, the script processes up to `vp_lookback` bars × `vp_rows` rows.
- On very low timeframes with heavy zooming, this can become demanding.
- If you experience performance issues:
- Reduce `vp_lookback` or `vp_rows`, or
- Temporarily disable Volume Profile (`show_vp = false`).
### 11.3 Multi-Timeframe Behavior
- This version of the script is not internally multi-timeframe.
All logic (OB, DCA, Spring, Volume Profile) is computed on the active timeframe only.
- Practical workflow:
- Analyze overall structure and key zones on higher timeframes (4H / Daily).
- Use lower timeframes (15M / 1H) with the same tool for timing entries and exits.
## Conclusion
Mars Signals – Ultimate Institutional Suite v3.0 (Joker) is a multi-layer trading framework that unifies:
- Price structure (Order Blocks & FVG),
- Statistical behavior (Smart DCA via RSI + Bollinger),
- Volume distribution by price (Volume Profile with POC, HVN, LVN),
- Liquidity events (Wyckoff Spring),
into a single, coherent system driven by a transparent Confluence Scoring Engine.
The final output is presented in clear, actionable language:
> STRONG LONG / WEAK LONG / NEUTRAL / WEAK SHORT / STRONG SHORT
The system is designed to support professional decision-making, not to replace it.
Used together with strict risk management and disciplined execution,
Mars Signals – UIS v3.0 (Joker) can serve as a central reference manual and operational guide
for your trading workflow, from scalping to swing and investment positioning.

Advanced Triple Strategy ScalperHere are the three scalping strategies presented in the video "3 Scalping Strategies That Work Every Day (Backtested & Proven)" by Asia Forex Mentor – Ezekiel Chew:
### Scalper’s Trend Filter (Triple EMA)
This strategy uses three EMAs (25, 50, 100) on the 5-minute chart to filter high-probability trades aligned with momentum .
- Only trade when all three EMAs are angled in the same direction and clearly separated (no crossing or tangling) .
- Enter when price pulls back toward the 25 or 50 EMA and then bounces back toward the 25 EMA, but do not enter if price closes below the 100 EMA .
- Set stop-loss just below the 50 EMA or swing low and aim for a risk-to-reward ratio of 1:1.5 .
### Flip Zone Trap (Reversal Catching)
This method identifies precise reversal moments where market structure shifts from weakness to strength .
- Use the 15-min chart to locate key support or resistance zones where price previously reacted .
- Wait for price to stop making lower lows and begin making higher highs (or vice versa for shorts); confirm with a trendline break AND follow-through (higher lows & highs within 5-7 candles) .
- Use confirmation candles (bullish engulfing, pin bar rejection) at the zone before entry .
### Liquidity Shift Trigger (Smart Money Trap)
This system leverages institutional stop hunts and liquidity sweeps at key zones for sniper entries .
- Start with a 15-min chart to identify structure breaks and points of interest (order blocks, flip zones, demand zones) .
- Drop to 1-min chart and wait for price to enter the refined zone and sweep liquidity (sharp wick/spike below/above key level) .
- Once liquidity is swept, wait for a clean structure shift (break of most recent internal high or low) within 5–6 candles—if confirmed, refine entry to the candle that caused the break and enter when price returns to that candle with a strong reaction .
***
### Practical Application
- These strategies are systematic, rule-based, and designed to cut out fake moves, avoid early stop-outs, and align entries with momentum and institutional activity .
- Perfect for short timeframes and volatile pairs like XAUUSD, especially if paired with additional confirmation from other technical analysis tools .
All three strategies emphasize filtering noise, waiting for momentum/trend confirmation, and avoiding impulsive entries—key principles for consistent scalping success

DeltaFlow Matrix═════════════════─────────
DELTAFLOW MATRIX - COMPLETE GUIDE
For 1-Minute Scalping
═════════════════─────────
───────────────────────────────────────
📊 VISUAL ELEMENTS EXPLAINED (What You See on the Chart)
───────────────────────────────────────
🟦🟥 RED/GREEN BARS ON THE RIGHT = Delta Flow Direction
The horizontal bars extending right from your chart show WHO controlled the price at each level. Green = bulls won, Red = bears won. Longer bars = more volume traded at that price. Example: If BTC is at $100,000 and you see a massive green bar, that means buyers aggressively absorbed all sell orders at that exact price level.
📊 GRADIENT BACKGROUND (Heat Map) = Volume Intensity
The colored background behind the bars shows volume concentration. Darker/more opaque = heavy trading, lighter/transparent = light trading. Example: A dark background at $99,800 means that's where most traders are positioned - it's a "magnet price" where BTC keeps returning.
🟩 GREEN BOX WITH BORDER = POC (Point of Control)
This is THE most important price on your chart - where the absolute highest volume traded. This is where the majority of traders are stuck. Example: POC at $99,950 means most BTC holders bought/sold there. Price will be magnetically pulled back to test this level repeatedly.
⬜ WHITE DOTTED LINES = VA High and VA Low (Value Area)
These lines contain 70% of all trading volume. Think of them as "fair price boundaries." Example: VA High at $100,200, VA Low at $99,700 means BTC's "fair value range" is $99,700-$100,200. Breakouts above/below these lines are significant moves.
💜 MAGENTA BORDER ON BARS = MICRO-SR (Micro Support/Resistance)
These magenta-outlined bars mark high-frequency support/resistance zones where price repeatedly bounced. These are your scalping zones. Example: MICRO-SR at $99,975 means BTC touched this price multiple times in the last 100 bars - it's a critical battle line for 1-minute scalpers.
🟡 GOLD TEXT "BULL EXHAUST" / "BEAR EXHAUST" = Exhaustion Zones
When one side dominated the volume BUT the trend is dying. This is where the big money got tired. Example: "BULL EXHAUST" at $100,100 means buyers pushed hard but are running out of steam - expect a reversal or consolidation soon.
🔵 CYAN TEXT "FLOW SHIFT ↑" / "FLOW SHIFT ↓" = Institutional Reversal
This is the holy grail - when delta completely flipped from bearish to bullish (or vice versa) with increasing volume. This marks where institutions changed their position. Example: "FLOW SHIFT ↑" at $99,900 means selling pressure just turned into aggressive buying - the big players reversed direction.
🟠 ORANGE TEXT "FAILED SHIFT ↑" / "FAILED SHIFT ↓" = Failed Institutional Reversal
When a FLOW SHIFT appears but then gets rejected by the opposite side within 3-10 bars. This means institutions TRIED to reverse but couldn't - the other side is defending hard. Example: "FAILED SHIFT ↑" at $99,900 means bulls attempted to take control but bears defended and stopped the reversal - this is a bearish sign, price likely continues down.
🟢 GREEN "COILED" LABEL BELOW PRICE = Bullish Compression Setup
When price is compressed below VA Low with 5+ MICRO-SR resistance levels stacked overhead AND bullish momentum is building. This is a spring-loaded long setup - price is coiled under resistance ready to explode upward. Example: BTC at $99,700, VA Low at $100,000, 7 MICRO-SR levels stacked from $100,100-$100,400, and delta shows +45 with bullish flow → "COILED" appears. This means price is compressed like a spring with bullish pressure building - when it breaks, it will rip through all those overhead levels fast.
🔴 RED "COILED" LABEL ABOVE PRICE = Bearish Compression Setup
When price is extended above VA High with 5+ MICRO-SR support levels stacked below AND bearish momentum is building. This is a spring-loaded short setup - price is coiled above support ready to crash downward. Example: BTC at $100,500, VA High at $100,200, 6 MICRO-SR levels stacked from $100,000-$99,700, and delta shows -52 with bearish flow → "COILED" appears. This means price is compressed with bearish pressure building - when it breaks down, it will slice through all those support levels.
🔴🟢 "REJECT" LABEL = Failed Breakout / Rejection
When price enters a cluster zone (resistance or support) but shows opposite momentum - the breakout attempt failed. Example: Price pushed up into overhead resistance at $100,200 but delta turns bearish (-38) → "REJECT" appears in red above price. This means the breakout attempt was rejected, bulls who entered are trapped, expect reversal down.
⚠️ "WALL ↑" / "WALL ↓" = Resistance/Support Wall Alert
When 5+ MICRO-SR levels are stacked together creating a "wall" of resistance or support. These are significant barriers where price will likely stall or reverse. Example: "WALL ↑ 7x" means there are 7 MICRO-SR resistance levels stacked above current price - breaking through this will be very difficult without strong momentum and volume.
🔴🟢 "BULL ATTACK" / "BEAR ATTACK" = Aggressive Momentum
One side is attacking with both high delta AND increasing volume. This is active warfare. Example: "BEAR ATTACK" at $100,050 means sellers are aggressively dumping with rising volume - price is likely to drop fast.
🛡️ "BULL DEFENSE" / "BEAR DEFENSE" = Holding the Line
One side has high delta but volume is flat or decreasing - they're defending a level, not pushing. Example: "BULL DEFENSE" at $99,850 means buyers are absorbing sells to prevent BTC from dropping further, but they're not strong enough to push up yet.
⚖️ "EQUILIBRIUM" / "ROTATION" = Balanced Market
Bulls and bears are equally matched - perfect for range trading, terrible for breakout trades. Example: "EQUILIBRIUM" at $100,000 means the market is perfectly balanced here - trade the range, don't chase breakouts.
📈📉 "UP" / "DN" ARROWS = Volume Trend
Small green "UP" or red "DN" labels show if volume is increasing or decreasing at that price level over time. Example: "UP" at $99,900 means more traders are entering positions at this price compared to earlier - this level is becoming more important.
⇈⇊ DOUBLE ARROWS = Delta Momentum Acceleration
These show when delta is accelerating rapidly - not just strong, but GETTING STRONGER. Example: ⇈ at $100,050 means bullish delta isn't just high, it's accelerating - expect explosive upward movement.
🟢🔴 VELOCITY BANDS (Horizontal bars far right) = Volume Acceleration
Thin horizontal bars extending from the profile show how fast volume is building. Green = volume accelerating up, Red = volume accelerating down. Example: Green velocity band at $100,100 means volume is spiking at this level right now - action is heating up.
💜 "x3.8" LABEL ABOVE CANDLE = Volume Spike Signal
Magenta text showing volume multiplier. Example: "x3.2" above a BTC candle means this candle had 3.2 times the average volume - something big just happened (news, liquidation cascade, whale entry).
🟢🔴 THICK LINE AT VA HIGH/LOW = Breakout with Momentum
When BTC breaks the VA line, the line changes:
- Thin line (width 2) = Weak breakout (<30Δ momentum)
- Medium line (width 3) = Medium breakout (30-60Δ)
- Thick dashed line (width 4) = STRONG breakout (>60Δ) - THIS IS THE FLASH
The label also changes: "VA High 72Δ V✓ STRONG" = 72 delta momentum, volume confirmed, strong breakout.
🔵 CYAN DASHED LINE AT POC = POC Bounce Flash
A short cyan dashed line appears when BTC bounces off the POC with a bullish reversal candle. This is your highest-probability long entry - the POC "magnet" just pulled price back and bulls are responding.
───────────────────────────────────────────────
🧠 PATTERN COMBINATIONS = Market Psychology (What Traders Are Thinking)
───────────────────────────────────────────────
🚀 PATTERN 1: "The Nitro Boost" (Highest Win Rate)
WHAT YOU SEE: FLOW SHIFT ↑ appears below current price + only MICRO-SR (magenta) levels above + Volume Spike (x2.5+)
PSYCHOLOGY: Big money just reversed from selling to buying. Retail still thinks it's going down. All the nearby resistance levels are weak (just micro-levels). The explosion in volume means someone BIG just entered.
EXAMPLE: BTC at $99,900, FLOW SHIFT ↑ just appeared, above you see MICRO-SR at $100,000, $100,050, $100,100 with no major resistance. Volume spike shows x3.1. → Institutions flipped bullish and the path of least resistance is UP. These MICRO-SR levels will be blown through like paper.
TRADE: Long immediately, targets at each MICRO-SR level, stop below the FLOW SHIFT price.
💎 PATTERN 2: "The Wall" (Reversal Setup)
WHAT YOU SEE: BULL/BEAR EXHAUST at a price level + Price approaching POC from above/below + Delta momentum arrows (⇊) pointing opposite to price movement
PSYCHOLOGY: One side pushed too hard and ran out of gas right as they're approaching the most important price level (POC). Delta momentum is reversing. The "wall" of volume at POC will reject them.
EXAMPLE: BTC pushed from $99,800 to $100,200, now "BULL EXHAUST" appears at $100,200. POC is at $100,000. You see ⇊ (bearish delta acceleration). → Bulls exhausted themselves pushing up, POC will act as resistance, bears are accelerating. Price will get rejected back down.
TRADE: Short at current price, target is POC at $100,000, stop above the exhaust level.
⚔️ PATTERN 3: "The War Zone" (Stay Out)
WHAT YOU SEE: BULL ATTACK and BEAR ATTACK labels alternating rapidly + EQUILIBRIUM or ROTATION at current price + VA lines very close together
PSYCHOLOGY: Bulls and bears are in full battle mode, neither side is winning. The market is chopping violently in a tight range. This is where retail gets destroyed by whipsaw.
EXAMPLE: BTC bouncing between $99,900-$100,100. "BULL ATTACK" at $100,000, "BEAR ATTACK" at $100,050, "EQUILIBRIUM" at $100,025. VA High at $100,100, VA Low at $99,900. → Pure chaos. Both sides throwing punches, nobody winning.
TRADE: STAY OUT. Wait for exhaustion or flow shift. If you must trade, use very tight ranges (buy at VA Low, sell at VA High, 5-tick stops).
🎯 PATTERN 4: "The Breakout Confirmation" (High Confidence)
WHAT YOU SEE: VA breakout with STRONG label + Volume spike (x2.0+) + FLOW SHIFT in breakout direction + No major resistance for 50+ ticks
PSYCHOLOGY: Every signal is aligned. Price broke the fair value range WITH strong momentum, WITH volume confirmation, WITH institutional flow reversal. This is the "perfect storm" breakout.
EXAMPLE: BTC breaks VA High at $100,200. Label changes to "VA High 68Δ V✓ STRONG" (thick dashed line). Volume spike shows x2.8. FLOW SHIFT ↑ appears at $100,210. Next resistance is MICRO-SR at $100,400. → This is as good as it gets. Institutions are buying, retail FOMO is coming, momentum is strong.
TRADE: Long on the breakout, targets at +100 ticks ($100,300), +200 ticks ($100,400), trail stop below the breakout candle.
🛡️ PATTERN 5: "The Failed Breakout" (Fade Setup)
WHAT YOU SEE: VA breakout with WEAK label + No volume spike + DEFENSE label appears (opposite side) + Delta momentum arrows pointing back into VA
PSYCHOLOGY: Price tried to break out but without conviction. No volume = no big players interested. The defending side is holding the line. Breakout traders are about to get trapped.
EXAMPLE: BTC breaks VA High at $100,200. Label shows "VA High 23Δ WEAK" (thin line). No volume spike. "BEAR DEFENSE" appears at $100,220. You see ⇊ (bearish acceleration). → Weak breakout, bears defending, momentum reversing. Bull breakout traders are trapped.
TRADE: Short the failed breakout, target is back inside VA (POC at $100,000), stop above the high.
🧲 PATTERN 6: "The POC Magnet" (Mean Reversion)
WHAT YOU SEE: Price far from POC (100+ ticks away) + Volume decreasing (DN arrows) + No ATTACK or FLOW SHIFT labels + MICRO-SR levels between current price and POC
PSYCHOLOGY: Price overextended from the most important level. No new aggressive volume is coming in. Market is tired. Like a rubber band, price will snap back to POC where most traders are positioned.
EXAMPLE: BTC at $100,350, POC at $100,000 (350 ticks away). "DN" arrows showing volume declining. "ROTATION" at current price. MICRO-SR at $100,300, $100,200, $100,100. → Overextended, running out of steam, POC will pull it back.
TRADE: Short with targets at each MICRO-SR level on the way down to POC, final target at POC itself.
💥 PATTERN 7: "The Liquidation Cascade" (Momentum Continuation)
WHAT YOU SEE: Multiple consecutive candles with volume spikes (x2.5+) + ATTACK label same direction + Delta momentum arrows same direction (⇈ or ⇊) + Breaking through MICRO-SR levels without stopping
PSYCHOLOGY: Liquidations are triggering more liquidations. Stop losses are getting hit, triggering more stop losses. This is a cascade - it won't stop until hitting POC or VA boundary. Retail is getting destroyed, institutions are feasting.
EXAMPLE: BTC drops from $100,200. Candles show x2.7, x3.1, x2.9 volume spikes. "BEAR ATTACK" at every level. ⇊ arrows accelerating. MICRO-SR levels at $100,100, $100,000, $99,900 all getting destroyed. POC at $99,750. → Liquidation cascade in progress. Won't stop until POC.
TRADE: If you're in the direction, hold until POC. If not in, wait for POC to enter counter-trend. DO NOT try to catch this knife early.
🔄 PATTERN 8: "The Reversal Confirmation" (Highest Probability Entry)
WHAT YOU SEE: POC Bounce Flash (cyan dashed line) + FLOW SHIFT in new direction + Volume spike + Price bouncing off POC with bullish/bearish engulfing candle
PSYCHOLOGY: Price hit the most important level (POC) and institutions just reversed direction. This is THE signal. The magnet worked, price came back to POC, and big money is now pushing it the other way.
EXAMPLE: BTC drops to POC at $100,000. Cyan dashed POC bounce flash appears. Bullish engulfing candle. "FLOW SHIFT ↑" appears. Volume spike x2.6. → Perfect reversal setup at the most important price level with institutional confirmation.
TRADE: Long at POC, target next MICRO-SR or VA High, stop below POC. This is your highest win-rate setup.
🎪 PATTERN 9: "The Fake-Out Trap" (Avoid or Fade)
WHAT YOU SEE: FLOW SHIFT appears + No volume spike + EXHAUST label appears within 3-5 candles same direction + Delta momentum arrows reverse
PSYCHOLOGY: Someone tried to fake a reversal (maybe a whale painting the tape) but there's no real follow-through. The move exhausted immediately. Traders who followed the FLOW SHIFT are about to get trapped.
EXAMPLE: "FLOW SHIFT ↑" appears at $99,950. No volume spike. Within 3 candles, "BULL EXHAUST" appears at $100,000. ⇊ arrows appear. → False reversal, trap set, traders entering longs are getting baited.
TRADE: Fade it. Short when exhaust appears, target back below the fake FLOW SHIFT level.
🏆 PATTERN 10: "The Perfect Storm Long" (All Systems Go)
WHAT YOU SEE: Price above POC + FLOW SHIFT ↑ + VA Low breakout with STRONG + Volume spike + Only MICRO-SR resistance above + BULL ATTACK label + ⇈ acceleration
PSYCHOLOGY: Everything aligned bullish. Institutions buying, momentum strong, volume confirming, path clear. This is when retail FOMO kicks in and you get the biggest moves.
EXAMPLE: BTC at $100,100. POC at $100,000 (above POC ✓). "FLOW SHIFT ↑" at $100,050 ✓. "VA Low 71Δ V✓ STRONG" breakout ✓. Volume x3.4 ✓. MICRO-SR at $100,300, $100,500 (weak resistance) ✓. "BULL ATTACK" ✓. ⇈ arrows ✓. → Every single bullish signal firing. This is the setup you wait for all day.
TRADE: Long with size, targets at +200 ticks minimum, trail aggressively, stop only if FLOW SHIFT reverses.
🎯 PATTERN 11: "The Coiled Spring" (High Probability Breakout)
WHAT YOU SEE: "COILED" label appears + 5-8 MICRO-SR levels stacked in breakout direction + Delta +30 or higher (for long) / -30 or lower (for short) + Price compressed below VA Low (long) or above VA High (short)
PSYCHOLOGY: Price is compressed in a weak position with heavy resistance/support overhead, BUT institutions are building momentum in the direction of the breakout. When it breaks, all those clustered MICRO-SR levels will be blown through rapidly because the spring is loaded. This is the setup where you get 100-200 tick moves in minutes.
EXAMPLE: BTC at $99,650. VA Low at $100,000. "COILED" (green) appears below price. WALL ↑ 8x showing 8 MICRO-SR levels from $100,100-$100,800. Delta shows +47. FLOW SHIFT ↑ just appeared. → Price is coiled below massive resistance wall with strong bullish momentum building. When VA Low breaks, the spring releases and price will rip through all 8 resistance levels.
TRADE: Long when price breaks VA Low with volume confirmation, targets at each MICRO-SR cluster (+100, +200, +300 ticks), trail stop below breakout candle. This is your "moonshot" setup.
🛑 PATTERN 12: "The Failed Shift Trap" (Fade Setup)
WHAT YOU SEE: "FAILED SHIFT ↑" or "FAILED SHIFT ↓" appears + Strong opposite momentum (⇊ for failed bull shift, ⇈ for failed bear shift) + No volume spike + Price back in original range
PSYCHOLOGY: Institutions attempted a reversal but the other side defended hard and rejected it. Traders who followed the FLOW SHIFT are now trapped. The failed reversal confirms the original trend will continue - the defending side is in control.
EXAMPLE: BTC pushed from $100,200 to $99,900. "FLOW SHIFT ↓" appeared at $100,100 signaling bearish reversal. Within 5 bars, bulls defended at $99,850, pushing price back to $100,000. "FAILED SHIFT ↓" now appears at $100,100 with ⇈ (bullish acceleration). → Bears tried to reverse trend but failed. Bulls defended successfully. Original uptrend continues.
TRADE: Fade the failed shift. If "FAILED SHIFT ↓" appears, go long (bulls won the battle). If "FAILED SHIFT ↑" appears, go short (bears won). Target is back to the other side of the range.
⚠️ PATTERN 13: "The Wall Collision" (High Risk, High Reward)
WHAT YOU SEE: "WALL ↑" or "WALL ↓" with 6+ levels + Price approaching wall with strong momentum (ATTACK label) + Volume spike + Delta accelerating (⇈ or ⇊)
PSYCHOLOGY: Unstoppable force meeting immovable object. Price is charging at a massive wall of resistance/support with strong momentum. Either it breaks through explosively OR it gets rejected violently. This is binary - huge win or huge loss.
EXAMPLE: BTC at $100,050 with "BULL ATTACK" and ⇈ arrows. Volume x3.2. Approaching "WALL ↑ 9x" at $100,200-$100,600. POC at $100,300 (inside the wall). → Bulls charging at massive resistance wall with strong momentum. If they break through, it's explosive. If rejected, crash back down.
TRADE: ADVANCED ONLY. Wait for the collision. If price breaks through wall with FLOW SHIFT confirmation + volume spike, go long immediately with tight stop. If price gets REJECTED (bearish delta appears at wall), short immediately targeting POC. DO NOT enter before knowing the outcome.
🔄 PATTERN 14: "The Rejection Reversal" (Counter-Trend Entry)
WHAT YOU SEE: "REJECT" label appears + Price in cluster zone + Opposite side DEFENSE or ATTACK label appears + Delta momentum reverses (⇈ to ⇊ or vice versa)
PSYCHOLOGY: The breakout failed, trapped traders are exiting, and the opposite side is now attacking the weak hands. This creates fast moves back in the original direction.
EXAMPLE: BTC breaks VA High to $100,250. Weak volume, delta only +22. Enters overhead MICRO-SR cluster. "REJECT" appears in red. "BEAR DEFENSE" appears at $100,280. ⇊ arrows appear. → Breakout failed, bulls trapped, bears attacking. Price will reverse fast.
TRADE: Counter-trend entry in direction of REJECT. Short when "REJECT" appears with bearish confirmation, target is back to POC or VA Low. Stop above the rejection high. Fast scalp.
───────────────────────────────────────────────────────────────────────────────
⚡ QUICK REFERENCE CHEAT SHEET
───────────────────────────────────────────────────────────────────────────────
SAFEST ENTRIES (Highest Win Rate):
✅ POC Bounce Flash + FLOW SHIFT (Pattern 8)
✅ FLOW SHIFT + Only MICRO-SR above + Volume Spike (Pattern 1)
✅ Strong VA Breakout + Volume Spike + FLOW SHIFT (Pattern 4)
✅ COILED label + Multiple stacked MICRO-SR + Delta >30 (Pattern 11)
DANGER ZONES (Stay Out):
⛔ BULL ATTACK + BEAR ATTACK alternating (Pattern 3)
⛔ FLOW SHIFT + No volume + Quick exhaust (Pattern 9)
⛔ EQUILIBRIUM at current price with tight VA range
⛔ WALL collision without clear direction (Pattern 13 - wait for outcome)
FADE/REVERSAL SETUPS:
🔄 EXHAUST at price level + Approaching POC (Pattern 2)
🔄 Weak VA Breakout + DEFENSE opposite side (Pattern 5)
🔄 Price far from POC + Volume declining (Pattern 6)
🔄 FAILED SHIFT appears + Opposite momentum (Pattern 12)
🔄 REJECT label + Opposite ATTACK/DEFENSE (Pattern 14)
HOLD/MOMENTUM CONTINUATION:
🚀 Multiple volume spikes + ATTACK label + ⇈/⇊ arrows (Pattern 7)
🚀 All bullish/bearish signals aligned (Pattern 10)
🚀 COILED spring release through wall (Pattern 11)
═══════════════════════════════════════════════════════════
Remember: The indicator shows you WHERE the big money is (POC), WHAT they're doing (FLOW SHIFT), and HOW HARD they're doing it (volume spikes, momentum). Your job is to follow the big money, not fight them. When institutions shift, you shift. When they exhaust, you fade. When they're in a war, you stay out. Trade with the whales, not against them.
════════════════════════════════════════════════════════════
═══════════════════════════════════════════════════════════════════════════════
ENHANCED DELTA VOLUME PROFILE - TECHNICAL CALCULATIONS GUIDE
How Each Element is Actually Calculated
═══════════════════════════════════════════════════════════════════════════════
───────────────────────────────────────────────────────────────────────────────
🧮 CORE CALCULATIONS (The Math Behind What You See)
───────────────────────────────────────────────────────────────────────────────
📊 VOLUME BINS = Price range divided into 40 horizontal slices
The indicator takes the last 100 candles (configurable), finds the highest and lowest price touched, then divides that range into 40 equal "bins" (horizontal price levels). Each bin collects volume from candles that touched that price range. Example: BTC ranged from $99,500 to $100,500 in the last 100 bars. That's $1,000 range ÷ 40 bins = $25 per bin. Bin 1 = $99,500-$99,525, Bin 2 = $99,525-$99,550, etc.
🟦🟥 DELTA CALCULATION = (Bull Volume - Bear Volume) / Total Volume × 100
For each bin, the indicator separates bullish candles (close > open) from bearish candles (close < open). Delta = ((bull volume - bear volume) / total volume) × 100. This gives you a percentage from -100% (pure selling) to +100% (pure buying). Example: At $100,000, if 70 BTC was traded on green candles and 30 BTC on red candles, delta = ((70-30)/100) × 100 = 40% bullish.
🎨 GRADIENT COLOR = Delta converted to color spectrum
The delta percentage (-100 to +100) is mapped to a color gradient. -100% = pure bearish color (orange/red), 0% = neutral, +100% = pure bullish color (cyan/blue). The color you see on each bar directly represents the delta. Example: A bright cyan bar = high positive delta (strong buying), orange bar = high negative delta (strong selling), gray bar = balanced (delta near 0%).
🟩 POC (Point of Control) = Bin with the absolute highest total volume
The indicator sums up all volume in each of the 40 bins, then finds which bin has the most. That's your POC. Example: Bin 15 (around $100,000) collected 1,250 BTC of volume, which is more than any other bin. Bin 15 is your POC. This is where the most trading happened and where most traders are positioned.
⬜ VALUE AREA (VA) = The bins containing 70% of total volume, centered on POC
Starting from the POC, the indicator expands up and down, adding bins one at a time (choosing the bin with more volume each time) until it has captured 70% of all volume. The top of this range = VA High, bottom = VA Low. Example: POC at $100,000. Expanding out captures 70% of volume from $99,700 to $100,300. VA Low = $99,700, VA High = $100,300.
📈📉 VOLUME TREND = (Recent Volume - Old Volume) / Total Volume
The indicator splits your 100-bar lookback into three periods: Recent (last 15 bars), Mid (bars 15-30), and Older (last 15 bars of the 100). For each bin, it compares recent volume to older volume. If recent > older, trend is UP. If recent < older, trend is DOWN. Example: At $100,000, recent 15 bars had 80 BTC volume, older 15 bars had 40 BTC. Trend = (80-40)/(80+40) = 0.33 = UP. This shows volume is increasing at this level.
💜 MICRO-SR DETECTION = High volume (>60% of max) + High hits (>20% of max) + Active volume trend
A bin becomes MICRO-SR if: (1) Its volume is at least 60% of the highest-volume bin, (2) Price touched it frequently (at least 20% as many times as the most-touched bin), (3) Volume trend isn't flat (absolute trend > 0.05). Example: Bin at $99,975 has 750 BTC (75% of max), was hit 45 times (30% of max hits), volume trend = 0.08. = MICRO-SR (magenta border).
🟡 EXHAUSTION DETECTION = Extreme delta (>65%) + Declining volume trend (<-0.15) OR Extreme delta + Volume spike (>1.5× average)
Two ways to detect exhaustion: (1) One side dominated (delta > 65% or < -65%) BUT volume is decreasing (trend < -0.15), meaning participation is dropping. (2) Extreme delta WITH a huge volume spike (>1.5× average for that bin), meaning climactic volume. Example: At $100,200, delta = 72% bullish, but volume trend = -0.22 (declining). = BULL EXHAUST. Bulls won but are running out of steam.
🔵 FLOW SHIFT DETECTION = Delta changed sign (+ to - or - to +) + Delta change >40% + Volume trend increasing (>0.1)
Compares each bin's delta to the previous bin's delta. If delta flipped from negative to positive (or vice versa) by more than 40%, AND volume is increasing, = FLOW SHIFT. Example: Previous bin at $99,950 had -35% delta (bearish). Current bin at $100,000 has +45% delta (bullish). Change = 80% (flipped + exceeded 40%), volume trend = +0.15. = FLOW SHIFT ↑.
⇈⇊ DELTA MOMENTUM = Current delta - Average delta of last 3 bins
For each bin, the indicator looks at the previous 3 bins, calculates their average delta, then compares current delta to that average. If current delta is significantly higher/lower than the 3-bin average, momentum arrows appear. Example: Last 3 bins had deltas of 20%, 25%, 30% (average = 25%). Current bin delta = 55%. Momentum = 55 - 25 = +30 = ⇈ (strong bullish acceleration).
🟢🔴 VOLUME ACCELERATION = Rate of change of volume trend across three periods
Compares how volume changed from Old→Mid vs Mid→Recent. If Recent increased MORE than Mid did compared to Old, = positive acceleration. Formula: ((Recent-Mid) - (Mid-Old)) / |Mid-Old|. Example: Old=100, Mid=120, Recent=160. Mid increased by 20, Recent increased by 40. Acceleration = (40-20)/20 = 1.0 = strong acceleration (green velocity band).
⚖️ BALANCE SCORE = Combines volume balance, price range balance, and hit frequency
Three factors weighted equally: (1) How balanced is bull vs bear volume? (1 - |bull-bear|/total). (2) How tight is the price range? (1 - avgRange/maxRange). (3) How frequently was it hit? (hits/maxHits). Multiply these together. Score >0.7 = EQUILIBRIUM. Example: Volume is 55% bull / 45% bear = 0.9 balance. Range is tight = 0.8. Hit frequently = 0.85. Score = 0.9 × 0.8 × 0.85 = 0.61 = ROTATION.
📊 BULL/BEAR ATTACK/DEFENSE = Delta threshold (>60% or <-60%) + Volume trend direction
ATTACK = High delta (>60% either direction) + Volume trend increasing (>0.15). DEFENSE = High delta (>60% either direction) + Volume trend NOT increasing (≤0.15). Example: Delta = 68% bullish, volume trend = 0.22 = BULL ATTACK (buying with increasing volume). Delta = 68% bullish, volume trend = 0.05 = BULL DEFENSE (buying but volume not increasing).
───────────────────────────────────────────────────────────────────────────────
🎯 SIGNAL CALCULATIONS (The New Features)
───────────────────────────────────────────────────────────────────────────────
💜 VOLUME SPIKE = Current bar volume / 20-bar average volume
Takes the current candle's volume and divides it by the simple moving average of the last 20 candles' volume. If ratio >2.0 (configurable), spike detected. The label shows the exact multiplier. Example: Current candle = 450 BTC volume. 20-bar average = 140 BTC. Ratio = 450/140 = 3.21 = "x3.2" label appears in magenta above the candle.
🟢🔴 VA BREAKOUT MOMENTUM = POC bin's delta (absolute value)
When price breaks VA High or VA Low, the indicator looks at the POC bin's delta to measure momentum strength. Uses absolute value (ignore direction). <30 = WEAK, 30-60 = MED, >60 = STRONG. Line thickness and style change based on this. Example: BTC breaks VA High. POC bin delta = 72%. Momentum = 72 = STRONG. Line = width 4 (thick), dashed (flash effect), label shows "VA High 72Δ V✓ STRONG".
📊 BREAKOUT LINE THICKNESS = Momentum-based dynamic sizing
- Momentum <30: Line width = 2 (thin), solid line
- Momentum 30-60: Line width = 3 (medium), solid line
- Momentum >60: Line width = 4 (thick), dashed line (creates flash effect)
Example: Breakout with 45% momentum = width 3 solid line. Breakout with 75% momentum = width 4 dashed line (flashing).
✓ VOLUME CONFIRMATION = Current volume / 20-bar average >1.5
Checks if the breakout candle has strong volume. If current volume is at least 1.5× the 20-bar average, adds "V✓" to the label. Example: Breakout candle has 280 BTC volume, 20-bar average is 160 BTC. Ratio = 280/160 = 1.75 > 1.5 = "V✓" appears in label.
🔵 POC BOUNCE DETECTION = Price within 0.5 bin-step of POC + Bullish reversal candle + Previous candle was bearish
Three conditions must all be true: (1) Current close price is within half a bin's height from POC price. (2) Current candle is bullish (close > open). (3) Previous candle was bearish (close < open). If all true = POC bounce, cyan dashed flash line appears. Example: POC at $100,000, bin step = $25. Current close = $100,008 (within $12.50 of POC ✓). Current candle green ✓. Previous candle red ✓. = POC Bounce Flash.
───────────────────────────────────────────────────────────────────────────────
⚙️ TECHNICAL PARAMETERS (What You Can Adjust)
───────────────────────────────────────────────────────────────────────────────
🔢 LOOKBACK PERIOD (Default: 100 bars) = How much history to analyze
The number of candles backwards from current that get analyzed. More bars = more stable but slower to react. Fewer bars = more reactive but noisier. For 1-minute BTC scalping, 100 bars = last 100 minutes = 1 hour 40 minutes of data. Example: Setting to 50 bars makes it more reactive to recent action but less stable. Setting to 200 bars makes it smoother but slower to show new developments.
🎚️ NUMBER OF BINS (Default: 40) = Resolution of price levels
How many horizontal slices to divide the price range into. More bins = finer resolution but more noise. Fewer bins = smoother but less precise. 40 bins for 1-minute = good balance. Example: With $1,000 range, 40 bins = $25 per level. 20 bins would be $50 per level (less precise). 60 bins would be $16.67 per level (more precise but noisier).
📏 DISPLAY OFFSET (Default: 10 bars) = How far right the profile extends
How many bars to the right of current candle the volume profile displays. Purely visual - doesn't affect calculations. Example: Offset = 10 means the profile extends 10 bars to the right. Offset = 30 means it extends further right (more separation from candles).
📊 VOLUME TREND PERIOD (Default: 15 bars) = How many recent bars define "recent"
The number of bars considered "recent" vs "old" when calculating volume trends. Shorter = more sensitive to very recent changes. Longer = smoother trends. Example: 15 bars means "recent" = last 15 candles (last 15 minutes on 1m chart). Setting to 5 would make it hyper-reactive to the last 5 minutes. Setting to 30 would make it smoother.
🎯 EXHAUSTION THRESHOLD (Default: 65%) = How extreme delta must be for exhaustion
The minimum delta percentage to trigger exhaustion detection. Higher = more selective (only extreme cases). Lower = more signals but more false positives. Example: 65% means delta must be >65% or <-65% to qualify. Setting to 75% would only catch the most extreme exhaustion. Setting to 55% would catch more cases.
💜 MICRO-LEVEL THRESHOLD (Default: 60%) = How strong a level must be for MICRO-SR
The minimum volume percentage (relative to max) required for MICRO-SR detection. Higher = fewer, stronger levels. Lower = more levels but weaker. Example: 60% means bin must have at least 60% of the max bin's volume. Setting to 70% would show only the strongest levels. Setting to 50% would show more levels.
⚡ DELTA MOMENTUM PERIOD (Default: 3 bars) = How many bins to average for momentum
How many previous bins to average when calculating delta momentum. Shorter = more sensitive acceleration signals. Longer = smoother, less noisy. Example: 3 bins means compares current to average of last 3. Setting to 5 would smooth out momentum detection. Setting to 2 would make it more reactive.
🌊 FLOW SHIFT SENSITIVITY (Default: 40%) = Minimum delta change for flow shift
How much delta must change between consecutive bins to trigger FLOW SHIFT. Lower = more flow shift signals (more sensitive). Higher = fewer, stronger signals. Example: 40% means delta must flip by at least 40% (e.g., from -20% to +20% or from +10% to -30%). Setting to 60% would only catch major reversals. Setting to 25% would catch smaller shifts.
💥 VOLUME SPIKE THRESHOLD (Default: 2.0x) = Multiplier to trigger spike signal
How many times above average volume must be to show the spike label. Higher = fewer spikes shown (only extreme). Lower = more spikes shown. Example: 2.0× means current volume must be at least double the 20-bar average. Setting to 3.0× would only show massive spikes. Setting to 1.5× would show more moderate spikes.
🚀 BREAKOUT MOMENTUM MINIMUM (Default: 20%) = Minimum delta for breakout signal
How much delta momentum required at POC for VA breakout to trigger. Higher = fewer breakout signals (more selective). Lower = more signals but more false positives. Example: 20% means POC delta must be at least 20% (or -20%) when price breaks VA. Setting to 30% would only show strong breakouts. Setting to 10% would show weaker breakouts too.
───────────────────────────────────────────────────────────────────────────────
🔬 ADVANCED TECHNICAL DETAILS
───────────────────────────────────────────────────────────────────────────────
📐 BIN POSITIONING = Price-to-bin mapping formula
For any price P, its bin index = floor((P - MinPrice) / BinStep). BinStep = (MaxPrice - MinPrice) / NumBins. Example: Range $99,000-$100,000, 40 bins. BinStep = $1,000/40 = $25. Price $99,550 → Bin 22: (99,550 - 99,000) / 25 = 22.
📊 VOLUME DISTRIBUTION = Proportional allocation across bins
When a candle spans multiple bins, its volume is distributed proportionally based on how much of the candle's range overlapped each bin. Example: Candle from $99,950 to $100,050 (range = $100) with 50 BTC volume. Bin 1 ($99,950-$99,975) gets 25% of range = 12.5 BTC. Bin 2 ($99,975-$100,000) gets 25% = 12.5 BTC. Bin 3 ($100,000-$100,025) gets 25% = 12.5 BTC. Bin 4 ($100,025-$100,050) gets 25% = 12.5 BTC.
🎨 COLOR GRADIENT MAPPING = Delta to RGB conversion
Delta percentage is normalized to 0-1 scale (from -100/+100 range), then mapped to RGB gradient. -100% (0.0) = Full bearish color RGB. 0% (0.5) = Neutral gray. +100% (1.0) = Full bullish color RGB. Example: Delta = 60% → Normalized = 0.8 → 80% towards full bullish color (bright cyan).
⚖️ BALANCE SCORE FORMULA = Weighted geometric mean
BalanceScore = (VolumeBalance^w) × (PriceBalance^w) × (HitBalance^w), where w=weight (default 1.0). VolumeBalance = 1 - |BullVol - BearVol|/TotalVol. PriceBalance = 1 - AvgRange/MaxRange. HitBalance = Hits/MaxHits. Example: Vol=0.9, Price=0.8, Hit=0.7 → Score = 0.9 × 0.8 × 0.7 = 0.504.
🔄 DELTA HISTORY TRACKING = Rolling array per bin
Each bin maintains an array of its last N delta values (where N = delta momentum period). When calculating momentum, current delta is compared to the average of this array. Example: Bin's delta history = . Average = 25%. Current = 55%. Momentum = 55 - 25 = 30.
📈 VOLUME VELOCITY = Second derivative of volume
Measures acceleration of volume change. Recent change = (Recent - Mid). Old change = (Mid - Old). Acceleration = (Recent change - Old change) / |Old change|. Positive = accelerating. Negative = decelerating. Example: Old=100, Mid=150, Recent=220. Recent change = 70. Old change = 50. Accel = (70-50)/50 = 0.4 = 40% acceleration.
🎯 VA EXPANSION ALGORITHM = Greedy breadth-first from POC
Start at POC bin. While accumulated volume < 70% of total: Look at bin above and bin below POC boundary. Choose whichever has more volume. Add that bin to VA. Repeat. Example: POC at bin 20. Bin 21 (above) has 80 BTC, Bin 19 (below) has 95 BTC. Add bin 19. Now VA = bins 19-20. Next: Bin 21 has 80, Bin 18 has 70. Add bin 21. VA = bins 19-21. Continue until 70% captured.
⏱️ REAL-TIME UPDATES = Recalculates on every new bar close
The entire profile recalculates when barstate.islast = true (current bar). All 40 bins are cleared and rebuilt from scratch using the last N candles. This ensures the profile is always accurate to the current market state. Example: On 1-minute chart, the profile fully recalculates every 60 seconds when the new candle opens.
🎨 RENDERING OPTIMIZATION = 500-bar future limit management
TradingView limits drawing objects to 500 bars into the future. The indicator calculates safe offsets: maxFutureBar = bar_index + 499, then caps all box/line/label positions to stay under this limit. Example: Current bar_index = 1000. Max future = 1499. Display offset wanted = 200. Safe offset = min(200, 400 - 100) = min(200, 300) = 200 ✓ safe.
───────────────────────────────────────────────────────────────────────────────
💡 INTERPRETATION TIPS
───────────────────────────────────────────────────────────────────────────────
🔢 Understanding Percentages:
- Delta 0-30%: Weak bias, essentially balanced
- Delta 30-60%: Moderate bias, one side has control
- Delta 60-85%: Strong bias, one side dominated
- Delta 85-100%: Extreme bias, one-sided market (exhaustion likely)
📊 Volume Trend Interpretation:
- Trend -1.0 to -0.3: Strong decline in participation
- Trend -0.3 to -0.1: Moderate decline
- Trend -0.1 to +0.1: Stable/flat volume
- Trend +0.1 to +0.3: Moderate increase
- Trend +0.3 to +1.0: Strong increase in participation
🎯 Balance Score Ranges:
- 0.0-0.3: Heavily imbalanced, strong directional bias
- 0.3-0.5: Moderate imbalance, rotation forming
- 0.5-0.7: Balanced rotation zone
- 0.7-1.0: Perfect equilibrium, range-bound
⚡ Momentum Thresholds:
- <10: Negligible momentum change
- 10-20: Moderate acceleration
- 20-40: Strong acceleration (arrow appears)
- >40: Extreme acceleration (very rare, very significant)
═══════════════════════════════════════════════════════════════════════════════
Understanding these calculations helps you know WHY the indicator is showing what it's showing. When you see "FLOW SHIFT ↑", you now know it calculated a >40% delta flip with increasing volume. When you see MICRO-SR, you know that level has >60% of max volume, >20% of max hits, and active participation. When you see ⇈, you know delta jumped significantly above its 3-bin average. Use this knowledge to trust the signals and understand their strength.
═══════════════════════════════════════════════════════════════════════════════

Enhanced Multi-Indicator StrategyEnhanced Multi-Indicator Strategy v7 is a trend-following confirmation tool that combines several classic indicators into one clear “voting system.”
Instead of relying on a single signal, this script counts how many indicators agree on a bullish or bearish bias and only fires when the majority lines up and the trend is strong.
It’s designed to help you:
Filter out low-quality signals
Avoid trading against the dominant trend
Get clean, one-time BUY/SELL markers instead of noisy spam signals
How it Works
The indicator evaluates up to 10 components on each bar:
Trend & Structure
Moving Average (MA 50)
EMA Fast (20) vs EMA Slow (50)
Momentum
RSI (14)
MACD (12/26/9)
KDJ
Volatility & Price Location
Bollinger Bands (20, 2)
VWAP
Volume
Volume vs Volume MA (20)
Trend Strength & Direction
ADX + DMI (trend strength and up/down direction)
Optional
Ichimoku Cloud (price vs Senkou A/B)
Each indicator votes bullish or bearish.
The script then:
Counts how many are bullish → bullish_count
Counts how many are bearish → bearish_count
Requires at least Min Indicators for Entry (user-defined) to agree in one direction
Requires ADX above a threshold (default 20) to confirm trend strength
(Optionally) forces entries to follow the DMI trend:
Longs only in uptrends
Shorts only in downtrends
Only when these conditions are met does the script consider a valid long zone or short zone.
Signals: 1x Fire + Cooldown
To keep the chart clean and prevent over-trading:
A BUY arrow is plotted only on the first bar when price enters a new bullish zone.
A SELL arrow is plotted only on the first bar when price enters a new bearish zone.
A cooldown (in bars) can be configured separately for BUY and SELL so the script will not fire again in the same direction too frequently.
Background colors (optional):
Green background = bullish zone (majority indicators bullish + strong trend)
Red background = bearish zone (majority indicators bearish + strong trend)
This makes it easy to see when the “environment” is favorable for longs or shorts, while the arrows highlight the first opportunity in each zone.
Inputs & Tuning
Key inputs:
Min Indicators for Entry – how many indicators must agree (e.g. 5–7 for stricter filtering)
Strict Trend Filter – if enabled, entries must follow DMI trend (recommended for trend-following)
Cooldown BUY / SELL – minimum number of bars before a new signal in the same direction
Toggles to enable/disable each component (MA, EMA, RSI, MACD, KDJ, BB, Volume, VWAP, ADX, Ichimoku)
General ideas:
Increase Min Indicators for Entry and/or cooldown to reduce the number of signals and focus on stronger trends.
Lower values will make the indicator more active, suitable for shorter-term trading or scalping.
Important Note
This is an indicator, not a full trading system:
It does not manage entries/exits, position sizing, or risk by itself.
Always combine it with your own risk management, stop-loss / take-profit rules, and higher-timeframe context.
Use it as a confirmation / regime tool:
Trade only in the direction of the active zone,
Take BUY signals during bullish regimes,
Take SELL signals during bearish regimes.
