Dynamic Display for Max/Min MA Types with Fake-Out FilterDynamic Moving Average Max/Min Indicator with Step Line Break
**** select the setting to STEP LINE BREAK****
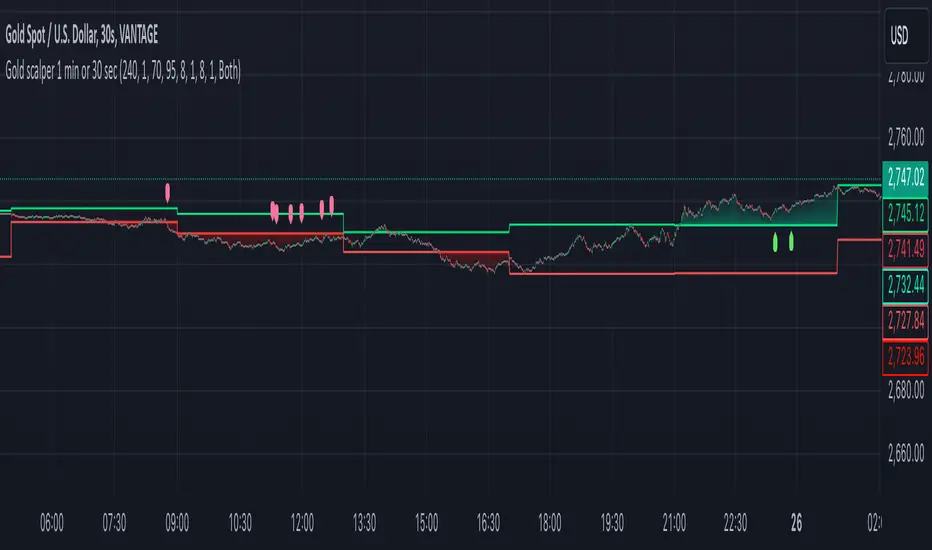
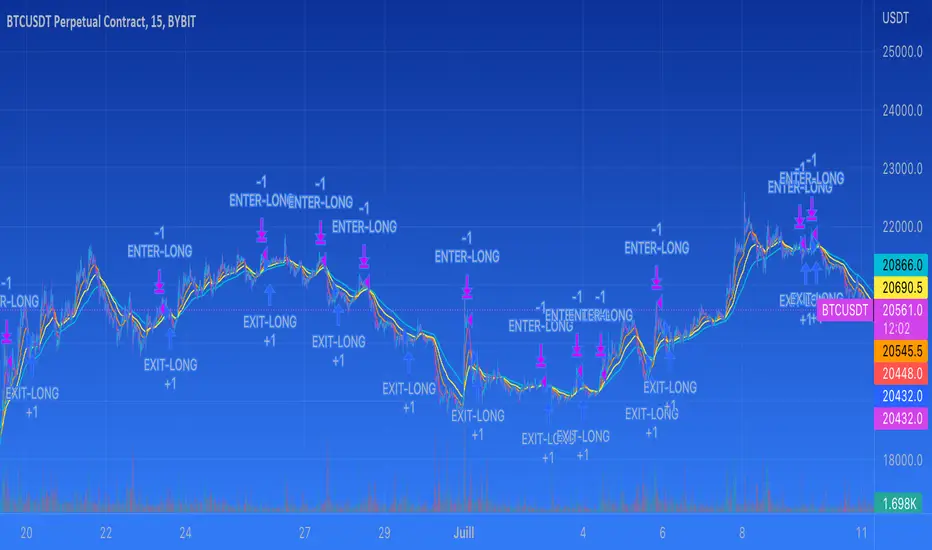
This indicator provides a powerful way to identify dynamic entry and stop-loss levels for both long and short trades. It calculates the maximum and minimum values of a selected moving average (MA) over a specified lookback period, adapting dynamically to market conditions. It features options for various MA types, including SMA, EMA, HMA, RMA, and DEMA, to suit different trading strategies and styles.
How It Works
1. Moving Average Selection: Choose the type of moving average (SMA, EMA, HMA, RMA, or DEMA) and its period (e.g., HMA 13).
2. Max/Min Calculation: The indicator calculates the highest and lowest values of the selected moving average over a specified lookback period (e.g., 5 candles).
3. Dynamic Plotting:
• Bullish Market: When the price breaks the Max MA level, the Min level is plotted, trailing upward as a potential stop-loss for long trades.
• Bearish Market: When the price breaks the Min MA level, the Max level is plotted, trailing downward as a potential stop-loss for short trades.
4. Fake-Out Filter: If a candle breaks the Max/Min level but closes within the range (indicating a fake-out), the plots do not switch. This can cause repainting during volatile conditions, so use caution in high-wick markets.
Features
• Customizable Inputs: Adjust MA type, period, lookback, and timeframe to suit your trading strategy.
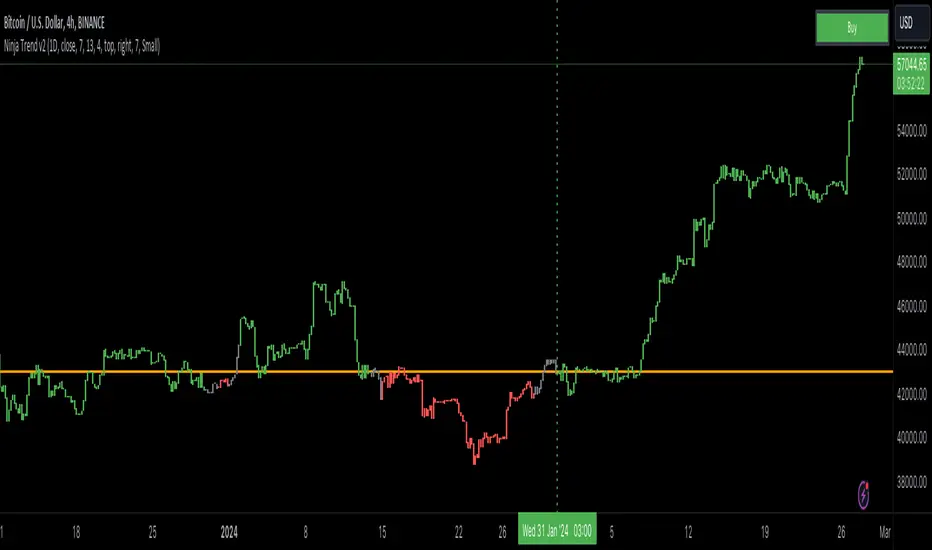
• Multi-Timeframe Flexibility: Works on all timeframes, from micro-scalping on the 1-minute chart to swing trading on higher timeframes.
• Trend Confirmation: Provides clear indications of when to enter or exit based on dynamic levels.
• Risk Management: Highlights stop-loss levels that trail the trend, helping to lock in profits or limit losses.
Advantages
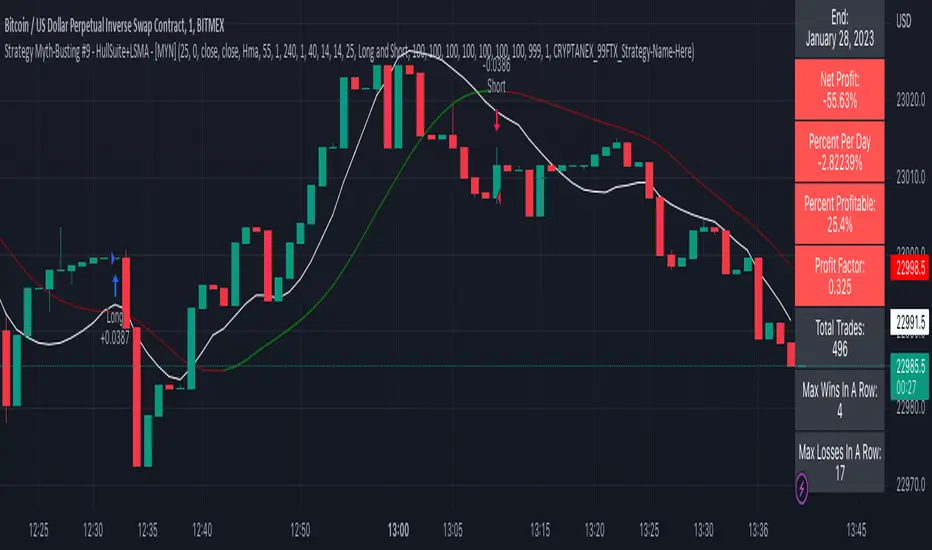
1. Clear Entry/Exit Points: Provides actionable signals for both long and short trades, with defined stop-loss locations.
2. Customizable for Any Style: Tailor the indicator to your product, timeframe, and trading approach (scalping or swing trading).
3. Trend-Focused Guidance: Helps avoid counter-trend trades by showing the dominant trend direction.
4. Adaptive to Market Conditions: The dynamic nature of the indicator allows it to respond to both trending and consolidating markets.
Limitations
1. Repainting During Fake-Outs: The indicator can repaint during volatile periods with long wicks, as it filters for fake-out candles. This may create noise in certain market conditions.
2. Optimization Required: The ideal settings for MA type, period, and lookback are dependent on the market profile and need to be fine-tuned by the trader.
3. Less Effective in Consolidation: In sideways or choppy markets, the indicator may produce less reliable signals unless adjusted for lower sensitivity.
Trading Tips
• Use this indicator to focus on trending markets, avoiding trades against the prevailing trend. For example, during an uptrend, only take long trades and avoid shorts.
• Consider having two configurations: one for trending markets and one for consolidating markets, switching between them as needed.
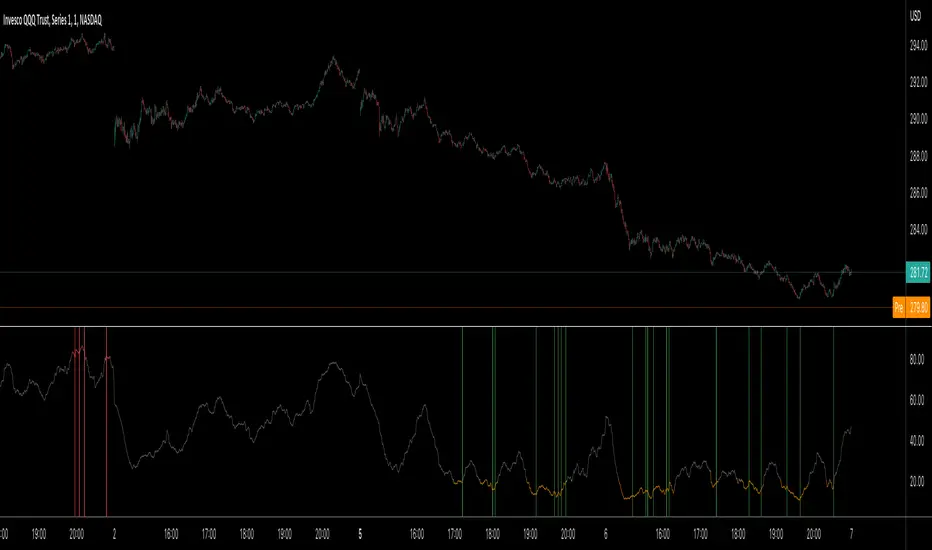
• Pair this indicator with volume analysis, price action, or other complementary tools to increase accuracy and reduce noise.
This indicator is designed to be both an entry and risk management tool, enabling traders to make informed decisions while keeping risks in check.
Pine Script® indicator